COVID-19 and Social Distancing in the Absence of Legal Enforcement: Survey Evidence from Japan
←
→
Page content transcription
If your browser does not render page correctly, please read the page content below
Munich Personal RePEc Archive

COVID-19 and Social Distancing in the
Absence of Legal Enforcement: Survey
Evidence from Japan

Shoji, Masahiro and Cato, Susumu and Iida, Takashi and
Ishida, Kenji and Ito, Asei and McElwain, Kenneth

University of Tokyo

28 May 2020

Online at https://mpra.ub.uni-muenchen.de/101968/
MPRA Paper No. 101968, posted 22 Jul 2020 07:28 UTC
COVID-19 and Social Distancing in the Absence of Legal Enforcement:

                               Survey Evidence from Japan

                                         Abstract

Do people keep social distance to mitigate the infection risk of COVID-19, even without

aggressive policy interventions? The Japanese government did not restrict individuals’

activities despite the early confirmation of infections, and as a result, economic damages

were limited in the initial stage of infection spread. Exploiting these features, we examine

the association between the subsequent increase in infections and voluntary social-

distancing behavior. Using unique monthly panel survey data, we find that the increase

in risk is associated with the likelihood of social-distancing behavior. However, those

with lower educational attainment are less responsive, implying their higher exposure to

infections. We provide evidence that this can be attributed to their underestimation of

infection risk. These results suggest the utility of interventions incorporating nudges to

raise risk perception.

Keywords: COVID-19; pandemic; social distancing; risk perception; nudge

JEL Codes: I12; I14; I18;

                                             1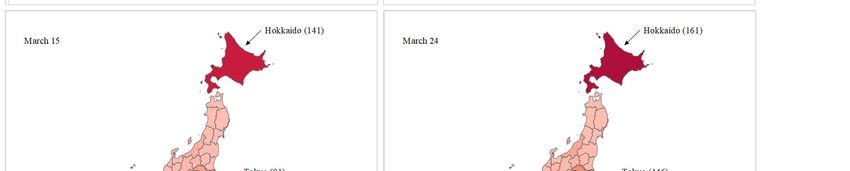
1. Introduction

The COVID-19 pandemic has caused immense human losses worldwide. To mitigate the

infection spread, it is essential for individuals to maintain appropriate social or physical

distance from one another (Fenichel, 2013; Fenichel et al., 2011; Ipsen, 1959).1 However,

it can be difficult to achieve sufficient levels of distancing through voluntary individual

compliance alone, because of attendant economic costs and uncertainties about

transmission risk. 2 Therefore, many governments have sought to enforce social

distancing through various interventions, such as closing public transportation and

workplaces, making viral or antibody tests available to anybody, and providing financial

support (Hale et al. 2020). However, an obvious concern regarding aggressive regulations

is their economic consequences (Acemoglu et al., 2020; Inoue and Todo, 2020; Lin and

Meissner, 2020). In the United States, the unemployment rate jumped from 4.4% in

March 2020 to 14.7% in April. Therefore, some countries have begun to lift social

distancing requirements to restart economic activities, generating a new argument about

whether governments can cope with the next wave of infections without relying on costly

regulations. However, to the best of our knowledge, the extent to which individuals

maintain social distance in the absence of aggressive regulation remains largely

unexplored.

         This study bridges this knowledge gap by examining the case of Japan during

1
  Social distancing or physical distancing is defined as the practice of keeping physical
space between oneself and other people outside of the home. This includes staying at
least six feet from other people, not gathering in groups, staying out of crowded places,
and avoiding mass gatherings (Center for Disease Control and Prevention, 2020).
2
  Decision-making under uncertainty is subject to various cognitive biases (Kahneman
and Tversky 1972). In particular, the normalcy bias causes people to underestimate the
probability and severity of transmission risk.
                                             2
the initial phase of the COVID-19 infection spread, prior to the announcement of a state
of emergency on April 7th, 2020. The Japanese government was less interventionist than
other countries, in that it did not restrict residents’ activities or provide financial support.
Reverse-transcription polymerase chain reaction (RT-PCR) tests were not made widely
available. Rather, the government simply requested that citizens maintain social distance
and stay home voluntarily. Exploiting these features, this study analyzes the extent to
which social-distancing behavior—such as face-to-face conversation, use of public
transportation, and dining outside—changed with the increase in infection risk between
January and March 2020. This study also uncovers obstacles to social-distancing behavior,
such as income opportunity costs, poor access to information, and the underestimation of
transmission risks. Disentangling these obstacles allows us to discuss the interactive roles
between individuals’ responses and public policies. For example, if people do not modify
their behavior due to the underestimation of infection risks, then interventions that elevate
risk perceptions should mitigate the spread of COVID-19 effectively, without the need
for more drastic restrictions on activities.
Using original survey data, we regress changes in social-distancing behavior on
the monthly average of confirmed cases per day in each prefecture, the main unit of
subnational government in Japan. We discuss potential threats to identification carefully,
particularly reverse causality and sample selection. Considering the absence of a natural
experimental condition, it is difficult to fully rule out these possibilities. However, we
provide evidence that these biases are unlikely to be severe, and if anything should work
against our central hypotheses.
We find that the increase in the number of confirmed cases significantly
encourages respondents to take social-distancing behavior. However, the effect is smaller
3among the less educated, implying that exposure to infections may not be equal across
individuals. We also provide suggestive evidence that the heterogeneous impact is mainly
attributable to differences in the perception of infection risk. These results suggest the
importance of interventions that incorporate nudges to heighten perceptions of risk.
This study is most closely related to Barrios and Hochberg (2020), who examine
the impact of obtaining information about infection spread on perceptions of risk and
social-distancing behavior in the U.S. A key distinction between this study and theirs is
that their work analyzes social distancing after the government started to restrict residents’
activities in the U.S., while we study Japan before the government intervened. The
findings of this study are also in line with those of Muto et al. (2020) and Machida et al.
(2020) that examine social distancing in Japan, Kushner Gadarian et al. (2020) in the U.S.,
and Barari et al. (2020) in Italy. In particular, Muto et al. (2020) also find less behavioral
change among those with lower socio-economic status, although they do not test the
potential reasons for the heterogeneity.
This study is also related to the literature of health inequality. Existing studies
demonstrate the association between socio-economic status and health status (Balia and
Jones, 2008; Cutler et al., 2008; Doorslaer et al., 2004; Kawachi et al., 2010; Williams et
al., 1997; Winkleby et al., 1992). Researchers consider this relationship to be mediated
by differences in health behavior, access to health care, exposure to health risk, and stress
(Adler and Newman, 2002; Kristenson et al., 2004; Maurer, 2009). Others argue that
knowledge and perception of health risk play pivotal roles in predicting health behavior,
such as smoking, substance abuse, purchase of health insurance, immunization, and
disaster evacuation (Apostolidis et al., 2006; Lin and Sloan, 2015; Lundborg and
Andersson, 2008; Riad et al., 2006; Schaller et al., 2019; Zhou-Richter et al., 2010). In
4line with these works, our data support the hypothesis that differences in the perception
and knowledge of health risks across education levels cause the heterogeneity in health
behavior.
The rest of this study is organized as follows: Section 2 summarizes the infection
spread and government responses in Japan. Sections 3 and 4 describe the dataset and
identification strategy, respectively. Section 5 presents the results. Section 6 disentangles
the obstacles to social-distancing behavior, and finally Section 7 concludes.
2. Background
2.1. Infection Spread of COVID-19 in Japan (January to March 24th, 2020)
On December 31st in 2019, the WHO China Country Office was informed of cases of
pneumonia of unknown causes in Wuhan City, China. Due to its geographical proximity
to China and frequent bilateral travel for tourism and business, Japan was one of the
earliest countries to confirm COVID-19 cases outside of China, following Thailand
(WHO, 2020). According to the Ministry of Health, Labour, and Welfare (MHLW), the
first case in Japan was confirmed on January 15th, 2020 in Kanagawa, a region in the
suburb of Tokyo, and 15 more cases were reported by the end of January (Figure 1).3
Most of these cases (13 out of 16) were attributed to visitors and returnees from China.
The first report of human-to-human transmission, however, appeared in January 28th in
Nara, a tourist site in western Japan.
[Figure 1]
In February, the virus gradually and silently spread in several rural prefectures
3
Information on the number of confirmed cases is available from the MHLW website
(https://www.mhlw.go.jp/stf/houdou/index.html, accessed on May 6th, 2020).
5in addition to large cities. By February 10th, 28 cases had been confirmed, of which 15
were Japanese residents.4 Infection of medical workers began to appear in the second
half of the month. Serious cluster cases were also found in late February, including the
participants of a snow festival in Hokkaido, the northern-most prefecture of Japan. By the
end of February, a total of 239 cases were reported, of which 69 were in Hokkaido.
However, more than half of the 47 prefectures had not yet confirmed any cases, and even
populated prefectures, such as Miyagi and Osaka, had found only a few cases (Figure 2).
[Figure 2]
Infection spread accelerated in March. More populated prefectures started to find
new cases regularly, and over 10 prefectures announced their first cases in the first week
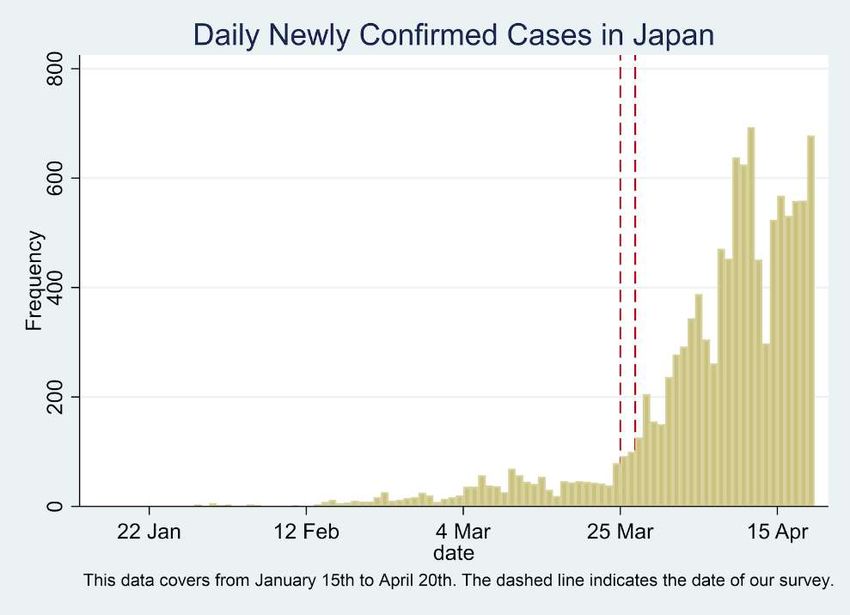
of March. While about 30 cases were found nationwide each day until the 9th, a big jump
occurred on the 10th, when 70 cases were reported. Around the same time, fatalities from
COVID-19 started being reported regularly.
2.2. Government Response and Economic Consequences
Despite the confirmation of infected citizens earlier than most countries, the national
government’s response was comparatively passive. It gradually tightened immigration
controls for visitors from Hubei Province, China, and also asked Japanese residents in
Wuhan to return to Japan in the beginning of February. However, in stark contrast to other
countries that closed public transportation and workplaces, there was no legal regulation
of residents’ activities in Japan. In fact, as late as early April, the prime minister
emphasized that there was no need to declare a state of emergency and only requested
4
Around the same time, passengers of the Diamond Princess, a cruise ship, tested
positive, and the ship began to be quarantined from February 4th. Passengers and crew
stayed on the ship for two weeks.
6self-restraint (Jishuku Yosei) in hosting or attending large-scale public events.5
The one exception was on February 27th, when the national government
requested the closures of all elementary, junior, and senior high schools until the
beginning of the new academic year in April. However, the final decision was left to the
governor of each prefecture, and some prefectures did not close their schools. No
restrictions were placed on economic activities.
While the national government was cautious about declaring a state of
emergency, several local governments took measures of their own. That said, these were
also limited in the scope and time frame of regulated activities and, more importantly,
lacked legal enforcement. On February 28th, the Governor of Hokkaido announced a state
of emergency, although it lacked legal basis, and requested that residents avoid leaving
their homes for three weeks.6 The Governor of Osaka also asked for the refrainment of
movement to and from Hyogo, the neighboring prefecture, between March 20th and 22nd.
The low number of RT-PCR tests in Japan is also striking when compared to
South Korea, which made drive-thru tests available to anyone, including asymptomatic
people.7 There were two paths for Japanese residents to be tested as of March 2020. First,
5
The Constitution of Japan does not provide for a national state of emergency. As such,
neither the national nor local governments have the formal authority to require business
closures, shelter-in-place orders, or citywide lockdowns. However, amendments to the
Infectious Diseases Control Law on March 13, 2020, newly allowed the Cabinet to
declare a “soft” state of emergency, which delegates mores authority to prefectural
governors to contain COVID-19. Even then, governors are restricted to urging (and if
necessary shaming) businesses and citizens to follow its directives. The “state of
emergency” referred to in this paper refers to this latter, softer variety.
6
After this announcement, on March 13th, the National Diet (parliament) amended the
law so that a state of emergency declaration could be issued.
7
According to an MHLW report on May 4, 2020, the low number of tests was due to
the limited capacities of call centers, testing facilities, and medical facilities
(https://www.mhlw.go.jp/content/10900000/000627553.pdf, accessed on May 10,
2020).
7those who had “close contact” with an infected person were requested to visit a designated
medical facility.8 Second, those who did not have close contact but suffered from severe
symptoms could consult with their family doctor or local public health call center, who
would then refer the patient to a designated facility, if considered necessary. Only those
persons whom the facility suspected were infected could take a RT-PCR test, which was
administered at public health centers or local public health institutions. Therefore, there
was no way to detect asymptomatic infection except for those who had “close contact”.
The accuracy of detecting infected people also depended on the screening ability of home
doctors, call centers, and designated medical facilities.
Because of these passive policy interventions, economic conditions in Japan did
not decline as much as in other countries during the first quarter of 2020. Although the
number of bankruptcies increased from 651 cases in February to 740 in March, as shown
in Figure A1, only 12 cases were related to COVID-19 (Tokyo Shoko Research, 2020).
The unemployment rate was also stable between January and March, in contrast to other
countries experiencing a rapid increase in infections, such as the U.S. and Ireland (Figure
A2).
3. Data
This study employs two datasets. First, to approximate the risk of COVID-19 infection,
we construct prefecture-level monthly panel data on the average number of newly
confirmed cases per day. We use this information as the main independent variable.
Because the number of newly confirmed cases is reported daily by the government and
8
A person is categorized to be in close contact with infected persons if he/she (i)
touches an infected person directly without anti-infective measures, or (ii) meets an
infected person at a distance of around 2 meters (6 feet) or less.
8mass media, it is the most easily accessible information for people regarding the infection
spread. While the ratio of positive-to-negative RT-PCR tests is one alternative measure of
infection risk, we do not use it for this analysis, because that information was not widely
disseminated at that time and thus was unlikely to affect behavioral patterns. We similarly
do not use the number of COVID-19-related deaths, because only a few prefectures
reported the death toll at that time.
Second, this study uses data from an original, nationwide online survey.9 The
first round of the survey was conducted between March 25th and 27th, 2020, with a
sample size of 2,798 respondents. Our survey targeted those in their 30s and 40s, for two
reasons. First, working-age individuals account for a high proportion of confirmed cases.
Second, while the behavior of the elderly, who are most susceptible to COVID-19, is
undeniably important, it is difficult to collect a representative sample of older generations
due to disparities in internet access (Ministry of Internal Affair and Communication, 2018
p156). Our questionnaire was designed to elicit information about both behavior and
preferences, including the use of social media, political sentiment, health status, actions
taken to protect oneself and others from COVID-19, perceptions about the severity of
infection risk, and the assessment of the government’s early responses to COVID-19. On
April 27th to May 7th, we re-surveyed the same respondents to collect further information
on their social and psychological traits, such as civic attitudes and social capital, although
we use these only in Section 6. A total of 2,462 individuals participated in both surveys.
9
A potential drawback to the use of online survey data is sample selection. However,
we chose this approach because it was difficult to conduct a paper-and-pencil survey in
a timely manner, due to the spread of COVID-19. An alternative approach is to use
publicly available data, such as the Google Trends interface and geolocation data from
mobile phones (Barrios and Hochberg 2020; Gupta et al. 2000). Although these may
better capture behavioral changes, it is difficult to analyze the reasons for heterogeneity
in behavior.
9Table A1 presents the summary statistics of prefecture and respondent characteristics.
Online Appendix A1 discusses more details about the survey design, such as sampling
stratification and research ethics.
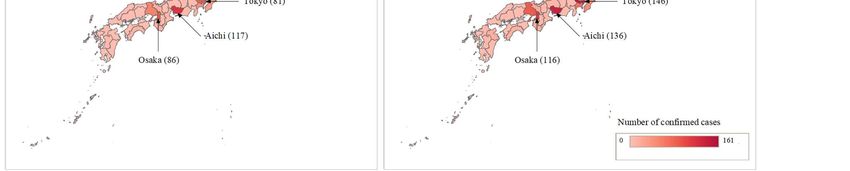
The first-round survey data contain three behavioral variables related to social
distancing, our outcome of interest. The first is frequency of face-to-face conversations
per day. The second is the number of days per week that respondents used public
transportation for more than one hour, capturing the frequency of commuting. Third, we
use the frequency of dining outside per week.10 In this survey, retrospective information
was collected, based on recall; the dataset contains the information on these variables
from January to March 2020. From this retrospective information, a monthly pseudo-
panel dataset was compiled. Figure 3 depicts the trend of these variables.
Our dependent variable is the composite index of these variables constructed by
a polychoric principal component analysis; the use of polychoric correlations is
considered best suited for ordinal variables. The summary statistics of the composite
index is presented in Table A1.
[Figure 3]
4. Identification Strategy
4.1. Estimation Model
This study estimates the following OLS model:
Ript = α0 + α1 Infpt + α2 Adj_Infpt+ α3 Damagept + δip + Tt + εipt, (1)
where, Ript denotes the composite index of social-distancing behavior of individual i in
10
The transmission risk from these activities depends on various factors, such as the
use of masks and physical distance from others, but we did not ask such detailed
questions to mitigate the respondents’ burdens and ensure a higher response rate.
10prefecture p in month t. Infpt denotes the monthly average of newly confirmed cases per
day in the prefecture in which the respondent resides. Adj_Infpt denotes the summation of
Inf over the adjacent prefectures, to account for high levels of cross-prefectural movement
in urban areas in particular. Damagept denotes proxies for the economic damages from
the infection spread, such as the number of bankruptcies and the active job-openings-to-
applicants ratio. Finally, δip and Tt denote respondent and monthly fixed effects,
respectively. The respondent fixed effects control for those characteristics invariant
between January and March 2020, including socio-economic conditions at the prefecture
and individual levels. Monthly fixed effects capture the impact of country-level shocks,
such as news about the infection spread in other countries and restrictions on overseas
travel.
4.2. Underlying Assumptions
4.2.1. No Reverse Causality
Our identification strategy relies on four assumptions. The first assumption is the absence
of reverse causality. The residents’ (lack of) social-distancing behavior may affect the
level of confirmed cases in the prefecture. However, this should cause an upward bias
between risky behavior and COVID-19 infection counts. Hence, as long as we find a
negative association between risky behavior and confirmed cases, it should not affect the
interpretation of results.
Furthermore, the Japanese government has identified that at least 70% of newly
confirmed cases between March 1st and 24th were transmitted by those who were
previously confirmed.11 Therefore, the increase in the confirmed cases in this period was
11
The Japanese government identifies the channel of transmission based on interviews
11mainly determined by the behavioral patterns of previously confirmed people (only
0.0002% of national population).12 The social-distancing behavior of most respondents
should have played a limited role in the increases in confirmed cases.
4.2.2. Parallel Trend Assumption
The second is the parallel trend assumption, which may be subject to the following two
issues. First, the number of confirmed cases may grow faster in urban prefectures, which
have greater testing capacity and population density, and these characteristics may be
correlated with changes in social-distancing behavior. However, in the time period under
observation, we expect less social distancing in urban areas, causing an upward bias (less
social distancing where there are more infections) that runs counter to our hypothesis
(more social distancing where there are more infection). The frequencies of conversing
with colleagues, commuting, and dining out are expected to increase in March,
particularly in large cities, because March is the final month of the fiscal year and work
hours generally increase. The Statistics Bureau of Japan (2020) finds that in 2018 and
2019, the revenues of restaurant business increased in March.
Furthermore, as mentioned in Section 4.2.1, the infection spread in March was
mainly attributed to the unwitting behavior of infected persons before their diagnosis was
confirmed, such as the frequency of going to bars before becoming symptomatic.
Therefore, the socio-economic environment of the prefecture should have played a
limited role in the increase in confirmed cases in March, if at all.
with confirmed patients. The data on confirmed cases by transmission channels are
available from https://datastudio.google.com/reporting/c4e0fe88-f72e-464e-a3b8-
5e4e591c238d/page/ultJB?s=oA3tV-uQzaE (accessed on May 8, 2020).
12
As of the end of February 2020, only 206 cases were confirmed, compared to the
national population of 126 million.
12The second potential violation of the parallel trend assumption is that, if the
timing of infection spread is controllable or predictable, people can prepare for it
beforehand. Therefore, they may alter their behavior even in the pre-spread period.
However, this is also unlikely due to difficulties in predicting the timing that infections
of this novel coronavirus spread accurately. More importantly, these possibilities also
attenuate the estimated effect of infection risk, i.e. the results would be biased against
finding statistically significant results. Therefore, it should not affect the interpretation of
results qualitatively, as long as we find a significantly negative effect.
To examine the validity of the parallel trend assumption, we conduct a
falsification test by regressing Ript (social distancing behavior) between December and
February on the individual fixed effects, monthly fixed effects, and interaction terms
between monthly fixed effects and the number of confirmed cases in March. Table A2
shows that the coefficients of interaction terms are statistically jointly insignificant and
small in magnitude for all the columns.
One may also be concerned about the ceiling effect. If the level of Ript after
controlling for the individual fixed effects is already low (i.e. more social distancing) in
prefectures that subsequently had few confirmed cases in the next month, then Ript may
be less likely to decrease even further than in prefectures with more cases, regardless of
the severity of infection spread. We test this possibility by regressing the level of Ript in
January and February on the number of confirmed cases in the next month, individual
fixed effects, and monthly fixed effects. A positive coefficient of confirmed cases suggests
the possibility of ceiling effect, but the estimated coefficient is -0.003 (p-value=0.341),
ruling out this issue.
134.2.3. Limited Impact of Economic Damage and Government Intervention
The third underlying assumption for this model is that the increase in the number of
confirmed cases affects individual behavior only through the increase in infection risk,
but not through associated economic damages or government interventions. This
assumption is likely to hold: as mentioned in Section 2, economic indicators, such as the
unemployment rate and number of bankruptcies, were still stable during the survey period.
Furthermore, using the prefecture-level monthly panel data, we find that the number of
confirmed cases is not associated with bankruptcy cases or the active job-openings-to-
applicants ratio (Table A3). Finally, our econometric specification controls for these
economic conditions.
Regarding government interventions, after the prime minister recommended that
local governors close schools in March, respondents with a schooling-age child may have
had to stay home to take care of their children. To rule out this impact, we re-estimate the
model after excluding respondents with a schooling-age child. In addition, we also drop
the sample from Hokkaido prefecture, which unilaterally closed schools and encouraged
residents to shelter in place, in order to eliminate the effects of imposing a state of
emergency.13
4.2.4. Limited Spillover Effect
The fourth potential threat to our identification strategy is the spillover effect from other
prefectures. A spike in COVID-19 cases in one prefecture may elevate perceived risks
among residents of neighboring prefectures, motivating them to maintain social distance.
13
We do not exclude the sample of Osaka because the request to refrain from cross-
prefecture movement was only in place for three days.
14This is particularly plausible for those who commute to adjacent prefectures for work. To
address this potential issue, we control for the number of confirmed cases in the adjacent
prefectures, Adj_Infpt, in the model.
5. Results
5.1. Benchmark Results
Table 1 presents the OLS results of Equation (1). It shows that the increase in confirmed
cases per prefecture is significantly associated with social-distancing behavior. The
results are robust to the additional control for economic conditions (Column (2)),
confirmed cases in adjacent prefectures (Columns (3)), and the exclusion of respondents
with a schooling-age child (Columns (4)). The most preferable specification (Column (4))
demonstrates the largest effect size. Hence, changes in economic conditions or
government interventions cannot explain the significantly negative coefficients of
confirmed cases. Column (4) shows that a one standard deviation increase in COVID-19
cases (S.D.=1.91 as of March) is associated with an increase in the degree of social
distancing by 0.05 standard deviation (S.D.=0.79).
With regard to other coefficients, the increase in confirmed cases in adjacent
prefectures also has an effect on social distancing. However, the effect size is one third of
confirmed cases in one’s own prefecture, and the coefficient becomes insignificant after
excluding respondents with a schooling-age child. The coefficients of the job-opening-
to-applicants ratio are negative. Although this is purely speculative, this result may be
because a higher ratio enables individuals to select a job with better working conditions.
We conduct the following robustness checks. First, people may react to the
accumulated number of confirmed cases over multiple months, rather than the number of
15newly confirmed cases in the most recent month. Hence, as an alternative measure of
infection risk, we re-estimate the model using the accumulated number of confirmed cases
(Table A4). Second, behavioral patterns may differ between employed and unemployed
persons, because of differences in the need to use public transportation and have face-to-
face conversations. They may also differ in terms of budget constraints on dining outside.
To control for these heterogeneities, we re-estimate our models after excluding
respondents who do not work (Table A5). Third, in Table A6, we use the three ordinal
social-distancing variables in Figure 3 as the dependent variable and re-estimate the
models using OLS and interval regression models. The results are robust to all of these
alternative specifications.
[Table 1]
5.2. Heterogeneous Effect
Does the impact of infection risk vary across individuals? In Table 2, we address this
question by adding interaction terms between confirmed cases and respondent
characteristics. This model demonstrates significant differences by education level.
Columns (1) and (2) suggest that the impact of a one standard deviation increase in
confirmed cases for university and vocational school graduates are larger by 0.07 and
0.06 standard deviations, respectively, than for high school graduates. The results are
robust to controls for month-prefecture fixed effects (Columns (3) and (4)) and the
exclusion of demographic characteristics (Columns (5) and (6)). Therefore, our result is
unlikely to be driven by unobserved heterogeneity at the individual and prefectural levels.
Regarding other characteristics, first, we find that women with a schooling-age
child are more sensitive to the increase in infection risk. Second, the coefficient of
16interaction with respondents’ age is statistically insignificant and small in magnitude,
presumably because our sample consists only of those in their 30s and 40s.
[Table 2]
6. Suggestive Evidence on the Mechanisms of Heterogeneous Impact
Why are less educated people less sensitive to the risks of COVID-19 infection? We test
eight potential mechanisms. First, they may engage in a job that is not suitable for
teleworking, such as in retail or the restaurant business. Second, their economic status
may be lower, and so they may suffer from credit constraints that make the disutility from
the income loss caused by staying home larger than for the wealthy. The third potential
mechanism is that they may not watch television news or read newspapers, and therefore
have poorer knowledge of COVID-19. Fourth, even if they have knowledge, they may
still underestimate the infection risk. Because the actual number of infected individuals
is unobservable, people infer the infection risk from the information available, but news
related to COVID-19 frequently includes professional, foreign language terms (e.g. RT-
PCR tests). Fifth, they may be less risk averse. Sixth, they may possess less social capital
than university graduates, and so may care less about their reputation or disapproval from
neighbors. Seventh, they may take alternative actions to protect themselves, such as
wearing masks and washing hands with disinfectants. Finally, they may recognize that
the number of confirmed cases underestimates the actual infection risk, and therefore,
they may be more sensitive to other types of information, such as the ratio of positive RT-
PCR tests. Among these, the first to fourth channels suggest that the less educated do not
maintain social distance due to some constraints, whereas the fifth and sixth mechanisms
imply that they do not keep social distance by intention. These six mechanisms suggest
17that the less educated are exposed to higher infection risks, and thus could be unwitting
but significant vectors of COVID-19.
To test the relevance of the first channel—the unsuitability of certain jobs for
teleworking—we construct an industry-level proxy using the survey results of Okubo and
NIRA (2020). Based on an online survey in Japan, this study shows the proportion of
respondents working at home by industry as of March 2020. We combine these
proportions and our respondents’ occupation to approximate the suitability of their jobs
for teleworking.14 We then regress this proxy on respondent characteristics to examine
whether less educated respondents actually engage in jobs unsuitable for telework.
Column (1) of Table 3, however, shows that the coefficient for university graduate is
negative, counter to the hypothesis.15
Second, to examine the channel through income opportunity costs, we conduct
a polychoric principal component analysis to construct a composite index of economic
status from two variables: annual income, and a binary indicator that takes unity for self-
employment, executive, or regular employment.16 We examine the correlation between
this index and education level in Column (2) of Table 3. It confirms that the economic
status of university graduates is significantly higher than that for high school graduates,
in line with our hypothesis.
To test the third channel through information access, we construct a composite
index from three variables: the frequencies of reading paper newspapers, reading
14
The summary statistics of variables used for this section are presented in Table A1.
15
Okubo and NIRA (2020) also report the proportion of teleworking at the pre-spread
period (January 2020). Changing the time period for telework suitability does not affect
our results.
16
We use the polychoric principal component analysis to construct composite indices
throughout this section.
18newspaper websites, and watching television news. Then, we estimate the association
between this index and education level in Column (3). The results are consistent with the
hypothesis: educated respondents follow the mass media more frequently.
The fourth channel is underestimation of infection risk. We construct a composite
index of risk perception using the following two questions: how many infected people
that respondents think there actually are in Japan; the extent to which COVID-19 will
cause serious problems for themselves. The regression result in Column (4) shows that
educated people are more likely to take the infection risk more seriously, supporting our
hypothesis.
Fifth, given the difficulty in conducting an economic experiment to elicit the risk
preference of respondents in our online survey, we test this channel through two proxy
variables. First, we asked the following question: which of the following two sayings
characterizes you better, “nothing ventured, nothing gained” or “a wise man never courts
danger”? The answer options are in Likert-scale. Second, we also asked the following
question: at which precipitation probability do you bring an umbrella when going out? A
lower score to these answers indicates greater risk aversion. These questions are
frequently used in the literature (Ikeda et al. 2016 p142; Iida 2016) and draws from earlier
work in the United States. In Column (5), we estimate the relationship between the
composite index of these variables and respondent characteristics, showing that education
level is uncorrelated with risk preference.
Sixth, the second wave of our survey asks about respondents’ social capital
through six questions on general trust, pure altruism, and social norms. More detail about
each question is reported in Table A1. We use these answers to construct a composite
index. Column (6) demonstrates that social capital is lower for less educated respondents,
19supporting the hypothesis.
Seventh, although our survey does not include items on the use of facemasks or
disinfectant soap, it does ask respondents whether they wished to buy them more than
usual. We regress the composite index of these variables in Column (7). The result shows
that highly educated individuals are more likely to answer affirmatively, counter to the
hypothesis.
The eighth hypothesis pertains to respondents having less confidence in the
confirmed number of infection cases as a proxy for infection risk. This hypothesis
assumes that those with lower education have more knowledge about COVID-19 than
educated respondents. This assumption, however, contradicts our findings that less
educated respondents spend less time collecting information on COVID-19 (Table 3,
Column (3)).
These results so far show that respondents’ education levels are associated with
economic status, information access, risk perception, and social capital. The observed
patterns are robust to the full sample estimation (Table A7). These characteristics could
be potential drivers of the heterogeneous effect of COVID-19 cases. To further test
whether they are also associated with their social-distancing behavior, we additionally
control for the interaction terms between these seven indices and the number of confirmed
cases, based on the specifications in Table 2.
Table 4 presents the estimation results. It also reports False Discovery Rate q-
values (Anderson 2008) to adjust the p-values of the 14 coefficients that test for different
mechanisms. We find robust evidence that in prefectures with more confirmed cases,
those with high risk perception are more likely to maintain social distance. We also find
significant coefficients for suitability for teleworking, economic status, information
20access, and risk preference, but they are not robust to changes in sampling (Column (2))
or multiple hypothesis testing (q-values). Overall, the results from Tables 3 and 4 support
the hypothesis that differences in risk perception are the most likely driver of
heterogeneity across education levels.
[Table 3]
[Table 4]
7. Conclusion
Do people keep social distance to mitigate the infection risk of COVID-19, even in the
absence of aggressive government intervention? Using unique survey data collected in
Japan, we find that an increase in the number of confirmed cases is negatively associated
with the frequency of face-to-face conversation, public transportation use, and dining out.
However, less educated people do not respond as much as those with higher education.
We provide suggestive evidence that this heterogeneity is driven primarily by the former’s
underestimation of infection risk.
The following policy implications can be derived. Some countries have lifted
aggressive regulations before eliminating new COVID-19 infections in order to restart
economic activities, but concerns remain about how governments will cope with the next
wave of infections (Acemoglu et al., 2020; Inoue and Todo, 2020; Lin and Meissner,
2020). Our findings suggest that when the government prioritizes economic activities,
socio-economically vulnerable individuals are exposed to particularly higher risk, and
they could also become the primary vectors of the virus. This is consistent with the
argument of Ahmed et al. (2020). It is, therefore, incumbent upon the government to
implement a targeted intervention for this subpopulation promptly.
21One approach is for governments to provide information on the risks of infection
transmission in an easily accessible and understandable manner. Another promising
approach is interventions that incorporate nudges to elevate risk perceptions. Van Bavel
et al. (2020) argue in favor of nudges in eradicating COVID-19. Whether these policies
are complements or substitutes in encouraging social-distancing behavior depend on how
risk perception and health knowledge are formed. Further studies are required to design
the optimal combination of these policies.
References
Acemoglu, D., Chernozhukov, V., Werning, I., & Whinston, M. D., (2020). A Multi-Risk
SIR Model with Optimally Targeted Lockdown, (No. w27102). National Bureau of
Economic Research.
Adler, N. E., & Newman, K. (2002). Socioeconomic disparities in health: pathways and
policies. Health Affairs, 21(2), 60-76.
Ahmed, F., Ahmed, N. E., Pissarides, C., & Stiglitz, J. (2020). Why inequality could
spread COVID-19. The Lancet Public Health.
Apostolidis, T., Fieulaine, N., Simonin, L., & Rolland, G. (2006). Cannabis use, time
perspective and risk perception: Evidence of a moderating effect. Psychology and
Health, 21(5), 571-592.
Balia, S., & Jones, A. M. (2008). Mortality, lifestyle and socio-economic status. Journal
of Health Economics, 27(1), 1-26.
Barari, S., Caria, S., Davola, A., Falco, P., Fetzer, T., Fiorin, S., ... & Kraft-Todd, G. (2020).
Evaluating COVID-19 Public Health Messaging in Italy: Self-Reported Compliance
and Growing Mental Health Concerns. medRxiv.
Barrios, J. M., & Hochberg, Y. (2020). Risk perception through the lens of politics in the
time of the COVID-19 pandemic (No. w27008). National Bureau of Economic
Research.
Center for Disease Control and Prevention. (2020). Social Distancing,
https://www.cdc.gov/coronavirus/2019-ncov/prevent-getting-sick/social-
distancing.html (accessed on May 22, 2020).
Cutler, D. M., Lleras-Muney, A., & Vogl, T. (2008). Socioeconomic status and health:
22dimensions and mechanisms (No. w14333). National Bureau of Economic Research.
Doorslaer, E. V., Koolman, X., & Jones, A. M. (2004). Explaining income‐related
inequalities in doctor utilisation in Europe. Health Economics, 13(7), 629-647.
Fenichel, E. P. (2013). Economic considerations for social distancing and behavioral
based policies during an epidemic. Journal of Health Economics, 32(2), 440-451.
Fenichel, E. P., Castillo-Chavez, C., Ceddia, M. G., Chowell, G., Parra, P. A. G., Hickling,
G. J., ... & Springborn, M. (2011). Adaptive human behavior in epidemiological
models. Proceedings of the National Academy of Sciences, 108(15), 6306-6311.
Glaeser, Edward L., David I. Laibson, José A. Scheinkman and Christine L. Soutter. 2000.
Measuring Trust, Quarterly Journal of Economics, 115, 811-846.
Gupta, S., Nguyen, T. D., Rojas, F. L., Raman, S., Lee, B., Bento, A., ... & Wing, C. (2020).
Tracking public and private response to the covid-19 epidemic: Evidence from state
and local government actions (No. w27027). National Bureau of Economic Research.
Hale, T., Petherick, A., Phillips, T., & Webster, S. (2020). Variation in government
responses to COVID-19. Blavatnik School of Government Working Paper, 31.
Iida, T. (2016). Yūkensha no Risuku Taido to Tōhyōkōdō. Bokutakusha.
Ikeda, S., Kato, H. K., Ohtake, F., & Tsutsui, Y. (Eds.). (2016). Behavioral Economics of
Preferences, Choices, and Happiness. Springer.
Inoue, H. and Todo, Y., 2020. The propagation of the economic impact through supply
chains: The case of a mega-city lockdown against the spread of COVID-19.
Available at SSRN 3564898.
Ipsen, J. (1959). Social distance in epidemiology: age of susceptible siblings as the
determining factor in household infectivity of measles. Human Biology, 31(2), 162-
179.
Kahneman, D., & Tversky, A. (1972). Subjective probability: A judgment of
representativeness. Cognitive Psychology, 3(3), 430–454.
Kawachi, I., Adler, N. E., & Dow, W. H. (2010). Money, schooling, and health:
Mechanisms and causal evidence. Annals of the New York Academy of Sciences.
Kristenson, M., Eriksen, H. R., Sluiter, J. K., Starke, D., & Ursin, H. (2004).
Psychobiological mechanisms of socioeconomic differences in health. Social
Science & Medicine, 58(8), 1511-1522.
Kushner Gadarian, Shana and Goodman, Sara Wallace and Pepinsky, Thomas B.,
Partisanship, Health Behavior, and Policy Attitudes in the Early Stages of the
COVID-19 Pandemic (March 27, 2020). Available at SSRN:
https://ssrn.com/abstract=3562796
Lin, W., & Sloan, F. (2015). Risk perceptions and smoking decisions of adult Chinese
23men. Journal of Health Economics, 39, 60-73.
Lin, Z & Meissner, C. M. (2020) Health vs. Wealth? Public Health Policies and the
Economy During Covid-19, (No. w27099). National Bureau of Economic Research.
Lundborg, P., & Andersson, H. (2008). Gender, risk perceptions, and smoking behavior.
Journal of Health Economics, 27(5), 1299-1311.
Machida, M., Nakamura, I., Saito, R., Nakaya, T., Hanibuchi, T., Takamiya, T., Odagiri,
Y., Fukushima, N., Kikuchi, H., Kojima, T. and Watanabe, H., (2020). Adoption of
personal protective measures by ordinary citizens during the COVID-19 outbreak in
Japan. International Journal of Infectious Diseases.
Maurer, J. (2009). Who has a clue to preventing the flu? Unravelling supply and demand
effects on the take-up of influenza vaccinations. Journal of Health Economics, 28(3),
704-717.
Ministry of Internal Affair and Communication, (2018) “The White Paper on Information
and Communications in Japan,” Ministry of Internal Affair and Communication.
Muto, K., Yamamoto, I., Nagasu, M., Tanaka, M., & Wada, K. (2020). Japanese citizens'
behavioral changes and preparedness against COVID-19: How effective is Japan's
approach of self-restraint?. medRxiv.
Okubo, T., & NIRA (2020). Shingata Corona Virus no Kansen Kakudai ga Telework wo
Katsuyoshita Hatarakikata, Seikatsu, Ishiki nado ni Oyobosu Eikyo ni Kansuru
Chosa Kekka ni kansuru Houkokusho, https://www.nira.or.jp/pdf/NIRA20200430-
telemigration1.pdf (accessed on May 14, 2020).
Riad, J. K., Norris, F. H., & Ruback, R. B. (2006). Predicting evacuation in two major
disasters: risk perception, social influence, and access to Resources. Journal of
Applied Social Psychology 29(5), 918-934.
Schaller, J., Schulkind, L., & Shapiro, T. (2019). Disease outbreaks, healthcare utilization,
and on-time immunization in the first year of life. Journal of Health Economics, 67,
102212.
The Statistics Bureau of Japan. (2020). Service Sangyo Doko Chosa.
http://www.stat.go.jp/data/mssi/kekka/pdf/m2002.pdf (accessed on May 14, 2020).
Tokyo Shoko Research, (2020). Getsuji Zenkoku Kigyo Tosan Jokyo. https://www.tsr-
net.co.jp/news/status/monthly/202003.html (accessed on May 9, 2020).
Van Bavel, J. J., Baicker, K., Boggio, P. S., Capraro, V., Cichocka, A., Cikara, M., ... &
Drury, J. (2020). Using social and behavioural science to support COVID-19
pandemic response. Nature Human Behaviour, 1-12.
WHO (2020). “Novel Coronavirus (2019-nCoV) Situation Report 1,”
https://www.who.int/emergencies/diseases/novel-coronavirus-2019/situation-
24reports (Accessed on April 25th, 2020).
Williams, D. R., Yu, Y., Jackson, J. S., & Anderson, N. B. (1997). Racial differences in
physical and mental health: Socio-economic status, stress and discrimination.
Journal of Health Psychology, 2(3), 335-351.
Winkleby, M. A., Jatulis, D. E., Frank, E., & Fortmann, S. P. (1992). Socioeconomic status
and health: how education, income, and occupation contribute to risk factors for
cardiovascular disease. American Journal of Public Health, 82(6), 816-820.
Zhou‐Richter, T., Browne, M. J., & Gründl, H. (2010). Don't they care? or, are they just
unaware? risk perception and the demand for long‐term care insurance. Journal of
Risk and Insurance, 77(4), 715-747.
25Note: The passengers and crew of the Diamond Princess are not included.
Source: MHLW (https://www.mhlw.go.jp/stf/houdou/index.html)
Figure 1: Infection Spread in Japan
26Note: The passengers and crew of the Diamond Princess are not included.
Source: MHLW (https://www.mhlw.go.jp/stf/houdou/index.html)
Figure 2: Cumulative Number of Confirmed Cases
27Face-to-Face Conversation Public Transportation
Jan
Jan
0 20 40 60 80 100
percent 0 20 40 60 80 100
percent
Feb
Feb
0 20 40 60 80 100
percent 0 20 40 60 80 100
percent
Mar
Mar
0 20 40 60 80 100
percent
0 20 40 60 80 100
percent
rare 1-2
3-5 5-10 rare 1-3/week
11+ 4-6/week daily
Dinner Outside
Jan
0 20 40 60 80 100
percent
Feb
0 20 40 60 80 100
percent
Mar
0 20 40 60 80 100
percent
rare 1-3/week
4-6/week daily
Figure 3: Trend of Social-Distancing Behavior
28Table 1: The Impact of Infection Spread on Social-Distancing Behavior
Dependent Variable: Composite Index of Conversation, Public Transportation,
and Dining Out
Sample: All All All No child
(1) (2) (3) (4)
Confirmed cases -0.018*** -0.019*** -0.017*** -0.020***
(0.004) (0.004) (0.004) (0.005)
Confirmed cases -0.006* -0.004
in adjacent prefectures (0.003) (0.004)
Bankruptcy cases 0.623 0.641 0.869
(0.571) (0.570) (0.649)
Job-openings- to-applicants ratio -0.318*** -0.280** -0.328**
(0.120) (0.118) (0.145)
Monthly FE Yes Yes Yes Yes
Individual FE Yes Yes Yes Yes
Observations 7,723 7,723 7,723 5,411
Number of respondents 2,598 2,598 2,598 1,819
The OLS coefficients are reported. Standard errors clustered at the respondent level are
in parentheses. *** pTable 3: The Relationship Between Education and Socio-Economic Indices
(Samples with no schooling-age child)
Suitability Alternative
of job for Economic Information Risk Risk Social protective
teleworking status access perception preference capital measures
(1) (2) (3) (4) (5) (6) (7)
University -0.101*** 0.642*** 0.194*** 0.199*** 0.026 0.500*** 0.170***
(0.024) (0.054) (0.061) (0.058) (0.041) (0.064) (0.048)
Vocational -0.047 0.258*** 0.147*** 0.117* 0.038 0.390*** 0.214***
(0.035) (0.066) (0.053) (0.060) (0.070) (0.081) (0.056)
Age -0.001 -0.005** 0.023*** 0.004 -0.002 -0.001 -0.012***
(0.002) (0.002) (0.004) (0.004) (0.004) (0.006) (0.003)
Female 0.157*** -0.427*** -0.124*** -0.073 -0.213*** 0.262*** 0.387***
(0.021) (0.048) (0.044) (0.047) (0.041) (0.058) (0.046)
Prefecture FE Yes Yes Yes Yes Yes Yes Yes
Observations 1,465 1,586 1,798 1,785 1,790 1,451 1,787
The OLS coefficients are reported. Standard errors clustered at the prefecture level are in
parentheses. The sample sizes of Columns (1) and (6) are smaller than the others, because
the data on respondents’ occupation and social capital were collected in the second-wave
survey. Column (2) also has a small sample size due to missing values in the annual
income data. *** pTable 4: The Relationship Between Socio-Economic Indices and Social-Distancing
Behavior
Sample: All No child
(1) (2)
Confirmed cases -0.029* -0.025
x Suitability of job for teleworking (0.016) [0.163] (0.017) [0.163]
Confirmed cases -0.010** -0.007
x Economic status (0.005) [0.137] (0.005) [0.163]
Confirmed cases -0.006 -0.012**
x Information access (0.005) [0.249] (0.005) [0.137]
Confirmed cases -0.011*** -0.012***
x Risk perception (0.004) [0.022] (0.004) [0.022]
Confirmed cases -0.009* -0.008
x Risk preference (0.005) [0.137] (0.005) [0.163]
Confirmed cases -0.004 -0.001
x Social capital (0.003) [0.163] (0.003) [0.275]
Confirmed cases -0.000 -0.000
x Alternative protective measures (0.005) [0.378] (0.005) [0.378]
Confirmed cases -0.012 -0.017**
x University (0.008) (0.009)
Confirmed cases -0.019* -0.020
x Vocational (0.011) (0.013)
Confirmed cases 0.000 -0.000
x Age (0.001) (0.001)
Confirmed cases -0.020** -0.008
x Female (0.008) (0.009)
Confirmed cases -0.017
x Live with schooling-age child (0.010)
Month-Prefecture Fixed Effect Yes Yes
Individual Fixed Effect Yes Yes
Observations 5,148 3,654
Number of respondents 1,732 1,228
The OLS coefficients are reported. Standard errors clustered at the respondent level are
in parentheses. Anderson’s (2008) q-values that adjust the p-values of 14 coefficients are
in brackets. The sample size is smaller than Table 2, because the data on respondents’
occupation and social capital were collected in the second-wave survey. *** pOnline Appendices
Appendix 1: Further Discussion on the Survey Design
Our survey targeted those in their 30s and 40s. Respondents were recruited by Rakuten
Insight, which has 2.2 million registrants. Among them, we conducted a quota sampling
with regard to gender (two categories), age group (four 5-year categories), and location
of residence (10 categories), so that the distribution of these characteristics was
comparable to that of the Japanese population. In collecting the data, Rakuten Insight
invited approximately 50,000 randomly selected registrants who matched the sampling
criteria. The online survey was open until we obtained the required sample size. Therefore,
it is difficult to compute the response rate. The respondents received some tokens for
shopping at Rakuten.com as financial incentive. After dropping the sample of Hokkaido
prefecture, the sample size is 2,637 for the first round, of which 2,293 participated in both
rounds. We obtained informed consent from the respondents. This survey was approved
by the Research Ethics Committee of the Institute of Social Science in the University of
Tokyo.
Table A1 presents the summary statistics of respondent characteristics. Among
employed workers, temporary employment accounts for 26.6%. According to the Labor
Force Survey, a nationally representative survey conducted by Japanese government, the
corresponding statistic is 28.7%, supporting the representativeness of our survey data.
However, it should be noted that 51.8% of respondents are university graduates, while the
School Basic Survey predicts 35.7% for these birth cohorts. This suggests that our dataset
may oversample those with higher socio-economic status.
32Bankruptcy cases
900 800
Number of Cases
700600
500
January 2019 April 2019 July 2019 October 2019 January 2020
Date
Source: https://www.tsr-net.co.jp/news/status/monthly/index.html
Figure A1: The Trend in Bankruptcy Cases: Jan 2019 – Mar 2020
Unemployment rate
2.7
2.6
2.5
2.4
Percent
2.3 2.2
2.1
2
January 2019 April 2019 July 2019 October 2019 January 2020
Date
Source: https://www.stat.go.jp/data/roudou/sokuhou/tsuki/index.html
Figure A2: The Trend in Unemployment Rate: Jan 2019 – Mar 2020
33Table A1: Prefecture and Respondent Characteristics
Obs. Mean S.D.
Prefecture Characteristics
Confirmed cases in the prefecture (per day)
January 2020 2,637 0.011 0.024
February 2020 2,637 0.306 0.441
March 2020 2,637 1.705 1.905
Bankruptcy cases (thousand cases)
January 2020 2,637 0.039 0.039
February 2020 2,637 0.035 0.041
March 2020 2,637 0.040 0.045
Job-openings- to-applicants ratio
January 2020 2,637 1.532 0.263
February 2020 2,637 1.496 0.269
March 2020 2,637 1.439 0.253
Respondent Characteristics
Age 2,624 40.635 5.747
Female 2,634 0.498
Live with schooling-age child 2,598 0.291
Schooling 2,608
High school or lower 0.223
Vocational/ Jr college 0.259
University or higher 0.518
Social Distancing
Composite index of social distance 7,723 -0.656 0.771
Socio-Economic Characteristics
Suitability of job for teleworking 2,103 0.229 0.325
Occupation 2,616
Executive / Self-employed 0.093
Regular employment 0.539
Temporary employment 0.195
Homemaker 0.115
No job 0.040
Others 0.018
Income 2,283 3.526 1.433
(1) Less than 2 million, (2) 2 - 4 million, (3) 4 - 6 million, (4) 6 - 8 million,
(5) 8 - 10 million, (6) More than 10 million
Read newspaper 2,613 1.866 1.242
(1) Rarely, (2) 1-3/week, (3) 4-6/week, (4) Daily
Read web newspaper 2,616 2.077 1.297
(1) Rarely, (2) 1-3/week, (3) 4-6/week, (4) Daily
Watch TV news 2,629 3.412 1.009
(1) Rarely, (2) 1-3/week, (3) 4-6/week, (4) Daily
Estimate of the actual number of infected people in Japan (x 103) 2,588 3.910 2.135
(1) Less than 2,000, (2) 2,001-5,000, (3) 5,001-20,000, (4) More than 20,000
COVID-19 causes serious problems for self 2,632 4.072 0.997
34(1) No, (2) Weakly No, (3) Neutral, (4) Weakly Yes, (5) Yes
Precipitation probability above which you would carry an umbrella (%) 2,637 51.600 19.468
Which of these sayings characterizes you better? 2,600 2.495 1.293
(A) Nothing ventured, nothing gained. (B) A wise man never courts danger.
(1) B, (2) Lean B, (3) Neutral, (4) Lean A, (5) A
Generally speaking, would you say that most people can be trusted? 2,097 3.048 1.059
(1) No, (2) Weakly No, (3) Neutral, (4) Weakly Yes, (5) Yes
It is important to do something for the good of society. 2,093 3.530 0.984
(1) No, (2) Weakly No, (3) Neutral, (4) Weakly Yes, (5) Yes
It is important to help people nearby and care for their well-being 2,096 3.633 0.979
(1) No, (2) Weakly No, (3) Neutral, (4) Weakly Yes, (5) Yes
It is important to always behave properly. 2,096 4.141 0.881
(1) No, (2) Weakly No, (3) Neutral, (4) Weakly Yes, (5) Yes
It is important to avoid doing anything people would say is wrong. 2,097 3.063 1.001
(1) No, (2) Weakly No, (3) Neutral, (4) Weakly Yes, (5) Yes
I often donate. 2,098 2.327 1.090
(1) No, (2) Weakly No, (3) Neutral, (4) Weakly Yes, (5) Yes
Tried to buy masks more than usual? (1) Yes, (0) No 2,610 0.500 0.500
Tried to buy disinfectant soaps more than usual? (1) Yes, (0) No 2,604 0.321 0.467
35You can also read