Classification of unlabeled online media - Nature
←
→
Page content transcription
If your browser does not render page correctly, please read the page content below
www.nature.com/scientificreports
OPEN Classification of unlabeled online
media
Sakthi Kumar Arul Prakash1 & Conrad Tucker1,2,3,4,5*
This work investigates the ability to classify misinformation in online social media networks in a
manner that avoids the need for ground truth labels. Rather than approach the classification problem
as a task for humans or machine learning algorithms, this work leverages user–user and user–media
(i.e.,media likes) interactions to infer the type of information (fake vs. authentic) being spread,
without needing to know the actual details of the information itself. To study the inception and
evolution of user–user and user–media interactions over time, we create an experimental platform
that mimics the functionality of real-world social media networks. We develop a graphical model that
considers the evolution of this network topology to model the uncertainty (entropy) propagation
when fake and authentic media disseminates across the network. The creation of a real-world social
media network enables a wide range of hypotheses to be tested pertaining to users, their interactions
with other users, and with media content. The discovery that the entropy of user–user and user–media
interactions approximate fake and authentic media likes, enables us to classify fake media in an
unsupervised learning manner.
The idea that people may not be suitable to assess the authenticity of information without the aid of additional
tools is widely explored by the forensics c ommunity1,2. Information sharing in social media is highly dependent
on data modality, the behavior of fellow networkers, the habit of using online services, and the widespread pres-
ence of opinion leaders in posts and c omments3,4. In some cases, information is doctored using deep fakes5, or
manipulated by spreading misinformation relating to health outbreaks such as COVID-196,7. Beyond affecting
the conduit of social media networks, much of algorithmic fake news detection2,8 or recommender systems9
rely on data type identification and data labeling. Such information is typically manually compiled by content
moderators in social media companies who may undergo post-traumatic stress disorder as a result of viewing
disturbing media10,11. Data-driven supervised methods benefit from superior classification accuracy due to the
availability of labels but may fail to generalize to unseen data and often rely on manual human labeling. Alter-
natively, unsupervised methods do not rely on labels to classify data and address the trade-off in accuracy with
the help of additional features, feature representation techniques, or complex models. Thus, there is a necessity
to shift towards unsupervised approaches for content discovery or fake media d iscovery12–14.
In this study, we consider (1) work that seeks to understand why misinformation spreads and (2) work
that seeks to prevent the spread of misinformation through classification. Current literature has improved our
understanding of truth and falsity diffusion through quantitative analyses on the spread of rumors such as the
discovery of the Higgs b oson15, and the spread of anti-vaccine campaigns that led to decreases in vaccination rates
against measles16,17. Other studies have investigated rumor diffusion m odeling18, credibility evaluation19,20 and
intervention strategies to curtail the spread of rumors21. Similar analyses have been conducted in social media
networks such as Facebook, where Del Vicario et al.22 analyze the diffusion of science and conspiracy-theory
stories, and in Twitter where Bovet and Kakse23 study the influence of fake news during the 2016 presidential
election, and Vosoughi et al.24 study the characteristics of fact-checked rumors.
The spread of information, authentic or fake, is however significantly impacted by the credibility of the users
in the network and their connections25. In a social media network such as Twitter, users form opinions and
beliefs26 based on outside influences23,27, and use these opinions to test if information adheres to or opposes their
beliefs28. Though the most direct measure of user credibility involves asking the other u sers29, such a measure
is often subjective. Additionally, a subjective measure does not apply to sources or users previously unknown
to a u ser30. However, such occasions are likely to occur during times of disasters such as COVID-197, or during
1
Department of Mechanical Engineering, Carnegie Mellon University, 5000 Forbes Avenue, Pittsburgh,
PA 15213‑3890, USA. 2Department of Machine Learning, Carnegie Mellon University, 5000 Forbes Avenue,
Pittsburgh, PA 15213‑3890, USA. 3The Robotics Institute, Carnegie Mellon University, 5000 Forbes Avenue,
Pittsburgh, PA 15213‑3890, USA. 4Department of Biomedical Engineering, Carnegie Mellon University, 5000
Forbes Avenue, Pittsburgh, PA 15213‑3890, USA. 5CyLab Security and Privacy Institute, Carnegie Mellon
University, 5000 Forbes Avenue, Pittsburgh, PA 15213‑3890, USA. *email: conradt@andrew.cmu.edu
Scientific Reports | (2021) 11:6908 | https://doi.org/10.1038/s41598-021-85608-5 1
Vol.:(0123456789)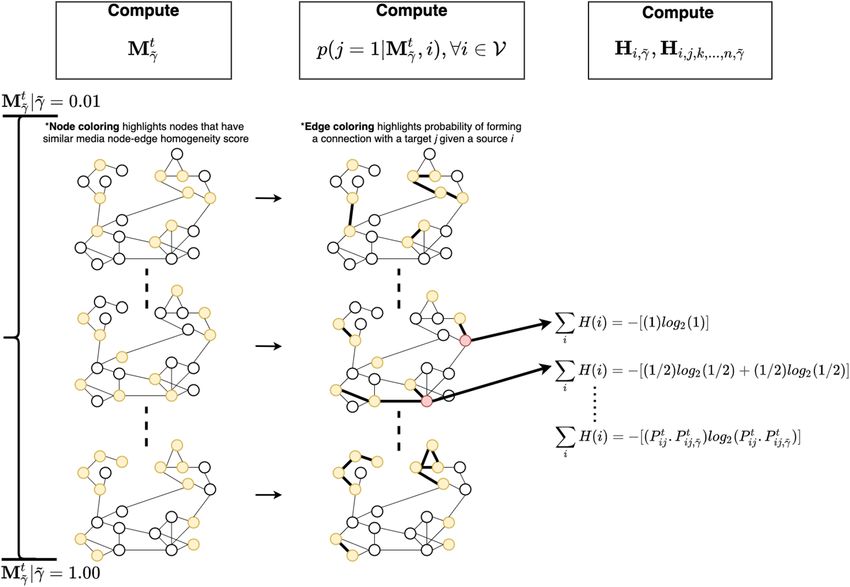
www.nature.com/scientificreports/
measles outbreaks16,17 where authentic information was provided by those physically attending the event30. Hence,
we are interested in understanding how fake information spreads in a controlled social media network where
users respond to unknown users with the help of an objective credibility measure.
Node-edge homogeneity and the homogeneous sharing paths created by social media users during the evolu-
tion of a social media network, play a critical role in the spread of fake i nformation22,31,32. It has been shown that
users’ opinions on media and their engagement behaviors on social media networks can be utilized to distinguish
between authentic and fake i nformation8,33,34. However, such w ork8,33,34 typically makes use of supervised learning
techniques to detect fake information, requiring a labeled dataset. Though these supervised methods have shown
promising results, they suffer from a critical limitation of requiring a pre-annotated dataset to train a classification
model. Further, Chu et al.35 and W ang33 have released Facebook and Twitter datasets that include user activity
and interactions pertaining to a specific time period, thereby not capturing the organic growth of user–user con-
nections from the time users join the network. In order to address the limitations of requiring human-annotated
datasets to train supervised models, crowd-sourcing approaches make use of platforms such as Amazon Mechani-
cal Turk to recruit workers as users or as data labelers to take part in social media experiments. Crowd-sourcing
techniques typically leverage cost-effective workers to obtain annotations, hence alleviating the burden of expert
checking36. Long et al.37 and Rodrigues et al.38 propose a Bayesian probabilistic approach coupled with active
learning, wherein they use crowd-sourced data to estimate both the data authenticity as well as the credibility of
each individual data labeler/user. Recent s tudies39,40 have proposed replacing the Expectation-Maximization (EM)
algorithm which is typically used for parameter estimation and inference with a deep generative model such as a
variational auto-encoder (VAE). By replacing the EM algorithm with neural networks, the additional computa-
tional overhead can be avoided, which allows the models to generalize beyond classification settings40. Rodrigues
et al.40 introduce an additional layer (crowd layer) in their CNN such that the typical softmax output layer is
transformed into a bottleneck layer while allowing the crowd layer to handle data labeler/user reliability and
labeling noise. While deep neural networks have been shown to improve the classification/labeling accuracy of
unsupervised probabilistic models that use EM, the notion of explainability is replaced by a black-box approach.
A study by Yang et al.14 proposes an unsupervised approach for detecting misinformation in online social media
networks such as Twitter and Facebook using yet another probabilistic graphical approach. In their approach,
Yang et al. consider the credibility of users as a latent random variable in addition to user opinions and use an
efficient Gibbs sampling approach to estimate news authenticity. While supervised approaches such a s8,33,34 have
leveraged user–user interactions, these unsupervised probabilistic approaches14,38–40 explicitly assume that each
user’s opinion is independent of other users. Hence, they do not consider user–user interactions, which can be
an influential source of recommendation in Twitter and F acebook41–43, especially if users know one another.
14,38–40 39
Further, prior w ork considers news f eatures as a latent random variable in addition to considering the
authenticity of news/data and the credibility of the data labelers/users37,40 as latent random variables.
When presented with uncertainty, human behavior in social media networks tends to react differently,
employing unconventional social heuristics44. Hence, regardless of whether users know one another, there exists
uncertainty in what a user likes and who they follow or befriend. The use of information-theoretic measures,
such as entropy, avoids making assumptions about human behavior, thus allowing statistical characterization
of uncertainty45 in social media networks. Shannon’s entropy has been used as a statistical feature in detecting
rumors in social media46, abnormal activities or anomalies in IoT devices and sensor networks47–49. In addition to
detecting anomalies, entropy has also been used in determining the credibility of machines in a machine-machine
communications network in order to distinguish malicious nodes from honest nodes by iteratively updating the
credibility value of each node for every message passed between the n odes50. Similarly, entropy has also been
used to estimate the veracity of topics from tweets, such a measure has been reported to categorize tweets in the
veracity spectrum in a consistent m anner51.
Since it is evident that users in social media networks adhere to a notion of credibility before following a
user and liking media, we derive a relationship between an objective credibility measure, user opinions (media
likes), and the probability of following or establishing a connection with a user. We show that such a relationship
helps understand the connection between user opinions and the credibility of users, and how they affect the
probability of users making new connections. To that end, unlike prior a pproaches14,38–40, in our work, we do
not consider the authenticity/label of the data as a latent variable, but instead only consider user opinions as a
latent variable. This avoids the assumption that users like and share media on the basis of truth when users could
intentionally like or share media on the basis of satire52. Additionally, the derived proportionality between user
credibility and user opinion allows us to use one in place of another, thereby decreasing the number of latent
variables considered. Then, we compute the entropy of user–user connections given user opinions in order to
map user interactions to a quantifiable value that expresses the uncertainty contributed to the network by each
user. Further, by exploiting the principle of entropy, we select users based on a threshold entropy to take part
in a majority voting in order to distinguish fake information from authentic information. This allows utilizing
users and their interactions as features to detect misinformation while decoupling the estimation of credibility
or opinion and classification of data.
The paper is presented as follows. First, we annotate the controlled experiment conducted to collect real-time
social network data. Then, we derive a relationship between user credibility, media likes, and the probability of
establishing a connection with a user, followed by a comprehensive analysis that shows how entropy explains
the spread of fake information. Finally, we propose an unsupervised model that uses entropy to select users to
classify information as fake or authentic.
Scientific Reports | (2021) 11:6908 | https://doi.org/10.1038/s41598-021-85608-5 2
Vol:.(1234567890)
www.nature.com/scientificreports/
Figure 1. The user interface of the designed experimental platform that replicates the functionality of Twitter
social media network.
Methods
Data collection. We conduct a real-life social experiment, wherein participants are recruited from the
crowd-sourcing platform Amazon MTurk (AMT) to participate in the study. The study was conducted with the
approval of and in accordance with the relevant guidelines and regulations of The Pennsylvania State Univer-
sity’s Institutional Review Board (IRB). Prior to the conduct of the study, informed consent was obtained from all
participants for participation in the study. Only human subjects of age 18 or above were included in the study.
We created a mock online social media platform that replicates the functionality of Twitter as shown in Fig. 1 and
follows their directional model of interactions. We restrict users from posting their own media and from unfol-
lowing a followed user to conduct a controlled real-time, real-world social experiment. This web application is
released for public use to replicate or conduct similar online social experiments. The focus of the data collec-
tion is to organically acquire the interactions between unknown users rather than from known users within the
network in order to gain a fundamental understanding of how fake information can be classified using random
user opinions. We populate the social network with authentic and fake videos from the FaceForensics data set53
and verified fake YouTube videos. The users were monetarily incentivized to spend at least 45 min per Human
Intelligence Task (HIT). To ensure that the human subjects are reliable in staying throughout the study and with
a provision for new users to join, we only recruited subjects who had a HIT’ (Human Intelligence Task) approval
rate of greater than 90% in all requesters’ HITs. A user was allowed to participate in any number of HITs over
the period of study, ensuring that the same user population could log into the network and continue accruing
credibility and followers. We chose to use 40 random videos, with 20 being authentic and the other 20 fake. The
total number of enrolled users in the study was 620, which falls within the range of participants recruited for
other social science experiments that utilize AMT54,55.
To simulate a real-world scenario in Twitter where users follow users or are followed by users thereby form-
ing explicit connections56, we introduce the notion of user credibility. According to Resnick et al.57, reputation
mechanisms provide an incentive for honest behavior and help users make decisions involving trust. In this
study, we develop an approach to compute user credibility using trust modeling. Specifically, we use the Beta
Reputation System (BRS)58 used in e-commerce to calculate the credibility of users. We select this method as it is
grounded in probability theory and uses expectations on probability distributions to derive the predicted benefit
of trust to help users form explicit connections in a participatory media setting. The credibility of user i is Ci and
we assume the prior probability of Cit at time t to be generated from a Beta distribution with parameters at (prior
authentic media category counts) and bt (prior fake media category counts) such that Cit ∼ Beta(at , bt ). We use
the uniform distribution as prior to the Beta distribution such that every new user is assigned a credibility score
of 0.1. As the user continues to form new links within the network, and like media, the credibility score gets
updated. We use a Bayesian update rule to update the credibility score of the user at each timestamp. We state
the credibility update rule for user i such that the parameter at is updated as ait+1 ← ait + aiδt and bt is updated
as bit+1 ← bit + biδt such that,
Scientific Reports | (2021) 11:6908 | https://doi.org/10.1038/s41598-021-85608-5 3
Vol.:(0123456789)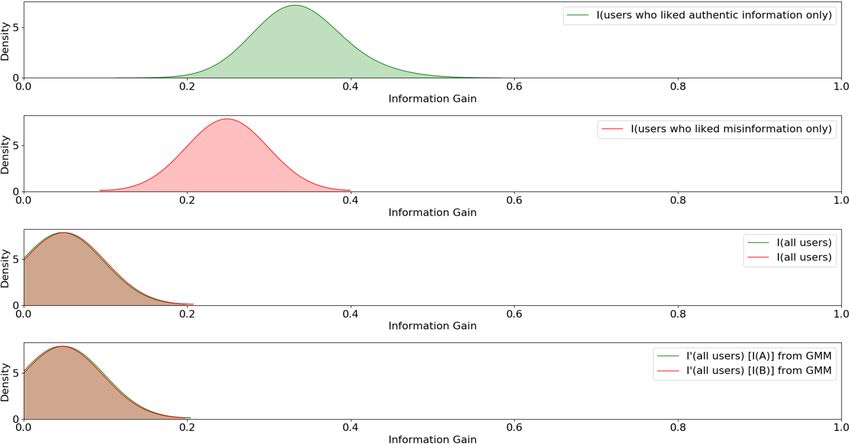
www.nature.com/scientificreports/
Figure 2. Fitted regression curve to follower counts against credibility score.
Figure 3. Credibility score distribution.
ait + aiδt
Ci(t+1) = (1)
ait + aiδt + bit + biδt
where δt is 20 min. To understand the relationship between credibility and follower count, we fit a regression
model between follower counts and user credibility as shown in Fig. 2 and find the co-efficient of determina-
tion (R2) as 0.56. This shows that there is a positive correlation between follower count and credibility score.
Additionally, we also compute and illustrate the final credibility score distribution of the social media network
at the last timestamp as shown in Fig. 3. We find that the distribution closely fits the Beta distribution given the
uniform prior with E[C] = 0.1. We also provide a monetary incentive to the top three users who earn the highest
credibility score and get the highest user following by the end of the 2-day experiment.
Preliminaries and definitions. The social network under study is a directed network having links
specifying the followers (in-degree) and the following (out-degree). A social network G (t) := {V , E } is
an order 2 Tensor such that G t ∈ RN×N where N represents the number of users or V such that V ∈ RN ,
E := {(i, j)|i, j ∈ V , i �= j, E ⊆ V × V } is the set of all pairs of distinct nodes, called edges and t ∈ T
denotes timestamp index when all network information is saved in the database. Let the degree matrix D of
G = diag(d(1), . . . , d(N)) and A denote the adjacency matrix such that Aij = 1 if and only if i follows j in case
of out-degree network (Gout ) or j is followed by i in case of in-degree network (Gin). The media liked by node i
is denoted as Zi which is a one-hot vector, where Zi = [Z1 , Z2 , . . . , ZL ] and Zl denotes the user i liking category l
such that Zl = 0 indicates no like and Zl = 1 indicates media like.
Relating entropy to user credibility. We assume that users recruited in our social network are not
known to each other and by showing every user the credibility of all users, we assume that users tend to follow
or be followed by other users on the basis of credibility. We observe a positive linear correlation between the
number of links connected to a user (in-degree) and credibility as shown in Fig. 2, consistent with findings from
other works30. However, in reality, such a credibility measure is often network-dependent, or may not be read-
Scientific Reports | (2021) 11:6908 | https://doi.org/10.1038/s41598-021-85608-5 4
Vol:.(1234567890)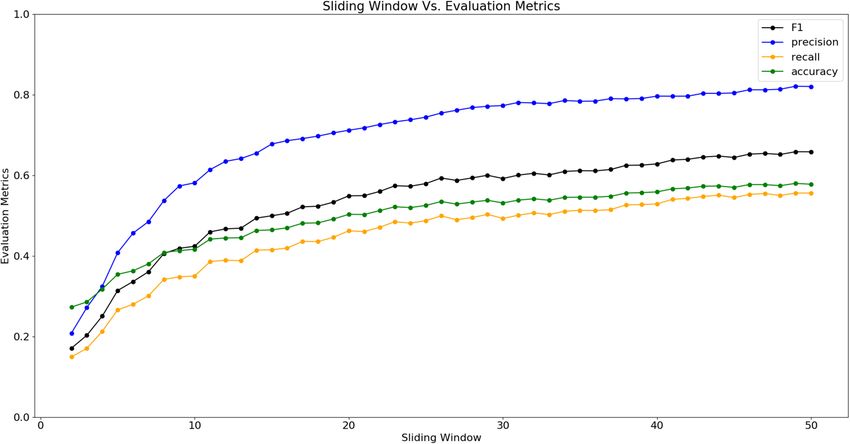
www.nature.com/scientificreports/
ily available. Hence, we use links and media likes to approximate user credibility. We define a similarity metric,
Media Node-Edge Homogeneity, which computes similarity as a function of common media liked by any two
users, which have an edge connection at time t. We denote the media node-edge homogeneity (MNEH) metric
as Mijt , where,
|Zit ∩ Zjt |
Mijt = (2)
|Zit ∪ Zjt |
In Eq. (2), Mijt between any two users i and j at time (t), is bounded between the interval [0, 1], where, 0 ≤ Mij ≤ 1
expresses the magnitude of similarity in media likes between any two users i and j. The node-edge homogeneity
interval [0, 1] is discretized with a resolution of 0.01. The MNEH matrix (Mt ) is a sum of matrices as shown in
t = 1 if and only if the similarity in media liked by users i and
Eq. (3) with varying γ , such that γ̃ = γ /100, Mij,γ
j is γ %.
100
Mt = γ̃ Mγ̃t (3)
γ =1
Given At and Mt from the in-degree and out-degree networks, we assess the Directed Acyclic Graph (DAG) con-
necting i, j and Mt . We assume liking media and forming links with other users to be conditionally independent
events since j = 1 is observed thereby breaking the dependence between the events. Hence, we compute the
probability of a link between user i and j for each instant in time t as shown in Eq. (4).
p(j = 1|Mγ̃t , i) = p(j = 1|i).p(j = 1|Mγ̃t )
t p(j = 1, Mγ̃t )
= (AD−1 )ij .
p(Mγ̃t )
t
= (AD−1 )ij .(Mγ̃ D−1
t (4)
Mγ̃ ) ij
= ((A ◦ Mγ̃ )D−1 t
AMγ̃ )ij
= Pijt .Pij,
t
γ̃
where p(j = 1|i) = Pijt is a conditional probability which represents the probability of a link formed with user j
given user i at time t such that Pijt is an element of the transition matrix (Pt ) which is algebraically computed
p(j=1,Mγ̃t )
as (AD−1 )t , and p(Mγ̃t )
t is computed as follows,
= Pij,γ̃
t = 1}
p(j = 1, Mγ̃t ) 1 {Mij, γ̃
=
p(Mγ̃t ) j∈N
t = 1}
1 {Mij, γ̃
t (5)
= (Mγ̃ D−1
Mγ̃ ) ij
t
= Pij,γ̃
where DAM γ̃ is a diagonal matrix such that DAMγ̃ ,ii = j∈N (A ◦ M)ij,γ̃ , DMγ̃ is a diagonal matrix such that
DMγ̃ ,ii = j∈N Mij,γ̃ and (◦) denotes Hadamard product operation between matrices. For each media cat-
egory l ∈ L, Zjlt is generated from a Bernoulli distribution with parameter Cjt such that Zjlt ∼ Bernoulli(Cjt ) and Cjt
is the probability of user j liking l. Hence, we assume the prior probability of Cjt to also be the assumed credibility
of a user j and sampled from a Beta distribution with parameters at (prior authentic media category counts) and
bt (prior fake media category counts) such that Cjt ∼ Beta(at , bt ). In a similar manner as Eq. (4), we compute the
probability of a link between user i and j given the media matrix (Zjt ) for each instant in time t as shown inEq. (6)
p(j = 1|Zjt , i) = p(j = 1|i).p(j = 1|Zjt )
= Pijt . p(j = 1, Cjt |Zjt )dCjt
= Pijt . p(j = 1|Cjt ).p(Cjt |Zjt )dCjt
Pijt
Zjlt +at −1 (1−Zjlt )+bt −1
= Cj .(1 − Cjt ) dCjt (6)
B(at , bt )
B(Zjlt + at , Zjlt + bt )
= Pijt .
B(at , bt )
at
= Pijt . t
a + bt
= Pijt .Cjt
Scientific Reports | (2021) 11:6908 | https://doi.org/10.1038/s41598-021-85608-5 5
Vol.:(0123456789)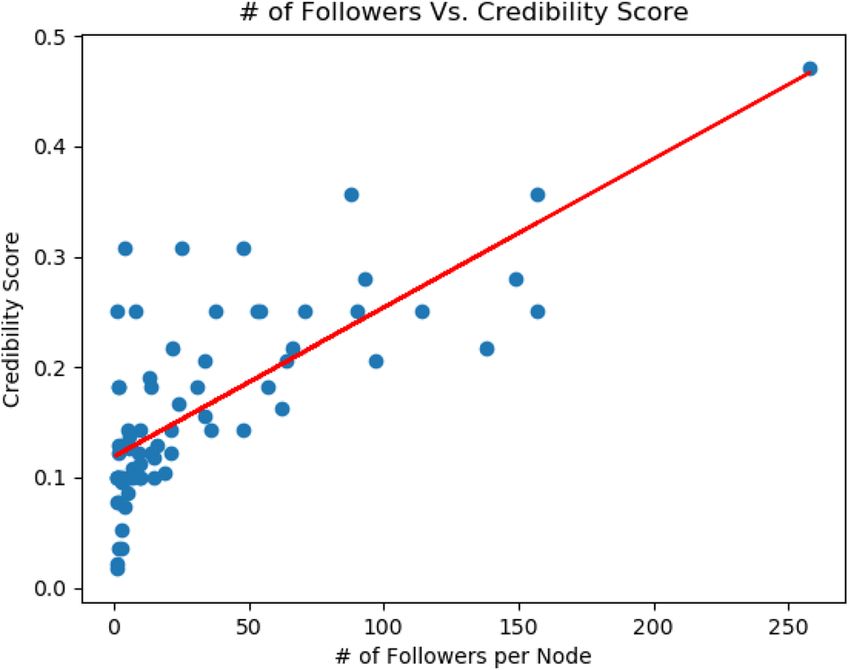
www.nature.com/scientificreports/
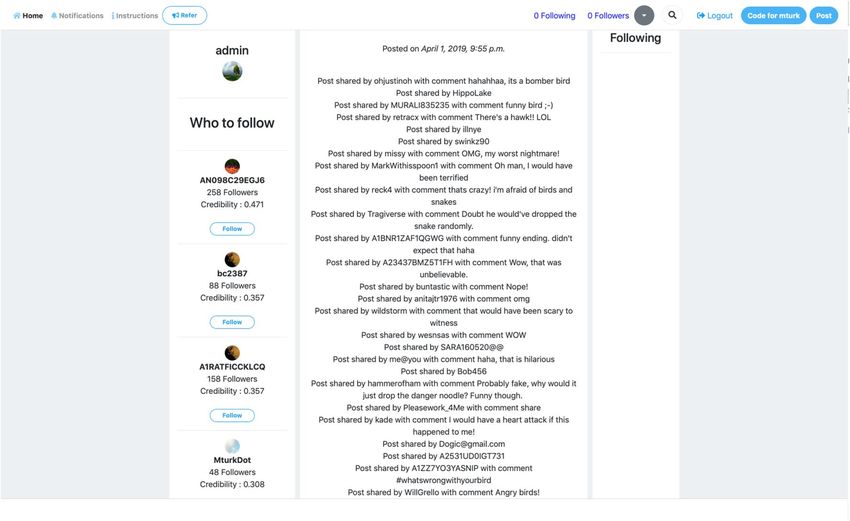
Figure 4. Social media network at time t. The figure presents a visual overview of the steps involved in
computing the MNEH matrix (Mγ̃t ) when γ̃ varies between 0.01 and 1.00, then computing the probability of
forming a connection with user j given user i, and the entropy contribution of target nodes (colored red).
where B(.) is the Beta function and normalizes the expression in Eq. (6). Let p(j = 1|Zjt ) be denoted by �(Z)
and p(j = 1|Mjt ) be denoted by F (�(Z)) since Mjt is a function of Zjt . Using the results from Eqs. (4) and (6),
we derive the proportionality between Cjt and Pij,
t given γ̃ for every timestamp as shown by Eq. (7).
γ̃
p(j = 1|i).p(j = 1|Zjt ) p(j = 1|i).p(j = 1|Mγ̃t )
=
Cjt t
Pij, γ̃
p(j = 1|i).�(Z) p(j = 1|i).F (�(Z)) (7)
=
Cjt t
Pij, γ̃
t t
Pij,γ̃ ∝ Cj
Hence, from Eq. (4), it is evident that we are indeed computing a weighted transition probability with the weight
being proportional to the user’s credibility. Using these results, we now compute the Shannon’s Information
Entropy (joint entropy) generated by all users (i, j, k, ..., n) as the sum of entropy generated by each user at time t.
N
N
t
Hi,j,k,...,n, γ̃ = − (Pijt .Pij,
t t t
γ̃ ) log2 (Pij .Pij,γ̃ ) (8)
i j
Results and discussion
Objective. The objective of this study is to use the entropy response of media node-edge homogeneity over
time to perform unsupervised classification of fake media. We present a visual overview of our entropy compu-
tation approach as shown in Fig. 4, along with an algorithm box (Algorithm 1). We have organized this section
to discuss hypotheses, hypotheses testing, and how the tests inform the selection of users that separate fake
and authentic media in a majority voting classifier to classify fake media. Hereafter, the notations H0 , H0∗ and
Ha , Ha∗ refer to null-hypothesis and alternate hypothesis respectively.
Scientific Reports | (2021) 11:6908 | https://doi.org/10.1038/s41598-021-85608-5 6
Vol:.(1234567890)www.nature.com/scientificreports/
Entropy of media node‑edge homogeneity. We compute the joint information entropy of the matrix
for each value of γ̃ and for each t using Eq. (7). The social media network is directional as it has an in-degree or
followee network and an out-degree or follower network. Hence, we hypothesize that the entropy generated by a
random variable (X ) representing social network users in the in-degree and the out-degree network is sampled
from the same underlying node-edge distribution, formally stated as follows:
H0: H(X)in = H(X)out.
Ha : H(X)in = H(X)out.
where H(X)in and H(X)out denotes entropy distribution in in-degree and out-degree network respectively.
We use H0 and Ha to denote the null hypothesis and alternate hypothesis following conventional notation. We
perform a Kolmogorov–Smirnov (KS) test between the in-degree entropy distribution and out-degree entropy
distribution to test our hypothesis. For all hypothesis tests, we use a significance level (α) of 0.05. We find no
statistically significant difference between the in-degree entropy distribution and out-degree entropy distribu-
tion with a KS statistic = 0.09 and p value = 0.81, thereby failing to reject the null hypothesis. Figure 5 illustrates
entropy response and media likes distribution against varying media node-edge homogeneity for the in-degree
network across all timestamps such that each timestamp is overlaid against the other. The comparison draws
attention to the correlation between media distribution and entropy distribution in the in-degree network. To
check for correlation, we compute the Pearson’s correlation coefficient between Mt and Ht , where Ht represents
network entropy distribution at time t while Mt represents media node-edge homogeneity of the network at
time t. We compute the correlation for all t ∈ T and for all users in the in-degree and out-degree network. The
average correlation across all timestamps is ρ = 0.82, suggesting that entropy and media likes distribution are
strongly positively correlated. Hence we hypothesize that the entropy in either network is sampled from the
same distribution as the fake and authentic media distribution. Formally, we state our hypotheses as follows:
H01: H(X) = T(Z) and H02: H(X) = F(Z)
Ha1: H(X) = T(Z) and Ha2: H(X) = F(Z)
where T(Z) and F(Z) denotes the authentic and fake media distribution of the random variable (Z) respectively.
We find no statistically significant difference between entropy distribution and authentic media distribution (H01)
with a KS Statistic = 0.14 and p value = 0.28, thereby failing to reject the null hypothesis H01. We also find no sta-
tistically significant difference between entropy distribution and fake media distribution (H02) with a KS statistic
= 0.12, p value = 0.46, thereby failing to reject the null hypothesis H02. Thus, we observe that entropy response of
media node-edge homogeneity and media likes distribution are strongly positively correlated. Though entropy
response is individually correlated with authentic and fake media distribution, we hypothesize that it character-
izes the superposition of both the media distributions. We assume and also empirically show (see Fig. 6a–c) that
Scientific Reports | (2021) 11:6908 | https://doi.org/10.1038/s41598-021-85608-5 7
Vol.:(0123456789)www.nature.com/scientificreports/
Figure 5. Normalized entropy response and normalized likes distribution against media node-edge
homogeneity in the in-degree network.
the underlying media likes distribution, as well as entropy distribution, are sampled from a Gaussian distribu-
tion such that media likes distribution is approximated as a linear combination of Gaussians, one describing
the spread of fake media likes and the other describing the spread of authentic media likes as shown in Fig. 6d.
Based on our hypothesis, we assume that H ∼ N(µ, σ 2 ) is decomposable as a mixture of Gaussians such
that Hauthentic + Hfake ∼ N(µauthentic + µfake , σauthentic
2 2 ), where each Gaussian component represents the
+ σfake
underlying authentic and fake media likes distribution. Then we compute the Jensen–Shannon divergence (JSD)59
between the actual joint entropy distribution (H) and Gaussian approximated entropy distributions (HA and
HB ) as follows,
I(A) = JSD(H||HA˜N(µA , σA2 ))
(9)
I(B) = JSD(H||HB˜N(µB , σB2 ))
Hence, we formulate another pair of hypotheses:
2
H01 : I(H; N(µauthentic , σauthentic 2 ))
)) = I(H; N(µfake , σfake
H02 : I(A) = I(B).
2
Ha1 : I(H; N(µauthentic , σauthentic 2 ))
)) �= I(H; N(µfake , σfake
Ha2 : I(A) �= I(B).
To test our hypotheses, we use the Expectation-Maximization algorithm to estimate the Gaussian parameters
and fit the data to the Gaussian components found using Gaussian mixture modeling. We perform a KS test
between the information gain from authentic and fake media distribution as well as from the approximated
Gaussian components. We reject the null hypothesis (H01) that authentic media likes distribution is statistically
significantly different from that of the fake media likes distribution with KS statistic = 1.0, p value = 9.99e−16
and the null hypothesis (H02) that approximated authentic media likes distribution is statistically significantly
different from that of the approximated fake media distribution with KS statistic = 1.0, p value = 8.61e−83 for
the in-degree network.
Now, we describe how our model uses the results from the hypotheses tests to select user opinions as features
for the media classifier. Once we compute the joint entropy response of the network to media node-edge homo-
geneity for varying γ , we approximate joint entropy as a mixture of Gaussians. We then compute the information
gain from actual entropy and either of the Gaussian approximated media distributions and select the distribu-
tion with the maximum information gain (Q). Then, we define threshold (η) as a percentage of maximum user
entropy in the network such that Q is the set of all users above η. Since the maximum entropy generated by a
user is 4.0 bits, >25% refers to all users who have generated greater than 1.0 bit of entropy. We then compute an
aggregated histogram of media likes per category from all users above the threshold. This enables us to aggre-
gate all the media opinions of users in Q who have been selected as features for the media classifier. Finally, we
compute the average media likes per category and predict media categories with media likes above that of the
Scientific Reports | (2021) 11:6908 | https://doi.org/10.1038/s41598-021-85608-5 8
Vol:.(1234567890)www.nature.com/scientificreports/
Figure 6. (a) Gaussian KDE of in-degree users who have only liked authentic media, (b) Gaussian KDE
of in-degree users who have only liked fake media, (c) Gaussian KDE of all in-degree users who have liked
authentic and fake media, (d) GMM approximation of information gain from authentic and fake media.
average media likes per category as authentic media, else fake. Algorithm box 2 depicts the media classification
process in a step-by-step manner.
Since it has been shown that there exists a positive correlation between users and credibility, we test our model
on the users from only the in-degree network. Apart from selecting users based on our model, we validate our
work by benchmarking against (1) all users from the network as a classifier and (2) Durall et al. m ethod60 which
is a state-of-the-art unsupervised media classifier. From Table 1, we observe that using the combined human
decision is similar to a random coin flip. Since we assume that media likes refers to user a uthentication14, other
evaluation metrics such as F1 score, precision and recall, cannot be calculated from just media likes. In replicat-
ing Durall’s method, we compute feature embeddings for all media used in this experiment and consider this
Scientific Reports | (2021) 11:6908 | https://doi.org/10.1038/s41598-021-85608-5 9
Vol.:(0123456789)www.nature.com/scientificreports/
Method η Precision Recall Accuracy F1 score
Social network users – – – 0.50 –
CNN & k-means (k=2)60 – 0.67 0.69 0.67 0.68
Ours (> 0)% 0.83 0.50 0.50 0.63
Ours (> 25)% 0.86 0.60 0.58 0.71
Ours (> 50)% 0.88 0.70 0.67 0.78
Ours (> 75)% 1.00 0.60 0.67 0.75
Table 1. Comparison of evaluation metrics.
the test set. We use the convolutional neural network (CNN) architecture proposed by Durall et al. to generate
media embeddings for the test set, which we use as input to the k-means clustering method with k = 2. We find
the F1 score of the unsupervised classifier to be outperformed by our model, as shown in Table 1. We find that
selectively filtering users on the basis of a network independent measure such as entropy is sufficient to classify
fake media with an accuracy higher than random chance and unsupervised state-of-the-art model. In a net-
work where users are initially unknown to one another, we find that it is possible to approximate the underlying
objective credibility using user opinions. Further, by computing the entropy response of the in-degree users
using media node-edge homogeneity, we compute the entropy within the network. We approximate entropy as
a superposition of fake and authentic media likes distribution. Since the distribution of fake media is different
from authentic media, we are able to use the Gaussian approximated cluster with the highest information gain
to utilize user opinions as features to classify fake media.
Time invariance of the proposed model. To study if our model is time-invariant to information classifi-
cation, we perform an empirical experiment by introducing a sliding window parameter h. In Fig. 7, we illustrate
the average performance of the classifier across all timestamps for every sliding window parameter in the range
[2,50] and a stride parameter s = 3 which corresponds to the movement of the time window across time. We
find that varying the time window varies the F1 score of the classifier with increasing time windows leading to
increased F1, precision, recall and accuracy scores. When the sliding window parameter is increased by a value
of 1 from 3 to 50, we approach the highest media classification accuracy and F1 score as shown in Table. 1. Since
a time window of 2 corresponds to a period of 40 min in our study, a period of 17 h is required to achieve an F1
score of 0.68 which is comparable to the performance of the state-of-the-art unsupervised media classifier. Since
social media networks have been operational for hundreds of thousands of hours, accessing prior time should
not be an issue. In comparison, the state-of-the-art unsupervised approach proposed by Durall et al. requires
neural network fine-tuning as new media is uploaded to the network or in the worst case, re-training, given the
development of new media doctoring tools. Hence, while our model is not time-invariant, we show that it is
possible for user–user and user–media interactions of a network over a period of time to be able to quantify the
entropy needed to filter fake media.
Further, if we consider the relationship between time and entropy, we find that user activity in different times-
tamps often differs as a result of varying interaction with media (some network interactions happen at various
timestamps with huge period of inactivity), causing entropy distribution of individuals to fluctuate with high
uncertainty. However, when we consider 50 timestamps as shown in Fig. 7, the uncertainty due to user entropy
fluctuations across different timestamps averages out, yielding consistent metric scores. This further highlights
the dependence between time and the evolution of entropy.
Conclusions
In this study, we design and conduct a controlled social media experiment with unknown human subjects in a
network similar to Twitter. To characterize fake media using a network independent metric, we propose using
media polarity and node-edge homogeneity, which are well-known detriments affecting the spread of fake media
as a metric to compute the similarity between users in the network. In social media networks, interactions such
as liking and sharing media, and forming/removing connections with other users, lead to the fluctuation of
entropy over time. The entropy response of the in-degree users is captured using media node-edge homogeneity
to compute the entropy within the network. In this paper, we compute entropy as a function of media polarized
node-edge homogeneity to characterize the spread of fake and authentic media. Using our findings, we describe
a majority voting classifier to classify online media using selective user opinions. However, our model is limited
by the size of the moving window with the moving window size equal to that of the whole study improving the
F1 score of the classifier. This shows that new users who join the network at different times are valuable for media
classification. As future work, selective user opinions can be filtered using approaches such as active learning
and combined with unsupervised media classifiers to further improve fake media classification in social media
networks.
Apart from our findings, we highlight some of our assumptions that can possibly be grounded in theory
using existing work or addressed as future work. We assume that no user knows each other prior to joining the
network (random user network), media likes equal validation of authenticity, our 2-day study linearly maps to
a longer-term study. Finally, future work may consider exploring the generalizability to other media types such
as text and audio.
Scientific Reports | (2021) 11:6908 | https://doi.org/10.1038/s41598-021-85608-5 10
Vol:.(1234567890)www.nature.com/scientificreports/
Figure 7. Sliding window versus evaluation accuracy.
Data availability
The data along with the social media platform that was developed to collect the data as well as the corresponding
algorithm have all been made available at the following repository: https://g ithub.c om/A
iPEX-L
ab/S ocial-N
etwo
rk-Analysis.
Received: 11 November 2020; Accepted: 28 February 2021
References
1. Li, M., Wang, X., Gao, K. & Zhang, S. A survey on information diffusion in online social networks: models and methods. Informa-
tion 8, 118 (2017).
2. Marra, F., Gragnaniello, D., Cozzolino, D. & Verdoliva, L. Detection of GAN-generated fake images over social networks. In 2018
IEEE Conference on Multimedia Information Processing and Retrieval (MIPR) (IEEE, 2018).
3. Lazer, D. M. J. et al. The science of fake news. Science 359, 1094–1096 (2018).
4. Bergström, A. & Jervelycke Belfrage, M. News in social media: incidental consumption and the role of opinion leaders. Digit.
Journal. 6, 583–598 (2018).
5. Chesney, B. & Citron, D. Deep fakes: A looming challenge for privacy, democracy, and national security. Calif. L. Rev. 107, 1753
(2019).
6. Li, L. et al. Characterizing the propagation of situational information in social media during covid-19 epidemic: A case study on
weibo. IEEE Trans. Comput. Soc. Syst. 7, 556–562 (2020).
7. Vaidyanathan, G. News Feature: Finding a vaccine for misinformation. Proc. Natl. Acad. Sci. 117, 18902–18905 (2020).
8. Shu, K., Sliva, A., Wang, S., Tang, J. & Liu, H. Fake news detection on social media: a data mining perspective. ACM SIGKDD
Explor. Newslett. 19, 22–36 (2017).
9. Fouss, F., Francoisse, K., Yen, L., Pirotte, A. & Saerens, M. An experimental investigation of kernels on graphs for collaborative
recommendation and semisupervised classification. Neural Netw. 31, 53–72 (2012).
10. Parks, L. Dirty data: content moderation, regulatory outsourcing, and the cleaners. Film Q. 73, 11–18 (2019).
11. Etlinger, S. What’s so difficult about social media platform governance?. Models Platf. Gov. 20, (2019).
12. Alhindi, T., Petridis, S. & Muresan, S. Where is your evidence: improving fact-checking by justification modeling. In Proceedings
of the first workshop on fact extraction and verification (FEVER) 85–90, (2018).
13. Yang, D. et al. True and fake information spreading over the Facebook. Phys. A Stat. Mech. Its Appl. 505, 984–994 (2018).
14. Yang, S. et al. Unsupervised fake news detection on social media: a generative approach. Proc. AAAI Conf. Artif. Intell. 33, 5644–
5651 (2019).
15. De Domenico, M., Lima, A., Mougel, P. & Musolesi, M. The anatomy of a scientific rumor. Sci. Rep. 3, 2980 (2013).
16. Filia, A. et al. Ongoing outbreak with well over 4,000 measles cases in Italy from January to end August 2017- what is making
elimination so difficult?. Eurosurveillance 22, 30614 (2017).
17. Datta, S. S. et al. Progress and challenges in measles and rubella elimination in the WHO European Region. Vaccine 36, 5408–5415
(2018).
18. Tambuscio, M., Ruffo, G., Flammini, A. & Menczer, F. Fact-checking effect on viral hoaxes: a model of misinformation spread in
social networks. In Proceedings of the 24th International Conference on World Wide Web, 977–982 (2015).
19. Gupta, M., Zhao, P. & Han, J. Evaluating event credibility on twitter. In Proceedings of the 2012 SIAM International Conference on
Data Mining, 153–164 (SIAM, 2012).
20. Johnson, T. J. & Kaye, B. K. Reasons to believe: influence of credibility on motivations for using social networks. Comput. Hum.
Behav. 50, 544–555 (2015).
21. Friggeri, A., Adamic, L. A., Eckles, D. & Cheng, J. Rumor cascades. In ICWSM (2014).
22. Del Vicario, M. et al. The spreading of misinformation online. Proc. Natl. Acad. Sci. 113, 554–559 (2016).
23. Bovet, A. & Makse, H. A. Influence of fake news in Twitter during the 2016 US presidential election. Nat. Commun. 10, 1–14
(2019).
24. Vosoughi, S., Roy, D. & Aral, S. The spread of true and false news online. Science 359, 1146–1151 (2018).
Scientific Reports | (2021) 11:6908 | https://doi.org/10.1038/s41598-021-85608-5 11
Vol.:(0123456789)www.nature.com/scientificreports/
25. Stefanone, M. A., Vollmer, M. & Covert, J. M. In news we trust? Examining credibility and sharing behaviors of fake news. In
Proceedings of the 10th International Conference on Social Media and Society, 136–147 (2019).
26. Klayman, J. & Ha, Y.-W. Confirmation, disconfirmation, and information in hypothesis testing. Psychol. Rev. 94, 211 (1987).
27. Lou, C. & Yuan, S. Influencer marketing: how message value and credibility affect consumer trust of branded content on social
media. J. Interact. Advert. 19, 58–73 (2019).
28. Bandura, A. Social cognitive theory: an agentic perspective. Annu. Rev. Psychol. 52, 1–26 (2001).
29. Golbeck, J. & Hendler, J. Filmtrust: movie recommendations using trust in web-based social networks. In Proceedings of the IEEE
Consumer Communications and Networking Conference, vol. 96, 282–286 (Citeseer, 2006).
30. Briscoe, E. J., Appling, D. S., Mappus IV, R. L. & Hayes, H. Determining credibility from social network structure. In Proceedings
of the 2013 IEEE/ACM International Conference on Advances in Social Networks Analysis and Mining, 1418–1424 (2013).
31. Scheufele, D. A. & Krause, N. M. Science audiences, misinformation, and fake news. Proc. Natl. Acad. Sci. 116, 7662–7669 (2019).
32. Lim, S. & Tucker, C. S. Mining Twitter data for causal links between tweets and real-world outcomes. Expert Syst. Appl. X 3, 100007
(2019).
33. Wang, W. Y. “Liar, Liar Pants on Fire”: a new benchmark dataset for fake news detection. In Proceedings of the 55th Annual Meeting
of the Association for Computational Linguistics (Volume 2: Short Papers), 422–426 (2017).
34. Shu, K., Wang, S. & Liu, H. Beyond news contents: the role of social context for fake news detection. In Proceedings of the Twelfth
ACM International Conference on Web Search and Data Mining 312–320, (2019).
35. Chu, Z., Gianvecchio, S., Wang, H. & Jajodia, S. Detecting automation of twitter accounts: are you a human, bot, or cyborg?. IEEE
Trans. Dependable Secur. Comput. 9, 811–824 (2012).
36. Sheng, V. S. & Zhang, J. Machine learning with crowdsourcing: a brief summary of the past research and future directions. Proc.
AAAI Conf. Artif. Intell. 33, 9837–9843 (2019).
37. Long, C., Hua, G. & Kapoor, A. Active visual recognition with expertise estimation in crowdsourcing. In Proceedings of the IEEE
International Conference on Computer Vision, 3000–3007 (2013).
38. Rodrigues, F., Pereira, F. & Ribeiro, B. Gaussian process classification and active learning with multiple annotators. In International
Conference on Machine Learning, 433–441 (2014).
39. Atarashi, K., Oyama, S. & Kurihara, M. Semi-supervised learning from crowds using deep generative models. In Proceedings of
the AAAI Conference on Artificial Intelligence, vol. 32 (2018).
40. Rodrigues, F. & Pereira, F. Deep learning from crowds. In Proceedings of the AAAI Conference on Artificial Intelligence, 32 (2018).
41. Olmstead, K., Mitchell, A. & Rosenstiel, T. Navigating news online: where people go, how they get there and what lures them away.
Pew Res. Cent. Proj. Excell. Journal. 9, 1–30 (2011).
42. An, J., Cha, M., Gummadi, K. & Crowcroft, J. Media landscape in Twitter: a world of new conventions and political diversity. In
Proceedings of the International AAAI Conference on Web and Social Media, vol. 5 (2011).
43. Hermida, A., Fletcher, F., Korell, D. & Logan, D. Share, like, recommend: decoding the social media news consumer. Journal. Stud.
13, 815–824 (2012).
44. Van den Berg, P. & Wenseleers, T. Uncertainty about social interactions leads to the evolution of social heuristics. Nat. Commun.
9, 1–7 (2018).
45. Zhao, K., Karsai, M. & Bianconi, G. Entropy of dynamical social networks. PloS One 6, e28116 (2011).
46. Zhao, Z., Resnick, P. & Mei, Q. Enquiring minds: early detection of rumors in social media from enquiry posts. In Proceedings of
the 24th International Conference on world wide web, 1395–1405 (2015).
47. Sinda, M. & Liao, Q. Spatial-temporal anomaly detection using security visual analytics via entropy graph and eigen matrix. In
2017 IEEE 15th International Conference on Dependable, Autonomic and Secure Computing, 15th International Conference on
Pervasive Intelligence and Computing, 3rd International Conference on Big Data Intelligence and Computing and Cyber Science and
Technology Congress (DASC/PiCom/DataCom/CyberSciTech, 511–518. (IEEE, 2017).
48. Shukla, A. S. & Maurya, R. Entropy-based anomaly detection in a network. Wirel. Pers. Commun. 99, 1487–1501 (2018).
49. Yang, C. Anomaly network traffic detection algorithm based on information entropy measurement under the cloud computing
environment. Clust. Comput. 22, 8309–8317 (2019).
50. Ahmed, S. & Tepe, K. Entropy-based recommendation trust model for machine to machine communications. In Ad Hoc Networks,
297–305. (Springer, 2017).
51. Paryani, J., Ashwin Kumar, T. K., & George, K. M. Entropy-based model for estimating veracity of topics from tweets. In Interna-
tional Conference on Computational Collective Intelligence, 417–427. (Springer, 2017).
52. Golbeck, J. et al. Fake news vs satire: a dataset and analysis. In Proceedings of the 10th ACM Conference on Web Science, 17–21
(2018).
53. Rossler, A. et al. Faceforensics++: learning to detect manipulated facial images. In Proceedings of the IEEE International Conference
on Computer Vision, 1–11 (2019).
54. Rand, D. G., Arbesman, S. & Christakis, N. A. Dynamic social networks promote cooperation in experiments with humans. Proc.
Natl. Acad. Sci. 108, 19193–19198 (2011).
55. Pennycook, G. & Rand, D. G. Fighting misinformation on social media using crowdsourced judgments of news source quality.
Proc. Natl. Acad. Sci. 116, 2521–2526 (2019).
56. Hansen, D., Shneiderman, B., Smith, M. A. & Himelboim, I. Analyzing Social Media Networks with NodeXL: Insights from a Con-
nected World (Elsevier, 2019).
57. Resnick, P., Kuwabara, K., Zeckhauser, R. & Friedman, E. Reputation systems. Commun. ACM 43, 45–48 (2000).
58. Josang, A. & Ismail, R. The beta reputation system. In Proceedings of the 15th Bled Electronic Commerce Conference, vol. 5, 2502–
2511 (2002).
59. Nielsen, F. A family of statistical symmetric divergences based on Jensen’s inequality. arXiv preprintarXiv:1009.4004 (2010).
60. Durall, R., Keuper, M. & Keuper, J. Watch your up-convolution: CNN based generative deep neural networks are failing to repro-
duce spectral distributions. In Proceedings of the IEEE/CVF Conference on Computer Vision and Pattern Recognition 7890–7899,
(2020).
Acknowledgement
This research was funded in part by the Air Force Office of Scientific Research~(AFOSR) grant FA9550-18-1-
0108. Any opinions, findings, or conclusions found in this paper are those of the authors and do not necessarily
reflect the views of the sponsors.
Author contributions
S.K.A.P. and C.T. designed research; S.K.A.P. and C.T. performed research; S.K.A.P. analyzed data; S.K.A.P. and
C.T. wrote the paper. S.K.A.P. and C.T. reviewed the manuscript.
Scientific Reports | (2021) 11:6908 | https://doi.org/10.1038/s41598-021-85608-5 12
Vol:.(1234567890)www.nature.com/scientificreports/
Competing interests
The authors declare no competing interests.
Additional information
Supplementary Information The online version contains supplementary material available at https://doi.org/
10.1038/s41598-021-85608-5.
Correspondence and requests for materials should be addressed to C.T.
Reprints and permissions information is available at www.nature.com/reprints.
Publisher’s note Springer Nature remains neutral with regard to jurisdictional claims in published maps and
institutional affiliations.
Open Access This article is licensed under a Creative Commons Attribution 4.0 International
License, which permits use, sharing, adaptation, distribution and reproduction in any medium or
format, as long as you give appropriate credit to the original author(s) and the source, provide a link to the
Creative Commons licence, and indicate if changes were made. The images or other third party material in this
article are included in the article’s Creative Commons licence, unless indicated otherwise in a credit line to the
material. If material is not included in the article’s Creative Commons licence and your intended use is not
permitted by statutory regulation or exceeds the permitted use, you will need to obtain permission directly from
the copyright holder. To view a copy of this licence, visit http://creativecommons.org/licenses/by/4.0/.
© The Author(s) 2021
Scientific Reports | (2021) 11:6908 | https://doi.org/10.1038/s41598-021-85608-5 13
Vol.:(0123456789)You can also read