What is Twitter, a Social Network or a News Media?
←
→
Page content transcription
If your browser does not render page correctly, please read the page content below

What is Twitter, a Social Network or a News Media?

                         Haewoon Kwak, Changhyun Lee, Hosung Park, and Sue Moon
                                               Department of Computer Science, KAIST
                                             335 Gwahangno, Yuseong-gu, Daejeon, Korea
                          {haewoon, chlee, hosung}@an.kaist.ac.kr, sbmoon@kaist.edu

ABSTRACT                                                                    1.    INTRODUCTION
Twitter, a microblogging service less than three years old, com-               Twitter, a microblogging service, has emerged as a new medium
mands more than 41 million users as of July 2009 and is growing             in spotlight through recent happenings, such as an American stu-
fast. Twitter users tweet about any topic within the 140-character          dent jailed in Egypt and the US Airways plane crash on the Hudson
limit and follow others to receive their tweets. The goal of this           river. Twitter users follow others or are followed. Unlike on most
paper is to study the topological characteristics of Twitter and its        online social networking sites, such as Facebook or MySpace, the
power as a new medium of information sharing.                               relationship of following and being followed requires no reciproca-
   We have crawled the entire Twitter site and obtained 41.7 million        tion. A user can follow any other user, and the user being followed
user profiles, 1.47 billion social relations, 4, 262 trending topics,       need not follow back. Being a follower on Twitter means that the
and 106 million tweets. In its follower-following topology analysis         user receives all the messages (called tweets) from those the user
we have found a non-power-law follower distribution, a short effec-         follows. Common practice of responding to a tweet has evolved
tive diameter, and low reciprocity, which all mark a deviation from         into well-defined markup culture: RT stands for retweet, ’@’ fol-
known characteristics of human social networks [28]. In order to            lowed by a user identifier address the user, and ’#’ followed by a
identify influentials on Twitter, we have ranked users by the number        word represents a hashtag. This well-defined markup vocabulary
of followers and by PageRank and found two rankings to be sim-              combined with a strict limit of 140 characters per posting conve-
ilar. Ranking by retweets differs from the previous two rankings,           niences users with brevity in expression. The retweet mechanism
indicating a gap in influence inferred from the number of followers         empowers users to spread information of their choice beyond the
and that from the popularity of one’s tweets. We have analyzed the          reach of the original tweet’s followers.
tweets of top trending topics and reported on their temporal behav-            How are people connected on Twitter? Who are the most influ-
ior and user participation. We have classified the trending topics          ential people? What do people talk about? How does information
based on the active period and the tweets and show that the ma-             diffuse via retweet? The goal of this work is to study the topolog-
jority (over 85%) of topics are headline news or persistent news in         ical characteristics of Twitter and its power as a new medium of
nature. A closer look at retweets reveals that any retweeted tweet          information sharing. We have crawled 41.7 million user profiles,
is to reach an average of 1, 000 users no matter what the number            1.47 billion social relations, and 106 million tweets1 . We begin
of followers is of the original tweet. Once retweeted, a tweet gets         with the network analysis and study the distributions of followers
retweeted almost instantly on next hops, signifying fast diffusion          and followings, the relation between followers and tweets, reci-
of information after the 1st retweet.                                       procity, degrees of separation, and homophily. Next we rank users
   To the best of our knowledge this work is the first quantitative         by the number of followers, PageRank, and the number of retweets
study on the entire Twittersphere and information diffusion on it.          and present quantitative comparison among them. The ranking by
                                                                            retweets pushes those with fewer than a million followers on top
                                                                            of those with more than a million followers. Through our trending
                                                                            topic analysis we show what categories trending topics are classi-
Categories and Subject Descriptors                                          fied into, how long they last, and how many users participate. Fi-
J.4 [Computer Applications]: Social and behavioral sciences                 nally, we study the information diffusion by retweet. We construct
                                                                            retweet trees and examine their temporal and spatial characteris-
                                                                            tics. To the best of our knowledge this work is the first quantitative
General Terms                                                               study on the entire Twittersphere and information diffusion on it.
                                                                               This paper is organized as follows. Section 2 describes our data
Human Factors, Measurement
                                                                            crawling methodology on Twitter’s user profile, trending topics,
                                                                            and tweet messages. We conduct basic topological analysis of the
                                                                            Twitter network in Section 3. In Section 4 we apply the PageRank
Keywords                                                                    algorithm on the Twitter network and compare its outcome against
Twitter, Online social network, Reciprocity, Homophily, Degree of           ranking by retweets. In Section 5 we study how their popularity
separation, Retweet, Information diffusion, Influential, PageRank           rises and falls among users over time. In Section 6 we focus in-
                                                                            formation diffusion through retweet trees. Section 7 covers related
Copyright is held by the International World Wide Web Conference Com-       work and puts our work in perspective. In Section 8 we conclude.
mittee (IW3C2). Distribution of these papers is limited to classroom use,
                                                                            1
and personal use by others.                                                   We make our dataset publicly available online at:
WWW 2010, April 26–30, 2010, Raleigh, North Carolina, USA.                  http://an.kaist.ac.kr/traces/WWW2010.html
ACM 978-1-60558-799-8/10/04.
2.    TWITTER SPACE CRAWL                                                2.2    Removing Spam Tweets
   Twitter offers an Application Programming Interface (API) that           Spam tweets have increased in Twitter as the popularity of Twit-
is easy to crawl and collect data. We crawled and collected pro-         ter grows as reported in [35]. As spam web page farms under-
files of all users on Twitter starting on June 6th and lasting until     mine the accuracy of PageRank and spam keywords inserted in web
June 31st, 2009. Additionally, we collected profiles of users who        pages hinder relevant web page extraction, spam tweets add noise
mentioned trending topics until September 24th, 2009. On top of          and bias in our analysis. The Twitter Support Team suspends any
user profiles we also collected popular topics on Twitter and tweets     user reported to be a spammer. Still unreported spam tweets can
related to them. Below we describe in detail how we collected user       creep into our data. In order to remove spam tweets, we employ the
profiles, popular topics, and related tweets.                            well-known mechanism of the FireFox add-on, Clean Tweets [6].
                                                                         Clean Tweets filters tweets from users who have been on Twitter for
                                                                         less than a day when presenting Twitter search results to FireFox. It
2.1    Data Collection                                                   also removes those tweets that contain three or more trending top-
                                                                         ics. We use the same mechanisms in removing spam tweets from
User Profile                                                             our data.
   A Twitter user keeps a brief profile about oneself. The public           Before we set the threshold of the trending topics to 3 in our
profile includes the full name, the location, a web page, a short bi-    spam filtering, we vary the number from 3 to 10 and see the change
ography, and the number of tweets of the user. The people who fol-       in the number of identified spam tweets. As we decrease the thresh-
low the user and those that the user follows are also listed. In order   old from 10 to 8, 5, and 3, an order of magnitude more tweets are
to collect user profiles, we began with Perez Hilton who has over        categorized as spam each time and removed. A tweet is limited to
one million followers and crawled breadth-first along the direction      140 characters and most references to other web pages are abbre-
of followers and followings. Twitter rate-limits 20, 000 requests        viated via URL shortening services (e.g., http://www.tiny.cc/ and
per hour per whitelisted IP. Using 20 machines with different IPs        http://bit.ly) so that readers could not guess where the references
and self-regulating collection rate at 10, 000 requests per hour, we     point at. This is an appealing feature to spammers and spammers
collected user profiles from July 6th to July 31st, 2009. To crawl       add as many trending topics as possible to appear in top results
users not connected to the Giant Connected Component of the Twit-        for any search in Twitter. There are 20, 217, 061 tweets with more
ter network, we additionally collected profiles of those who refer to    than 3 trending topics and 1, 966, 461 unique users are responsible
trending topics in their tweets from June to August. The final tally     for those tweets. For the rest of the paper we remove those tweets
of user profiles we collected is 41.7 million. There exist 1.47 bil-     from collected tweets. The final number of collected tweets is 106
lion directed relations of following and being followed.                 millions.
Trending Topics
   Twitter tracks phrases, words, and hashtags that are most often       3.    ON TWITTERERS’ TRAIL
mentioned and posts them under the title of "trending topics" regu-         We begin our analysis of Twitter space with the following ques-
larly. A hashtag is a convention among Twitter users to create and       tion: How the directed relationship in Twitter impacts the topologi-
follow a thread of discussion by prefixing a word with a ‘#’ char-       cal characteristics? Numerous social networks have been analyzed
acter. The social bookmarking site Del.icio.us also uses the same        and compared against each other. Before we delve into the eccen-
hashtag convention.                                                      tricities and peculiarities of Twitter, we run a batch of well-known
   Twitter shows a list of top ten trending topics of the moment on a    analysis and present the summary.
right sidebar on every user’s homepage by default, unless set other-
wise. Twitter does not group similar trending topics and, when           3.1    Basic Analysis
Michael Jackson died, most of the top ten trending topics were
about him: Michael Jackson, MJ, King of Pop, etc. Although the
exact mechanism of how Twitter mines the top ten trending topics
is not known, we believe the trending topics are a good represen-
tation, if not complete, of issues that draw most attention and have
decided to crawl them. We collected the top ten trending topics ev-
ery five minutes via Twitter Search API [36]. The API returns the
trending topic title, a query string, and the time of the API request.
We used the query string to grab all the tweets that mention the
trending topic. In total we have collected 4, 262 unique trending
topics and their tweets.
   Once any phrase, word, or hashtag appears as a top trending
topic, we follow it for seven more days after it is taken off the top
ten trending topics’ list.
                                                                                  Figure 1: Number of followings and followers
Tweets
   On top of trending topics, we collected all the tweets that men-
tioned the trending topics. The Twitter Search API returns a max-           We construct a directed network based on the following and fol-
imum number of 1, 500 tweets per query. We downloaded the                lowed and analyze its basic characteristics. Figure 1 displays the
tweets of a trending topic at every 5 minute interval. That is, we       distribution of the number of followings as the solid line and that of
captured at most 5 tweets per second. We collected the full text,        followers as the dotted line. The y-axis represents complementary
the author, the written time, the ISO standard language code of a        cumulative distribution function (CCDF). We first explain the dis-
tweet, as well as the receiver, if the tweet is a reply, and the third   tribution of the number of followings. There are noticeable glitches
party application, such as Tweetie.                                      in the solid line. The first occurs at x = 20. Twitter recommends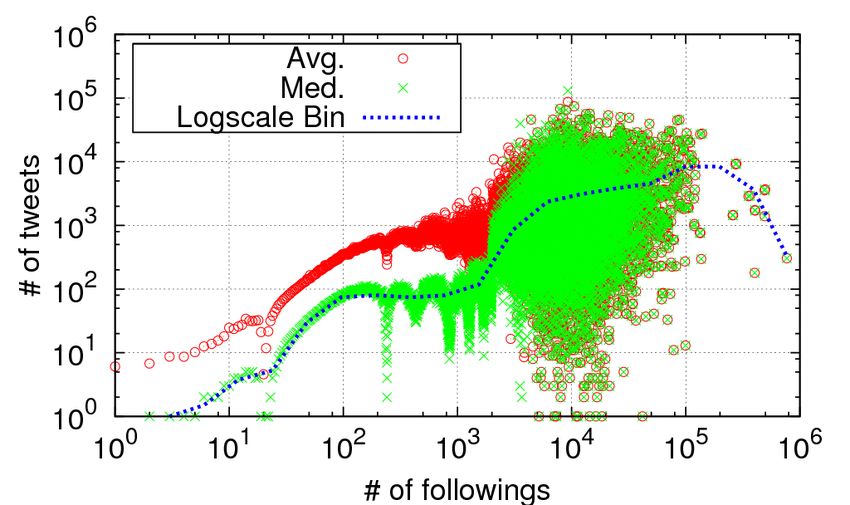
an initial set of 20 people a newcomer can follow by a single click
and quite a few people take up on the offer. The second glitch is
at around x = 2000. Before 2009 there was an upper limit on the
number of people a user could follow [12]. Twitter removed this
cap and there is no limit now. The glitch represents the gap in the
momentum of network building inflicted by the upper limit. A very
small number of users follow more than 10, 000. They are mostly
official pages of politicians and celebrities who need to offer some
form of customer service.
   The dashed line in Figure 1 up to x = 105 fits to a power-law
distribution with the exponent of 2.276. Most real networks includ-
ing social networks have a power-law exponent between 2 and 3.
The data points beyond x = 105 represent users who have many            Figure 3: The number of followings and that of tweets per user
more followers than the power-law distribution predicts. Similar
tail behavior in degree distribution has been reported from Cyworld
in [1] but not from other social networks. The common character-
istics between Twitter and Cyworld are that many celebrities are        line shows a positive trend, while the line is flat between 100 and
present and they readily form online relations with their fans.         1, 000. As in Figure 2 the number of tweets increases by an order
   There are only 40 users with more than a million followers and       of magnitude as the number of followings goes over 5, 000.
all of them are either celebrities (e.g. Ashton Kutcher, Britney           Figures 2 and 3 demonstrate that the median number of tweets
Spears) or mass media (e.g. the Ellen DeGeneres Show, CNN               increases up to x = 10 against both the numbers of followers and
Breaking News, the New York Times, the Onion, NPR Politics,             followings and remains relatively flat up till x = 100. Then beyond
TIME). The top 20 are listed in Figure 7. Some of them follow their     x = 5, 000 the number of tweets increases by an order of magni-
followers, but most of them do not (the median number of follow-        tude or more. Our numbers do not state causation of the peer pres-
ings of the top 40 users is 114, three orders of magnitude smaller      sure, but only state the correlation between the numbers of tweets
than the number of followers). We revisit the issue of reciprocity in   and followers.
Section 3.3.
                                                                        3.3    Reciprocity
3.2    Followers vs. Tweets                                                In Section 3.1 we briefly mention that top users by the number
                                                                        of followers in Twitter are mostly celebrities and mass media and
                                                                        most of them do not follow their followers back. In fact Twitter
                                                                        shows a low level of reciprocity; 77.9% of user pairs with any link
                                                                        between them are connected one-way, and only 22.1% have recip-
                                                                        rocal relationship between them. We call those r-friends of a user as
                                                                        they reciprocate a user’s following. Previous studies have reported
                                                                        much higher reciprocity on other social networking services: 68%
                                                                        on Flickr [4] and 84% on Yahoo! 360 [18].
                                                                           Moreover, 67.6% of users are not followed by any of their fol-
                                                                        lowings in Twitter. We conjecture that for these users Twitter is
                                                                        rather a source of information than a social networking site. Fur-
                                                                        ther validation is out of the scope of this paper and we leave it for
                                                                        future work.
Figure 2: The number of followers and that of tweets per user           3.4    Degree of Separation

   In order to gauge the correlation between the number of follow-
ers and that of written tweets, we plot the number of tweets (y)
against the number of followers a user has (x) in Figure 2. We bin
the number of followers in logscale and plot the median per bin in
the dashed line. The majority of users who have fewer than 10 fol-
lowers never tweeted or did just once and thus the median stays at 1.
The average number of tweets against the number of followers per
user is always above the median, indicating that there are outliers
who tweet far more than expected from the number of followers.
The median number of tweets stays relatively flat in x = 100 to
1, 000, and grows by an order of magnitude for x > 5, 000.
   We gauge the inclination to be active by the number of people                         Figure 4: Degree of separation
a user follows and plots in Figure 3. As pointed out in Figure 1
irregularities at x = 20 and x = 2000 are observed. Yet the graph
plunges at a few more points, x = 250, 500, 2000, 5000. We con-           The concept of degrees of separation has become a key to un-
jecture that they are spam accounts, as many of them have disap-        derstanding the societal structure, ever since Stanley Milgram’s fa-
peared as of October 2009. We also bin the number of followers in       mous ‘six degrees of separation’ experiment [27]. In his work he
logscale and plot the median per bin in the dashed line. The dashed     reports that any two people could be connected on average within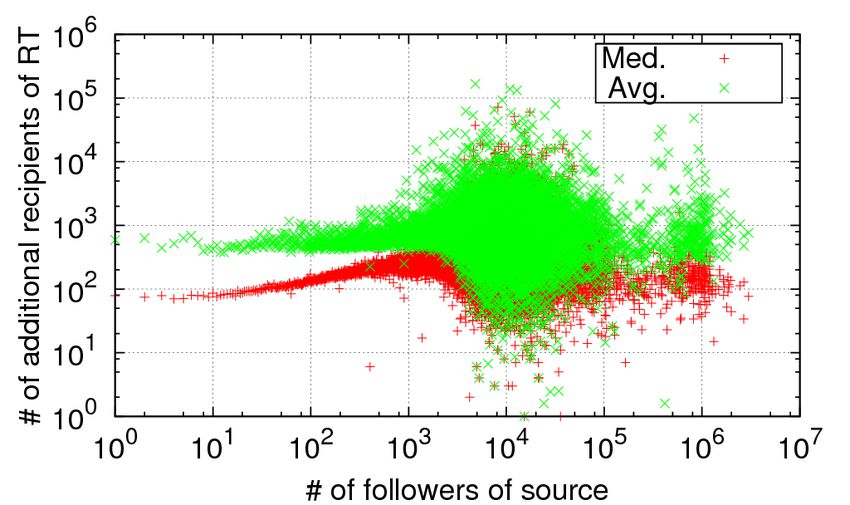
six hops from each other. Watts and Strogatz have found that many
social and technological networks have small path lengths [37] and
call them a ‘small-world’. Recently, Leskovec and Horvitz report
on the MSN messenger network of 180 million users that the me-
dian and the 90% degrees of separation are 6. and 7.8, respec-
tively[22].
   The main difference between the above networks and Twitter is
the directed nature of Twitter relationship. In MSN a link represents
a mutual agreement of a relationship, while on Twitter a user is not
obligated to reciprocate followers by following them. Thus a path
from a user to another may follow different hops or not exist in the
reverse direction.
   As only 22.1% of user pairs are reciprocal, we expect the aver-       Figure 5: The average time differences between a user and r-
age path length between two users in Twitter to be longer than other     friends
known networks. To estimate the path-length distribution we use
the same random sampling approach as in [1]. We choose a seed
at random and obtain the distribution of shortest paths between the
seed and the rest of the network by breadth-first search. Figure 4 ex-   This can be interpreted as a large following in another continent.
hibits the distributions of the shortest paths in Twitter with 1, 000,   We conclude that Twitter users who have reciprocal relations of
3, 000 and 8, 000 seeds. All three distributions overlap almost com-     fewer than 2, 000 are likely to be geographically close.
pletely, showing that the sample size of 8, 000 is large enough. The
median and the mode of the distribution are both 4, and the aver-
age path length is 4.12. The 90th percentile distance, known as the
effective diameter [23], is 4.8. For 70.5% of node pairs, the path
length is 4 or shorter, and for 97.6% it is 6 or shorter. There are
1.8% users who have no incoming edge, and the longest path in
our samples is 18.
   The average path length of 4.12 is quite short for the network of
Twitter size, and is the opposite of our expectation on a directed
graph. This is an interesting phenomenon that may bespeak for the
Twitter’s role other than social networking. People follow others
not only for social networking, but for information, as the act of
following represents the desire to receives all tweets by the person.
We note that information is to flow over less than 5 or fewer hops
between 93.5% of user pairs, if it is to, taking fewer hops than on      Figure 6: The average number of followers of r-friends per user
other known social networks.

3.5    Homophily
                                                                            Next, we consider the number of followers of a user as an indi-
   Homophily is a tendency that “a contact between similar people        cator of the user’s popularity. Then we ask "Does a user of certain
occurs at a higher rate than among dissimilar people” [26]. Weng et      popularity follow other users of similar popularity and they recip-
al. have reported that two users who follow reciprocally share top-      rocate?" This question is similar to degree correlation. The degree
ical interests by mining their 50 thousands links [38]. Here we in-      correlation compares a node’s degree against those of its neighbors,
vestigate homophily in two contexts: geographic location and pop-        and tells whether a hub is likely to connect other hubs rather than
ularity. Twitter users self-report their location. It is hard to parse   low-degree nodes in an undirected network. The positive trend in
location due to its free form. Instead, we consider the time zone        degree correlation is called assortativity and is known as one of the
of a user as an approximate indicator for the location of the user.      characteristic features of human social networks [28]. However, it
A user chooses one of the 24 time zones around the world 2 . We          is feasible only in undirected graphs and does not apply to Twitter.
drop those users without time zone information in this evaluation.          Figure 6 plots the mean of average numbers of followers of r-
We calculate the time differences between a user and r-friends and       friends against the number of followers. We see positive correlation
compute the average. We plot the median time different versus the        slightly below x = 1, 000 and dispersion beyond that point.
number of r-friends in Figure 5.                                            In this section we have looked into homophily from two perspec-
   We observe that the median time difference between a user and         tives: geographic location and the number of r-friends’ followers.
r-friends slowly increases as the number of r-friends increases and      We observe that users with followers 1, 000 or less are likely to be
disperses beyond x = 2, 000. For those users with 2, 000 r-friends       geographically close to their r-friends and also have similar popu-
or fewer, the median time differences of the user and r-friends stays    larity with their r-friends. Here we have not included the unrecip-
below 3 hours. For those with 50 or fewer r-friends, the mean time       rocated directed links and focused on r-friends. In a way we looked
difference is only about 1.07 hours. For 75% of users the time           at the social networking aspect of Twitter and found some level of
difference is 3.00 hours or less. For some users who have more than      homophily.
5, 000 r-friends, the average time difference is more than 6 hours.         In summary Twitter diverges from well-known traits of social
2
  We are aware of a campaign to urge users to alter their time zones     networks: its distribution of followers is not power-law, the degree
during the Iranian election in June 2009 [31]. However, we have          of separation is shorter than expected, and most links are not re-
no means to verify the true time zone of a user and use our data as      ciprocated. But if we look at reciprocated relationships, then they
is.                                                                      exhibit some level of homophily.
Figure 7: Top 20 users ranked by the number of followers, PageRank in the follower network, and the number of retweets
4. RANKING TWITTER USERS these media think that tweets of these media are worth propagat-
The popularity of a Twitter user can be easily estimated by the ing. Quality, timeliness, and coverage of reporting are all candidate
number of followers. The top 20 users by the number of follow- factors that we leave for future investigation. A few users, oxford-
ers are listed in Figure 7. We call them List #1. All are either girl, Pete Cashmore, and Michael Arrington, can be categorized as
celebrities (actors, musicians, politicians, show hosts, and sports independent news media based on online distribution. Ranking by
stars) or news media. However, the number of followers alone the retweets shows the rise of alternative media in Twitter.
does not reflect the influence a user exerts when the user’s tweet
is retweeted many times or is simply followed by other influential
4.3 Comparison among Rankings
people: it is not a comprehensive measure. This problem of ranking
nodes based on the topological dependence in a network is similar
to ranking web pages based on its connectivity. Google uses the
PageRank algorithm to rank web pages in their search results [29].
The key idea behind PageRank is to allow propagation of influence
along the network of web pages, instead of just counting the num-
ber of other web pages pointing at the web page. In this section we
rank users by the PageRank algorithm and also by the number of
retweets and compare the outcome.
4.1 By PageRank
We first apply PageRank to the network of followings and fol-
lowers. In this network a node maps to a user, and every directed
edge maps to a user following another. Top 20 ranked users are
shown in Figure 7. Let us name this List #2. This top 20 list has Figure 8: Comparison among rankings
the same users as List #1 except for Perez Hilton and Stephen Fry.
Al Gore and The Onion are dropped from List #1 and some have In this section we present a quantitative comparison between
changed ranks. Although the two lists do not match exactly, users the three rankings. We compare the three rankings by the number
are ranked similarly by the number of followers and PageRank. of followers (RF ), PageRank (RP R ) and the number of retweets
(RRT ) in terms of Fagin et al.’s generalized Kendall’s tau [8].
4.2 By the Retweets Kendall’s tau is a measure of rank correlation [16], but original
The number of retweets for a certain tweet is a measure of the Kendall’s tau has the limitation that rankings in consideration must
tweet’s popularity and in turn of the tweet writer’s popularity. Here have the same elements. Fagin et al. overcome the limitation by
we rank users by the total number of retweets. The rightmost col- comparing only top k lists and adding a penalty parameter, p. We
(p)
umn in Figure 7 lists the top 20 users by the number of retweets. use the “optimistic approach” of Kendall’s tau Kτ with penalty
Only 4 out of 20 users are common in all three rankings. The rank- p = 0 considering two rankings as R1 and R2 .
ing by the retweets only has one additional user (Perez Hilton) that
is common with the PageRank list. The rest are not in either of the X
Kτ(0) (R1 , R2 ) = K̄r1 ,r2 (R1 , R2 ) (1)
first two rankings. A closer look at the users reveals that 4 users
r1,r2∈R1 ∪R2
rose to fame due to active tweeting during and after the Iran elec-
tion on June 12th, 2009. There are mainstream news media that rise where K̄r1 ,r2 (R1 , R2 ) = 1, if (i) r1 is only in one list and r2 is
in ranking by the retweets: The Breaking News Wire, ESPN Sports in the other list; (ii) r1 is ranked higher than r2 in one list and only
News, the Huffington Post, and NPR News. It is hard to interpret r2 appears in the other list; or (iii) r1 and r2 are in both lists but in
their rise in retweet ranking, but their rise speaks that followers of the opposite order. Otherwise, K̄r1 ,r2 (R1 , R2 ) = 0. We use thenormalized distance, K, computed as below [25].
(0)
Kτ (R1 , R2 )
K =1− (2)
k2
where k is the number of elements in each ranking. The range of K
is from 0 to 1. K = 0 means complete disagreement, and K = 1
means complete agreement.
We plot K for three pairs of rankings varying k from 20 to 2, 000
in Figure 8. We note that RF -RP R pair has high K over 0.6 but (a) Google (b) Twitter
both RF -RRT and RP R -RRT pairs have low K under 0.4. This
means that RF and RP R are similar, but RRT is different. RRT Figure 9: The age of the trending topics from Google and Twit-
indicates a gap between the number of followers and the popularity ter
of one’s tweets and brings a new perspective in influence in Twitter.
5. TRENDING THE TRENDS subset of trending topics that we have matched against CNN Head-
line News more than half the time CNN was ahead in reporting.
In Section 3 we have looked at the topological characteristics of However, some news broke out on Twitter before CNN and they
the Twitter network and learned of low reciprocity in Twitter. If we are of live broadcasting nature (e.g., sports matches and accidents).
interpret the act of following as subscribing to tweets, then Twitter Our preliminary results confirms the role of Twitter as a media for
serves more as an information spreading medium than an online breaking news in a manner close to omnipresent CCTV for collec-
social networking service. Then what information does spread on tive intelligence.
Twitter? In this section we examine what topics become trending
topics and how trending topics rise in popularity, spread through 5.2 Singleton, Reply, Mention, and Retweet
the followers’ network, and eventually die. A tweet can be just a statement made by a user, or could be a
As described in Section 2.1, we obtain 4, 266 unique trending reply to another tweet. Or a retweet, which refers to a common
topics from June 3rd to September 25th, 2009. This period in- practice in Twitter to copy someone else’s tweet as one’s own,
cludes big events such as Apple’s Worldwide Developers Confer- sometimes with additional comments. Retweets are marked with
ence, the E3 Expo, NBA Finals, and the Miss Universe Pageant; either “RT” followed by ‘@user id’ or “via @user id”. Retweet
tragic events of Michael Jackson’s death and the Air France Flight is considered the feature that has made Twitter a new medium of
447 plunge; the Iran election; theatre release of Harry Potter and the information dissemination. People often write a tweet addressing
Half-Blood Prince; global product releases of iPhone 3GS, Snow a specific user. We call such a tweet a mention. Both replies and
Leopard, Zune HD, etc. There are also some hashtags (e.g., #what- mentions include ‘@’ followed by the addressed user’s Twitter id.
everhappened and #thingsihate) that represent Twitter-only trends. If a tweet has no reply or a retweet, then we call it a singleton.
5.1 Comparison with Trends in Other Media
To answer what topics are popular in Twitter, we compare Twit-
ter’s trending topics with those in other media, namely, Google
Trend and CNN headlines. Google search is the most popular ser-
vice people use to search for information in today’s Internet. The
search keywords represent topics users are interested in and popular
keywords represent hot trends, although the detailed mechanism of
Google Trend is unknown. Search keywords have become a good
indicator to understand activities in the real world [9].
We have collected top 40 search keywords per day from Google
Trend during the same period as our Twitter data collection. We
have also extracted top 40 trending topics per day on Twitter. We
first compare the Google keywords to the trending topics in Twitter.
We consider a search keyword and a trending topic a match if the
length of the longest common substring is more than 70% of either
string. Only 126 (3.6%) out of 3, 479 unique trending topics from
Twitter exist in 4, 597 unique hot keywords from Google. Most of
them are real world events, celebrities, and movies (e.g., mlb draft,
tsunami, michael jackson, and terminator)
We also compare the freshness of topics in Google Trend and
Twitter trending topics. In Figure 9 we plot how many topics are
fresh, a day old, a week old, or longer. On average 95% of topics Figure 10: Topics ranked by RT proportion (# of users >
each day are new in Google while only 72% of topics are new in 50,000)
Twitter. Interactions among users, e.g., retweet, reply, and mention,
are prevalent in Twitter unlike Google search, and such interactions
might be a factor to keep trending topics persist. Among all tweets mentioning 4, 266 unique trending topics, sin-
How close are trending topics to CNN Headline News in time gletons are most common, followed by replies and retweets. Men-
and coverage? We collected CNN Headline News of our Twitter tions are least common in tweets. However, the proportions of sin-
data collection period and conducted preliminary analysis. From a gletons, replies, mentions, and retweets vary greatly depending onthe topic. In Figure 10 we list the top 20 topics ranked by the pro-
portion of retweets. All but two topics are about offline news, and
the remaining two are about a campaign (‘remembering 9’) and, we
suspect, a bug (‘rt &’) of Twitter in extracting frequent words from
retweets.
5.3 User Participation in Trending Topics
How many topics does a user participate on average? Out of 41
million Twitter users, a large number of users (8, 262, 545) partici-
pated in trending topics and about 15% of those users participated (a) Exogenous subcritical (b) Exogenous critical
in more than 10 topics during four months. (topic ‘#backintheday’) (topic ‘beyonce’)
(c) Endogenous subcritical (d) Endogenous critical
(topic ‘lynn harris’) (topic ‘#redsox’)
(a) Topic ’apple’ (b) Topic ’#iranelection’
Figure 11: Cumulative numbers of tweets and users over time Figure 13: The examples of classified popularity patterns
Long-lasting topics with an increasing number of tweets do not
always bring in new users into the discussion. In Figure 11 the two present a model that categorizes the response function in a social
topics ’apple’ and ’#iranelection’ have similar numbers of tweets, system [7]. Their model takes into consideration whether the factor
but the number of user participating in ’apple’ is five times larger behind an event is endogenous or exogenous and whether a user
than that of ’#iranelection’. Moreover, the pace at which new users can spread the news about the event to others or not (critical or
write on the topic ’#iranelection’ slows down after the first 20 days. subcritical). They evaluate their model using 5 million videos of
We find that there exist core members generating many tweets over YouTube and label videos as viral, quality, and junk solely based on
a long time period for that particular trending topic. the quantitative analysis of the number of views and time. Just as on
5.4 Active Period of Trends YouTube, there are endogenous and exogenous factors that push a
topic to the top trending topic list and the spread of the topic follows
an epidemic cascade through the network of followers. We apply
their classification methodology on the number of tweets and their
times, and classify trending topic periods into the following four
categories: exogenous subcritical, exogenous critical, endogenous
subcritical, and endogenous subcritical. Sample topics from each
category are shown in Figure 13. We confirm that each category
has its unique popularity pattern.
Manual inspection of the topics that fall into the exogenous crit-
ical class reveal that they are mostly timely breaking news, which
(a) # of active periods / topic (b) Duration of active period we refer as headline news. The topics in the endogenous critical
class are of more lasting nature: professional sports teams, cities,
Figure 12: Cumulative fraction and brands. We label them as persistent news. Those exogenous
subcritical topics have hashtags, such as #thoughtsintheclub and
#thingsihate, catching a limited subset of users’ attention and even-
A trending topic does not last forever nor dies to never come tually dying out. We call them ephemeral.
back. If we consider a trending topic inactive if there is no tweet
on the topic for 24 hours, then we have 6, 058 active periods from
4, 266 trending topics. In Figure 12 we plot the CDF of the active Subcritical Critical
periods and find that 73% topics have a single active period. About Exo. 31.5% (1,905) 54.3% (3,290)
15% of topics have 2 active periods and 5% have 3. Very few have Endo. 6.9% (419) 7.3% (444)
more than 3 active periods.
Most of the active periods are a week or shorter. In Figure 12 we Table 1: # of topics in each category
see that 31% of periods are 1 day long, and only 7% of periods are
longer than 10 days. There are, however, a few long-lasted topics
that have been active for more than two months. The longest lasted The numbers and percentage of active periods in each class are
for 76 days, and the corresponding topic was ’big brother.’ shown in Table 1. The largest number falls into the exogenous
How many tweets does a topic attract at the beginning, in the critical class. We claim that Twitter users tend to talk about topics
middle and near the end of the topic duration? Crane and Sornette from headline news and respond to fresh news.6. IMPACT OF RETWEET We have seen how trending topics rise in popularity and eventu- ally die in Section 5. Then how exactly does information spread on Twitter? Retweet is an effective means to relay the information be- yond adjacent neighbors. We dig into the retweet trees constructed per trending topic and examine key factors that impact the eventual spread of information. 6.1 Audience Size of Retweet Figure 14: Average and median numbers of additional recipi- ents of the tweet via retweeting People subscribe to mass media in various forms: radio, TV, and newspapers. They are immediate recipients and consumers of the news the established media produce. On Twitter people acquire information not always directly from those they follow, but often via retweets. Assuming a tweet posted by a user is viewed and consumed by all of the user’s followers, we count the number of additional recipients who are not immediate followers of the orig- inal tweet owner. Figure 14 displays its average and median per tweet against the number of followers of the original tweet user. The median lies almost always below the average, indicating that many tweets have a very large number of additional recipients. Up to about 1, 000 followers, the average number of additional recipi- ents is not affected by the number of followers of the tweet source. That is, no matter how many followers a user has, the tweet is likely to reach a certain number of audience, once the user’s tweet starts Figure 15: Retweet trees of ‘air france flight’ tweets spreading via retweets. This illustrates the power of retweeting. That is, the mechanism of retweet has given every user the power to spread information broadly. We recall that influentials by the number of retweets are dissimilar with those by the number of fol- lowers or PageRank. Individual users have the power to dictate which information is important and should spread by the form of retweet, which collectively determines the importance of the origi- nal tweet. In a way we are witnessing the emergence of collective intelligence. 6.2 Retweet Trees Knowing that retweet actually delivers information to far more people than a source’s immediate followers, we are now interested in how far and deep retweets travel in Twitter. In order to answer the question we build an information diffusion tree of every tweet Figure 16: Height and participating users in retweet trees that is retweeted and call it a retweet tree. All retweet trees are subgraphs of the Twitter network. We illustrate all the retweet trees of the topic ‘air france flight’ in Figure 15. In every connected component different colors represent retweeting the same tweet, and cross-retweet is retweeting each different tweets. The forest of retweet trees has a large number of other. one or two-hop chains. We find interesting retweet patterns such In Figure 16 we plot the CCDFs of the retweet tree heights and as repetitive retweet and cross-retweet; the former is repeatedly the number of users in a retweet tree. The height of 1 is the most
common claiming 95.8%. As 97.6% of node pairs have less than              For each user i we define |rij | as the number of retweets from
6 degrees of separation, all retweet trees but for a handful have       user j. The Y (k, i) is defined as follows:
a height smaller than 6, and no tree goes beyond 11 hops. The
                                                                                                                                )2
distribution of the users in a retweet tree follows power-law. This                                     k
                                                                                                              (
                                                                                                        X           |rij |
retweet tree analysis demonstrates how retweets spread and how                            Y (k, i) =              Pk                           (3)
many get involved.                                                                                      j=1        l=1 |ril |

6.3    Temporal Analysis of Retweet                                        Y (k) represents Y (k, i) averaged over all nodes that have k out-
                                                                        going (incoming) edges. Here an edge represents a retweet. When
   We have seen in Section 6.2 that most retweet trees have a height    retweeting occurs evenly among followers, then kY (k) ∼ 1. If
of one, but retweets reach a good number of people no matter how        most of retweeting occurs within a subset of followers, then kY (k)
many followers the tweet source has. Here we investigate how soon       ∼ k. For outgoing links, similar interpretation applies. Both Fig-
retweets appear and how long they last. Figure 17 plots the time        ures 19(a) and 19(b) shows a linear correlation up to 1, 000 follow-
lag from a tweet to its retweet. Half of retweeting occurs within an    ers. The linear correlation to k represents favoritism in retweets:
hour, and 75% under a day. However about 10% of retweets take           people only retweets from a small number of people and only a
place a month later,                                                    subset of a user’s followers actually retweet. Chun et al. also re-
                                                                        port that favoritism exists in conversation from guestbook logs of
                                                                        Cyworld, the biggest social networks in Korea [5].

                                                                             (a) kout Y(kout ) ∼ kout                  (b) kin Y(kin ) ∼ kin
 Figure 17: Time lag between a retweet and the original tweet

                                                                                      Figure 19: Disparity in retweet trees
   In Figure 18 we plot the time lag between two nodes on a retweet
tree. As most retweet trees are one-hop deep, the time lag on the
first hop is spread out, with the median at just under 1 hour and the   7.    RELATED WORK
inter-quartile range expanding from a few minutes to more than a           Online social networks and social media
day. What is interesting is from the second hop and on is that the         The rising popularity of online social networking services has
retweets two hops or more away from the source are much more            spurred research into their characteristics and recent work has for-
responsive and basically occur back to back up to 5 hops away.          ayed into characteristics beyond crawled data [3, 39].
Cha et al. reports that favorite photos diffuse in the order of days       Twitter is less than three years old, but has attracted much atten-
in Flickr [4]. The strength of Twitter as a medium for information      tion in the past two years. Java et al. conduct preliminary analysis
diffusion stands out by the speed of retweets.                          of Twitter in 2007 [14]. Their dataset covers about 76, 000 users
                                                                        and 1, 000, 000 posts. They find user clusters based on user in-
                                                                        tention to topics by clique percolation methods. Krishnamurthy et
                                                                        al. also analyze the user characteristics by the relationships be-
                                                                        tween the number of followers and that of followings [17]. Zhao
                                                                        and Rosson qualitatively investigate the motivation of using Twit-
                                                                        ter [40]. Huberman et al. reports that the number of friends is
                                                                        actually smaller than the number of followers or followings [11].
                                                                        Jansen conducts preliminary analysis of word-of-mouth branding
                                                                        in Twitter [13]. Our work marks the first to look at the entire Twit-
                                                                        tersphere.
                                                                           Information cascades
                                                                           Information diffusion is a process that a new idea or an action
Figure 18: Elapsed time of retweet from (n − 1) hop to n hop            widely spreads through communication channels [32]. This area is
                                                                        extensively researched from sociology, marketing, and epidemiol-
                                                                        ogy [15, 19, 30, 33]. The success of online social networks opens
                                                                        a new problem of large-scale information diffusion. Topic prop-
6.4    Favoritism in Retweet                                            agation in blogspace [10], linking patterns in blog graph [21], fa-
   When a user retweets, the user may or may not retweet evenly         vorite photo marking in a social photo sharing service [4], fanning
from those whom the user follows. Also from the perspective of          in Facebook [34], Internet chain letter forwarding [24], and meme
a user who gets retweeted, the retweet may or may not take place        tracking in news cycles [20] all report on large-scale information
evenly among one’s followers. How even is the information diffu-        diffusion online. We treat retweet trees as communication channels
sion in retweet? To answer this question we investigate disparity [2]   of information diffusion and observe that retweets reach a large au-
in retweet trees.                                                       dience and spread fast.
8. CONCLUSIONS [11] B. A. Huberman, D. M. Romero, and F. Wu. Social networks that matter:
Twitter under the microscope. arXiv:0812.1045v1, Dec 2008.
We have crawled the entire Twittersphere and obtained 41.7 mil- [12] HubSpot. State of the twittersphere. http://bit.ly/sotwitter, June 2009.
lion user profiles, 1.47 billion social relations, 4, 262 trending top- [13] B. J. Jansen, M. Zhang, K. Sobel, and A. Chowdury. Micro-blogging as online
ics, and 106 million tweets. In its follower-following topology word of mouth branding. In Proc. of the 27th international conference extended
analysis we have found a non-power-law follower distribution, a abstracts on Human factors in computing systems. ACM, 2009.
[14] A. Java, X. Song, T. Finin, and B. Tseng. Why we twitter: understanding
short effective diameter, and low reciprocity, which all mark a de- microblogging usage and communities. In Proc. of the 9th WebKDD and 1st
viation from known characteristics of human social networks [28]. SNA-KDD 2007 workshop on Web mining and social network analysis. ACM,
Among reciprocated users we observe some level of homophily. In 2007.
order to identify influentials on Twitter, we have ranked users by [15] D. Kempe, J. Kleinberg, and E. Tardos. Maximizing the spread of influence
through a social network. In Proc. of the ninth ACM SIGKDD international
the number of followers and by PageRank and found two rankings conference on Knowledge discovery and data mining. ACM, 2003.
to be similar. If we rank by the number of retweets, then the ranking [16] M. Kendall. A new measure of rank correlation. Biometrika, 30(1-2):81–93,
differs from the previous two rankings, indicating a gap in influence 1938.
inferred from the number of followers and that from the popularity [17] B. Krishnamurthy, P. Gill, and M. Arlitt. A few chirps about twitter. In Proc. of
the 1st workshop on Online social networks. ACM, 2008.
of one’s tweets. Ranking by retweets exposes the influence of other [18] R. Kumar, J. Novak, and A. Tomkins. Structure and evolution of online social
media in a novel perspective. We have analyzed the tweets of top networks. In Proc. of the 12th ACM SIGKDD international conference on
trending topics and reported on the temporal behavior of trending Knowledge discovery and data mining. ACM, 2006.
topics and user participation. We then classify the trending topics [19] J. Leskovec, L. A. Adamic, and B. A. Huberman. The dynamics of viral
marketing. In Proc. of the 7th ACM conference on Electronic commerce. ACM,
based on the active period and the tweets and show that the majority 2006.
(over 85%) of topics are headline or persistent news in nature. A [20] J. Leskovec, L. Backstrom, and J. Kleinberg. Meme-tracking and the dynamics
closer look at retweets reveals that any retweeted tweet is to reach of the news cycle. In Proc. of the 15th ACM SIGKDD international conference
on Knowledge discovery and data mining. ACM, 2009.
an average of 1, 000 users no matter what the number of followers
[21] J. Leskovec and E. Horvitz. Worldwide buzz: Planetary-scale views on an
is of the original tweet. Once retweeted, a tweet gets retweeted al- instant-messaging network. Technical report, Microsoft Research, June 2007.
most instantly on the 2nd, 3rd, and 4th hops away from the source, [22] J. Leskovec and E. Horvitz. Planetary-scale views on a large instant-messaging
signifying fast diffusion of information after the 1st retweet. network. In Proc. of the 17th international conference on World Wide Web.
ACM, 2008.
Twitter with its open API to crawl, one-sided nature of relation-
[23] J. Leskovec, J. Kleinberg, and C. Faloutsos. Graphs over time: densification
ship, and the retweet mechanism to relay information offers an un- laws, shrinking diameters and possible explanations. In Proc. of the 11th ACM
precedented opportunity for computer scientists, sociologists, lin- SIGKDD international conference on Knowledge discovery in data mining.
guists, and physicists to study human behavior. Our work is the first ACM, 2005.
[24] D. Liben-Nowell and J. Kleinberg. Tracing information flow on a global scale
step towards exploring the great potentials of this new platform. using Internet chain-letter data. Proc. of the National Academy of Sciences,
105(12):4633–4638, 2008.
9. ACKNOWLEDGEMENTS [25] F. McCown and M. L. Nelson. Agreeing to disagree: search engines and their
public interfaces. In Proc. of the 7th ACM/IEEE-CS joint conference on Digital
We are grateful to Meeyoung Cha, Yong-Yeol Ahn and Young- libraries. ACM, 2007.
Ho Eom for helpful discussions. We also thank anonymous review- [26] M. McPherson, L. Smith-Lovin, and J. M. Cook. Birds of a feather: Homophily
in social networks. Annual Review of Sociology, 27(1):415–444, 2001.
ers for their valuable comments and suggestions. This work was
[27] S. Milgram. The small world problem. Psychology today, 2(1):60–67, 1967.
supported by the IT R&D program of MKE/KEIT [2008-F-016-02, [28] M. E. J. Newman and J. Park. Why social networks are different from other
“CASFI: High-Precision Measurement and Analysis Research”]. types of networks. Phys. Rev. E, 68(3):036122, Sep 2003.
[29] L. Page, S. Brin, R. Motwani, and T. Winograd. The pagerank citation ranking:
Bringing order to the web. Technical Report 1999-66, Stanford InfoLab,
10. REFERENCES November 1999.
[1] Y.-Y. Ahn, S. Han, H. Kwak, S. Moon, and H. Jeong. Analysis of topological [30] R. Pastor-Satorras and A. Vespignani. Epidemics and immunization in
characteristics of huge online social networking services. In Proc. of the 16th scale-free networks. arXiv:cond-mat/0205260v1, May 2002.
international conference on World Wide Web. ACM, 2007.
[31] E. Reinikainen. #iranelectioncyberwarguideforbeginners.
[2] E. Almaas, B. Kovács, T. Vicsek, Z. N. Oltvai, and A. L. Barabási. Global http://goo.gl/pZvi, June 2009.
organization of metabolic fluxes in the bacterium escherichia coli. Nature,
[32] E. M. Rogers. Diffusion of Innovations. Free Press, 5 edition, August 2003.
427(6977):839–843, February 2004.
[33] D. Strang and S. Soule. Diffusion in organizations and social movements: From
[3] F. Benevenut, T. Rodrigues, M. Cha, and V. Almeida. Characterizing user
hybrid corn to poison pills. Annual Review of Sociology, 24:265–290, 1998.
behavior in online social networks. In Proc. of ACM SIGCOMM Internet
Measurement Conference. ACM, 2009. [34] E. Sun, I. Rosenn, C. Marlow, and T. Lento. Gesundheit! modeling contagion
through facebook news feed. In Proc. of International AAAI Conference on
[4] M. Cha, A. Mislove, and K. P. Gummadi. A measurement-driven analysis of
Weblogs and Social Media, 2009.
information propagation in the Flickr social network. In Proc. of the 18th
international conference on World Wide Web. ACM, 2009. [35] The New York Times.
http://bits.blogs.nytimes.com/2009/07/07/spammers-shorten-their-urls/.
[5] H. Chun, H. Kwak, Y.-H. Eom, Y.-Y. Ahn, S. Moon, and H. Jeong. Comparison
of online social relations in volume vs interaction: a case study of Cyworld. In [36] Twitter Search API. http://apiwiki.twitter.com/Twitter-API-Documentation.
Proc. of the 8th ACM SIGCOMM Internet Measurement Conference. ACM, [37] D. J. Watts and S. H. Strogatz. Collective dynamics of small-world networks.
2008. Nature, 393:440–442, Jun 1998.
[6] Clean Tweets. http://blvdstatus.com/clean-tweets.html. [38] J. Weng, E.-P. Lim, J. Jiang, and Q. He. Twitterrank: finding topic-sensitive
[7] R. Crane and D. Sornette. Robust dynamic classes revealed by measuring the influential twitterers. In Proc. of the third ACM international conference on Web
response function of a social system. Proc. of the National Academy of search and data mining. ACM, 2010.
Sciences, 105(41):15649–15653, 2008. [39] C. Wilson, B. Boe, A. Sala, K. P. Puttaswamy, and B. Y. Zhao. User interactions
[8] R. Fagin, R. Kumar, and D. Sivakumar. Comparing top k lists. In Proc. of the in social networks and their implications. In Proc. of the 4th ACM European
14th annual ACM-SIAM symposium on Discrete algorithms. Society for conference on Computer systems. ACM, 2009.
Industrial and Applied Mathematics, 2003. [40] D. Zhao and M. B. Rosson. How and why people twitter: the role that
[9] Flu Trends. http://www.google.org/flutrends/. micro-blogging plays in informal communication at work. In Proceedings of the
ACM 2009 international conference on Supporting group work. ACM, 2009.
[10] D. Gruhl, R. Guha, D. Liben-Nowell, and A. Tomkins. Information diffusion
through blogspace. In Proc. of the 13th international conference on World Wide
Web. ACM, 2004.You can also read