PolemicTweet: Video Annotation and Analysis through Tagged Tweets
←
→
Page content transcription
If your browser does not render page correctly, please read the page content below
PolemicTweet: Video Annotation and Analysis through
                      Tagged Tweets

                Samuel Huron1,1,2, Petra Isenberg1, Jean Daniel Fekete1
                     1
                         INRIA-Team Aviz, Bât 660, Université Paris-Sud,
                                  91405 Orsay Cedex, France
                                2
                                  IRI, 4 rue Aubry le Boucher,
                                          75004 Paris

      {Samuel.Huron,Petra.Isenberg,Jean-Daniel.Fekete}@inria.fr

       Abstract. We present PolemicTweet a system with an encompassing, econom-
       ic, and engaging approach to video tagging and analysis. Annotating and tag-
       ging videos manually is a boring and time-consuming process. Yet, in the last
       couple of years the audiences of events—such as academic conferences—have
       begun to produce unexploited metadata in the form of micropost activities.
       With PolemicTweet we explore the use of tagged microposts for both video an-
       notation and browsing aid. PolemicTweet is a system 1) to crowd source con-
       ference video tagging with structured sentiment metadata, 2) to engage audi-
       ences in a tagging process, and 3) to visualize these annotations for browsing
       and analyzing a video. We describe the the system and its components as well
       as the results from a one-year live deployment in 27 different events.

       Keywords: Backchannel, Video annotation, Crowdsourcing, Video analysis,
       Live tagging.

1      Introduction

Fig. 1. The three stages of PolemicTweet: 1) printed information on connection & tags, 2) the
live Twitter client & structured annotations, 3) video player showing tweet annotations.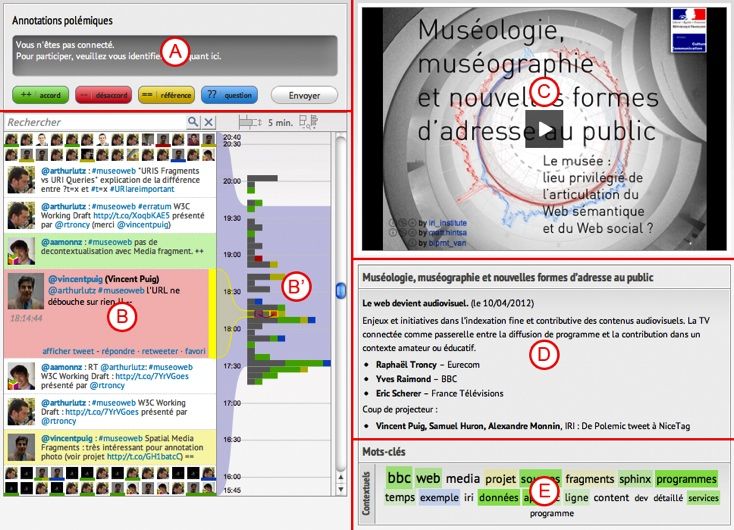
We present a web-based structured video tagging, browsing, and analysis system
called PolemicTweet as well as the results from a long-term evaluation of the system
under live deployment. The system is unique in that it supports a wide variety of re-
lated activities ranging from video tagging to analysis and provides its different com-
ponents to a variety of benefits for different kinds of audiences.
    PolemicTweet (PT) was developed in response to the need for effortless but rich
video tagging for event recordings and their subsequent browsing and analysis. A
number of organizations in the world, including ours, regularly organize mid-sized
conference-style events, with audiences of 25-300 attendees. Many of these events
are recorded using videos for archival purposes or for sharing on the web. For exam-
ple, a rapidly growing global audience regularly follows the TED-events series [1].
However, with current online video players it is difficult to get additional information
on a recorded video. Video meta-data does not generally give good information scent
about the events unfolding during the course of a video, such as the topic(s) covered,
controversies that may have arisen, or reactions of the audience to a speaker shown in
the video. This is because videos are complex to summarize, analyze, search and
browse. Yet, we argue that providing additional information scent is highly valuable
to external viewers. We thus, designed PT to capture structured annotations in a cost-
effective manner and provide this information for perusal. The captured meta-data is
meant to help both casual browsing and analysis of video content. PT also provides
visual summarization of annotations captured during live events and includes addi-
tional features for search and browsing.
    We specifically contribute a web-based solution to video annotation and analysis
that is easy to deploy and use. It is engaging in that the annotation phase offers bene-
fits to participants beyond their involvement in a tagging activity. PT is a well-
rounded system of integrated components and has been evaluated in a long-term study
involving the capture and annotation of video from 27 different events over one year.

Fig. 2. The Microsoft conference room in Paris where PolemicTweet was deployed; the use of
laptops or other wifi-capable devices was prevalent and ensured active participation.

2      Motivation

   Our design of PT was motivated by the proliferation of microblogging activities at
live events associated with our organization: the Institut de Recherche et d’Innovation
(IRI) du Centre Pompidou. IRI is a research association focusing on the study of cul-
tural practices enabled by digital technologies. A part of IRI's activities is to organize
seminars on subjects such as philosophy, design, and digital cultures. A typical semi-
nar is video recorded. A formal procedure of human annotation and tagging on the
video footage was used to follow the event in order to make the videos more searcha-
ble and comprehensible. This video annotation task was generally assigned to interns
(often archivist students) using a custom software called “Ligne de temps”. This pro-
cess had two major disadvantages: without having attended the event the job was
tedious and time-consuming for the student and costly for the organization.
   After this internal annotation process, the video recordings were published online
on a web platform displaying the same annotation interface as “Ligne de temps”. In
addition to the first set of annotations, the attendees of the event were allowed to add
further annotations. However, the participation remained low: the interface for anno-
tation was complex and did not entice the public participation we had wished for.
From these past experiences, we wanted to redesign this process with new tools that
took advantage of the micropost data produced by the audiences of our events. The
resulting system, PolemicTweet, was, thus, motivated by three goals:

1. Engage the audience to tweet for crowdsourced video annotation and tagging,
2. Provide a visual backchannel to incite people to tag their tweets with predefined
   tags and thus provide structured annotations,
3. Provide easily accessible tools in an encompassing system that span the whole pro-
   cess of annotation to video analysis.

In order to reduce the complexity of the annotation process we decided to make it
more engaging and to open the process to a wider audience. As indicated in Goal 1
above, we opted for a crowdsourced solution. Crowdsourcing was a promising solu-
tion since the behavior of participants in live events has evolved due to two digital
enablers: microblogging and portable devices. The speaker nowadays is no longer the
only information channel during an event, a second information channel (backchan-
nel) is now regularly used: the audience's tweets. This information channel is the data
source we wanted to leverage for video annotation and analysis in our tool PT.

3      Related Work

   To remember, analyze or study an event, video recordings and/or audio tapes are
frequently used [2]. For this reason the study and design of video analysis software is
a popular topic in information retrieval [3], computer human interaction [4–7], com-
puter supported collaborative work [8–10], and visual analytics [11–14]. In this sec-
tion, we discuss efforts most closely related to our goals and solutions in regards to
our video analysis interface, backchannels for live-events, crowdsourced media anno-
tation and tweet sentiment analysis.
3.1    Crowdsourcing media annotation and motivation

Social network activities such as tweeting can be used for crowdsourcing activities.
Shamma and Diakopoulos [15] showed that the social structure and the conversational
content of tweets can provide insight into a media event's structure and semantic con-
tent: quantitatively through activity peaks and qualitatively through keyword mining.
Diakoloulos et al. [16], after having collected tweets during the U.S. State of the Un-
ion presidential address in 2010, used them to annotate a video of the event. Based on
this assessment and our own experience observing twitter use during conferences, we
decided for PT to use Twitter for crowdsourcing video tagging.
   Yet, despite the benefits of crowdsourcing for annotation, there are disadvantages
to consider. Bernstein et al. [17] named the time-consuming nature of crowdsourcing
(due to the recruitment of the crowd and the time to achieve a task). To avoid this
problem, the authors designed a recruitment strategy and a retainer model (paying
workers to wait and respond quickly when asked). Another identified problem is the
motivation of workers. Wu et al. [18] encountered this problem in their video summa-
rization technique via paid crowd workers and expressed the need to further investi-
gate incentive mechanisms. This is one of the issues we addressed in PT.
   A large number of pitfalls have also been identified on crowdsourcing task quality
[19, 20]. Workers are often untrained and lack task context, particularly in specific
domains such as science or the humanities. In PT, however, we do not use a crowd-
sourcing platform but a casual social network (Twitter) to achieve the task through a
community of interest. This way we can expect annotators who are engaged and
aware of the context and do not require specific training.

3.2    Backchannels for live-events

A digital backchannel can be understood as a thread of information that accompanies
a live event. For more than ten years now, digital backchannels, have become a grow-
ing research area, in human computer interaction [21–23], computer supported col-
laborative work [21, 24, 25] and visual analytics [26, 27]. Backchannels have been
studied and used in several contexts like conferences [21, 23], classrooms [28], and
meetings [22]. A taxonomy of different backchannels was presented by Cogdill et al.
[25]. The researchers present five types of backchannels: process-oriented, content-
oriented, participation-enabling, tangential and independent backchannels. In PT we
use a process-oriented public backchannel, to achieve a live tagging task. A digital
backchannel such as ours is useful to provide awareness [28] to local and remote par-
ticipants [22] of questions, comments [23], shared work, and references[29], and can
encourage real-world discussions [22]. McCarthy et al. [21] studied backchannels in a
use case scenario similar to ours. They studied digital backchannels in academic con-
ferences using IRC and relate different types of use and problems, like the cost to
spread the information for a backchannel connection. McNely [24] suggests that the
problem has been partially solved by the increased availability of micropost web ser-
vices like Twitter, their simplicity of use, and the large adoption rate. Sopan et al. [30]
showed that a micropost backchannel during a conference, like in our case, permits to
connect local and distant participants. In another academic context, Harry et al. [23]
implemented and described the use of a backchannel to leverage participation in an
auditorium to allow for the audience to vote on questions and give feedback. In PT
we also use an explicit backchannel to crowdsource the process of a real-time distrib-
uted user task but—in contrast to the previous work—we use it to produce a docu-
ment that summarizes this activity as an annotated videotape.
   With the prevalence of social networks, portable devices, and wireless network
connections, backchannels are no more an emerging social phenomenon but a real
trend. When this increased use of social network and portable device meets large-
scale events like the Olympics, the Arab spring, or national elections, visual analytic
techniques can help to summarize and understand what has happened during the
event. Dörk et al. [26], for example, introduced the visual backchannel, a timeline-
based visualization that presents an overview of an event through social stream ag-
gregation. Marcus et al. [27] presented an algorithm for event detection in a streams
to produce annotation on a timeline-based visualization of the social activity sur-
rounding an event. Diakopoulos et al.[16], synchronized a recorded TV show with
related tweets and provided two timelines, one for sentiment analysis over time, the
other for volume of tweets.
   Similar to these three previous systems ([7, 26, 27]) PT provides a summary visu-
alization for video-recorded events but builds on this idea by using its backchannel as
a specific crowdsourcing tool for tagged annotation.

3.3    Tweet content analysis

Transcripts, tweets, and other temporal data streams are often used to annotate video.
In the case of temporal data composed of text, it is common to use named-entity
recognition, sentiment analysis, and natural language processing to recognize and tag
events of interest. When we started developing PT, sentiment classification methods
on tweets were not as effective as on classical natural language corpora due to the
limited length of tweets and the common use of shortened and non-standard English
words [31]. Now, the combination of different techniques from machine learning
[29], semantic rule based approaches [32], and graph-based optimization [33], have
improved sentiment classification of tweets significantly, and can achieve 85.6%
accuracy [32]. In this last work, the authors considered three types of sentiments:
negative, positive, and neutral. The reported accuracy rate was achieved on an English
tweet corpus of the most popular queries on Twitter (Obama, Google, iPad, Lakers,
Lady Gaga), and on a clearly targeted subject. We did not take advantage of this ap-
proach as it only works for English tweets, it is complex to set up, and has only been
tested on a topic-limited tweet corpus. Instead, for PT [34], we needed to find a solu-
tion that would work in multiple and mixed languages, was simple to deploy, and
would work on a variety of specialized corpora like philosophy, aesthetics, or design.
   Diakopoulos and Shamma [15] used another approach for sentiment classification:
they used Amazon Mechanical Turk to perform hand-annotated sentiment classifica-
tion on tweets. Turkers were compensated $0.05 per ten tweets analyzed. Turkers
were asked to tag four types of sentiments: negative, positive, mixed, and “other.”
The corpus of tweets was in English and about politics. Others [16] described the use
of machine-learning algorithms to perform the same analysis with lower accuracy and
cost but higher speed. Crowdsourcing sentiment classification on tweets with its high-
er success rate and relatively low overall cost is more and more common. For in-
stance, it is one of the products of CrowdFlower [35] a well-known crowdsourcing
platform. However, this approach cannot be used to tag tweets in real-time.
   Whether or not to use crowdsourcing as a tool depends on one’s annotation goal
[36] since there is a speed vs. quality tradeoff to consider. For PT, we wanted to have
the best of both worlds: classify tweets with a low cost (both in computer processing
and in money) and a high precision rate, even if the recall rate depended on the adop-
tion of our tool. We also wanted to have this classification in real time.

3.4    Video Analysis Support

Mackay's EVA [5], was one of the earliest systems on video annotation, tagging, and
analysis. Mackay synchronized records of metadata with her video records, such as
the movements of a mouse on a screen. Nowadays recorded metadata is often taken
from real-time web social services like chat or microblogging. PT relates to this trend
but asks Twitter users to tag their own tweets for structured annotation.
   Another solution to aid in the process of video analysis has been to support multi-
ple analysts in parallel. Cockburn and Dale [8], for example, designed and developed
CEVA a synchronous collaborative video annotation system that focuses on support-
ing parallel analysis. Parallel analysis is based on the idea that multiple video analysts
(five in their prototype) share their analyses in real-time for distributing the workload.
The authors argue that this synchronicity property offers two potential benefits: 1)
synergy of group participation and 2) distributing the analysis workload. We were
particularly interested in supporting the synchronicity property for the PT tagging
phases to similarly take advantage of the synergy of the audience during event record-
ing. The Videolyzer tool [7] also includes an asynchronous formal semantic tagging
tool to increase information quality by allowing users to collaboratively organize their
comments on the video. Their tool differs from ours in that we did not want to rely on
a complex tagging interface to more easily spur user tagging in real-time during the
event. Nevertheless, Videolyzer inspired the social use case scenario of PT.

4      System Design

PT is made of four interconnected components: 1) the definition of four tags to anno-
tate tweets and the backchannel interface to read and write tagged tweets during the
conference event, 2) a social protocol to set up and run an event live, and 3) a web
video player synchronized to a tweet visualization to navigate and replay conference
video recordings, 4) a website to provide a fluid browsing between all PT compo-
nents. We describe the components in that order.
4.1 Backchannel to crowd source tag annotation
To provide an enriched visualization of video annotations we wanted to collect tweets
structured by specific annotation tags. We chose to provide a limited number of tags
with a simple syntax and a specific color code (in brackets): agreement with the
speaker (++,), disagreement with the speaker (--,), questions raised by or proposed
to the speaker (??,), and references (==,), e.g. quotes or URLs to related content.
Our choice of tags was informed by observation of the types of tweets typically used
in the conference-style events that we target with PT. For choosing our set of tags, we
had to balance expressive power and simplicity. To provide a memorable set of tags,
we decided to use the simplest possible tagging format. At the same time, our inter-
face needed to provide enough incentive for using the tags. The design rationales for
choosing the tag syntax were:
• Simplicity of use and memorability: to facilitate its use and adoption;
• Brevity: to cope with the 140 character limitation of Twitter and for fast typing;
• Client and language neutrality: to be usable from any twitter client with any kind
of text input method, usable in any language;
• Ease of parsing: for automatic processing tools;
• Expressiveness and univocality: to allow clear statement of intent and for machines
to interpret it unambiguously.
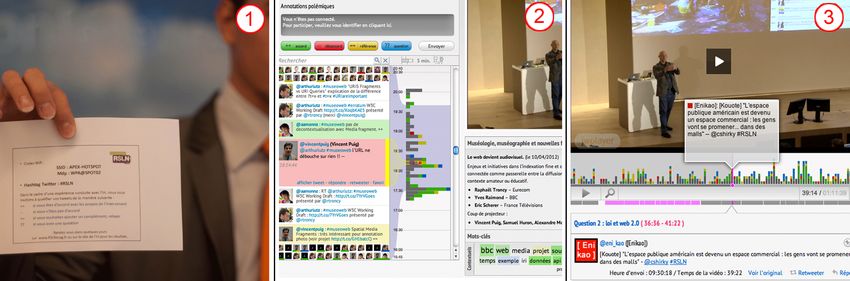
Fig. 3. The PolemicTweet backchannel interface.
The four tags were introduced to the audience before the start of an event. Fig. 3
shows the real-time backchannel interface we designed to allow an audience to moni-
tor the tagged tweet activity in real time. It consists of six different components (Fig.
3): A) an enhanced Twitter client with a text field, four buttons to easily add tags to
tweets, and a send button, B) a list of tweets relative to the scrollbar’s focus, B’) avertical bar chart showing tweet activity over time, colored blocks represent tweets containing a tag using the tag’s representative color, C) a video player showing the live video stream, D) abstract and program of the event, E) dynamic tag-cloud extract from the tweets in focus, color-coded according to the polemic tag colors. For organizers, setting-up this interface is easily done in two steps on the PT web server: 1) cloning the folder containing the default interface, and 2) changing the set- tings file to specify event title, hash tag, timestamp of the beginning, expected dura- tion, and abstract. 4.2 Engaging the crowd: social protocol for synchronous annotation One very unique feature of PT is a social protocol we developed in order to help event organizers make best use of PT. The main goal of our protocol is to inform the audience about the capture and future use of their tweets and to introduce the four specific tags. The protocol suggested event organizers to follow three phases: Before the talk: Instructing the crowd. We designed a “connection package” to inform the audience. It consists of a flyer (Fig. 1) given to attendees during the registration process, containing information about the network access policy, the PT tags, the website URL, and the Twitter hashtag for the event. Additionally, we asked organiz- ers to make an announcement prior to the conference. During the talk: Crowd source sentiment analysis and video annotation. Attendees send tweets with the PT tags, a program records all the tweets relative to the twitter event’s hashtag. The visual backchannel website is set up to provide real-time visual feedback of tweets and to give an incentive for participation and easy access to people who do not use Twitter (Fig. 5). Organizers can also make use of this interface to get informed about questions to ask at the end of a talk. After the talk: Publishing. Organizers synchronize the recorded data with the timestamp of the video streaming server and the tweets’ timestamps. Then they pub- lish the video on the web (copying and modifying a configuration file) with the MetadataPlayer, that we discuss in the next section. Synchronization of the video and tweets could be complex due to the lack of relia- ble video timestamp. In the case of Diakopoulos and Shamma [15], synchronization was simple because the video was provided by an official TV channel and had a well- known timestamp. In the academic context, an event can be recorded by different means and not be broadcasted live. Most of the time—if a video is not streamed—the video timestamp depends on settings on the recording hardware and is, thus, not relia- ble. We, thus, deploy several strategies for synchronizing video recording and tweet activity: we video-record a clock before the event, have a special tweet at the begin- ning of the event, and re-synchronizes it with a custom script. Of course for resyn- chronization of tweets to a videotape it is important to use the originally captured video footage and not an already cut and edited version.
4.3 Video analysis web video player
The PT video player (Fig. 4) is designed to play a conference video while showing the
tagged and untagged tweets sent with the conference hashtag during the time of video
recording. Our design goal was: 1) to provide a visualization that gives an overview
of the tags and activity spikes, 2) to design a compact player that can be easily em-
bedded, just like the YouTube player, and 3) to augment the player's video navigation
techniques to get more benefit from the annotations.
We designed all the time-related components as graphical horizontal projections on
the time axis. All components have the same width and horizontal scale to allow for a
vertical alignment between them.
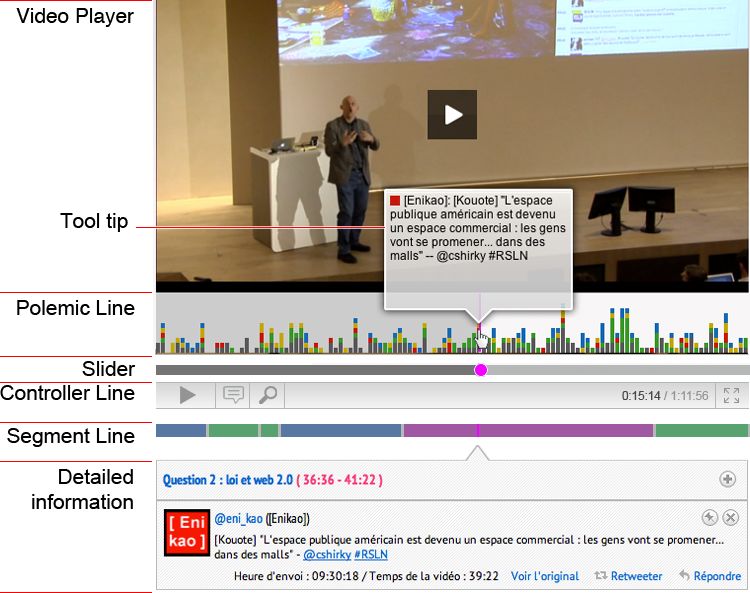
Fig. 4. Each component of the MetadataPlayer used in PT.
Navigation on the video is performed using the standard video player components
and controls: a controller line with the buttons to play, pause, change the audio level,
and a seek bar. Two novel components show context and allow for contextualized
interactions. The segment line allows quick access to chapters of the video—such as
topics of a presentation or name of presenters for a panel. The data for this line can be
manually or automatically extracted from the video. The polemic line visualizes the
tweet activity during the event, positioned on the time axis; it provides contextual
feedback on the tweet activity, a direct access to video segments highlighted by
tweets, and direct access to the tweet contents through hovering. The polemic line has
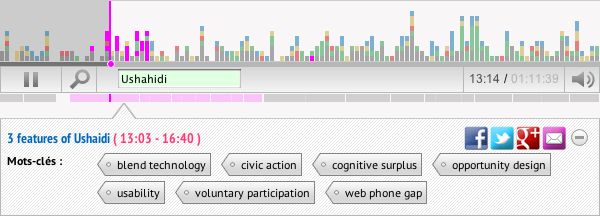
the following characteristics:• Polemic line visualization: The visualization is a bar chart composed of colored tweet squares. Each square represents a tweet colored according to the tweet's tag or gray if the tweet does not contain any tag. The square has a fixed size of 5 pix- els to facilitate its selection without taking too much screen real-estate. Depending on the length of the video, each 5px slot represents a certain time range. At each time-slot the recorded tweet squares are sorted top-to-bottom by type (green, red, blue, yellow, and gray) so that the most expressive tweets are at the top of the bars. • Interaction: Moving the mouse over a square shows a tooltip with the tweet's text, author name, and tag color. Clicking on it seeks the video to the time of the tweet, and makes meta-information appear in the details information component (Fig. 5). The position of each square provides information about when the tweet was emit- ted but also about the contextual activity level at the moment. • Search: A search text-field (Fig. 5.) in the controller bar allows finding text in the tweets. When a search string is entered, the visualization is updated to highlight each represented tweet containing the string. As shown in Fig. 5 this feedback shows the distribution of tweets containing the specified string (in purple). Fig. 5. Search for “ushahidi” in the polemic line”. The tweets referring to the section of the talk related to this query are highlighted in pink. 4.4 Website To provide a fluid browsing experience between all the PT components we embed them inside a public website composed of two main components: a home page pre- senting the past, present and future events and an archive page to find older events. On the pages containing past events, the MetadataPlayer shows the annotated videos of these events. The backchannel interface is only available during a live event on the “present events” part of the page. 5 Assessing the Impact of Polemic Tweet In order to better understand how PT supports our goals of cheap, useful, and engag- ing video annotation, we studied the tool using mixed-methods —both qualitative and quantitative approaches under long-term deployment. We successfully deployed PT in 27 real conferences, seminars, and events of different
locations, topics, and sizes of audience over the last year. For these 27 events we
recorded 46 tracks (video and tweets), each track being one speaker or one session.
20 events took place at the Pompidou Center in our conference room, 7 events took
place at various places in the city of Paris. Nine events had between 25-50 attendees,
13 events 51-100 and five events 101-290. The topics of the events varied greatly,
including academic topics such as science, technology, philosophy, and design.
   The duration of 24 events was limited to one day while three events took place
over several days. The recorded tracks from each event ranged from 30 to 395
minutes. Overall, we received and collected 9,088 tweets from 1,012 unique accounts.
Over the last year, the web site (player, backchannel, but also other additional pages
like home and archives) received about 157,000 page views from over 15,000 unique
visitors with an average visit duration of 3 minutes which is comparable to National
video websites with substantially more content and public cover like Francetvod.fr
[37] with a 3.2 minute average visit duration during February 2012.
   Except for the video recording, sound capture, and the communication support for
the tags (flyers and poster boards), the components of PT were deployed on the web,
which greatly simplified the process for the organizers. The recorded videos are all
published on the open site http://www.polemictweet.com.

5.1    Data Collection

To study the use of PT we gathered three types of data: all tweets using the various
conference’s hashtags, logs from the usage of the PT MetadaPlayer and the back-
channel interface, and two questionnaires sent to various users of PT, either as de-
signers, organizers, speakers, or audience participants.
   We used Google Analytics to log the website pages and a custom logging system
to collect low-level traces of user interactions on the video player that Google Analyt-
ics could not provide. On the backchannel interface, we recorded usage logs only via
Google Analytics to give us information about where users came from (direct access,
twitter, devices, others) and where the users were physically located (inside or outside
the conference room). This last information does not take into account attendees not
using the provided free Wifi connection (e.g. using their mobile's own 3G network)
and possible errors of domain detection. Despite a few tablet users most connected
with personal computers. We also recorded the web client's signature for each tweet
to understand where tweets were sent from.
   We sent two web surveys, the first consisted mainly of close ended questions sent
by tweet to 140 randomly chosen attendees of one of the recorded events; the second
questionnaire was sent to understand how PT faired in the organizer’s point of view.
This questionnaire consisted of open-ended question sent by mail to five members of
the event organization team in our institute.
   For the first questionnaire we received 47 responses, 27 of which completed all
parts of the survey. 70 % (19) of the respondents attended at least one of the confer-
ences. 96 % (26) had already used twitter at conferences, 3 % just for reading. This
shows a clear positive feedback towards the goals of PT. For the second questionnaire
we received four completed responses.
5.2    Analysis

In this section we report on the analysis of our data according to three main questions:
1) Is the system sufficiently engaging to collect data for crowd sourced video tagging?
2) Does the visual backchannel incite people to tag their tweets and thus provide an-
notation structure? 3) Is the video web player with annotations useful?

Is the system sufficiently engaging?

Fig. 6. Polemic lines of A) “Les Stratégies Virtuelles des Musé: l'Heure de Vérité”, B)
“Mashup Remix”, C) “Du vinyl au numérique,” a 2h event with different density of annotation,
number of peaks, and tagging activity.

   Through our live deployment of PT, we found that engagement in the
crowdsourced video tagging was highly diverse. We recorded from 0.20 to 7.94
tweets per minute (mean at 1.47, median at 0.89), with 0.12 to 2.13 tags per minute
(mean 0.47, median 0.32). Averaged across all events, tweets were tagged using our
syntax 40% of the time. Considering tagging a tweet as an additional cost, we con-
clude that the system provided enough tagging incentive on average.
   Otherwise, we found that engagement in the annotation process was highly varied
and depended on several factors including the type of audience, the content of the
event, the number of twitter users, and whether the PT protocol had been respected or
not. We discuss these in more detail now:
Type of Audience. Our audiences were varied in terms of size, culture, equipment,
incentive to achieve a task, and distribution of local and distant attendees. All of these
factors played a role in the participation and engagement of attendees in the tweeting
and tagging task. In our collected data, we had a group of events in which the number
of recorded twitter accounts in comparison to the number of attendees was very high
(64%–187% on 7 events with 825 tweets on average, (e.g. Fig. 6. A). Groups with
values higher than 100% represent those in which more twitter accounts were record-
ed than participants in the events. Here remote attendees also used the conference
hashtag to participate in the backchannel. The recorded events can be categorized
according to two participation types: medium participation (20%–51% on twelve
events with 209 tweets on average) and low participation (1%–18%, on seven events
with 61 tweets on average, Fig. 6. C).
Type of Speaker and Twitter Reaction. Some attendees reported through our informal
interview that writing a tweet and tagging it took more attention in-situ than when
following the event online. We had originally hypothesized that a captivating speaker
would probably lead to less Twitter activity, but from our observations organizing and
attending our events we could not confirm this hypothesis. On some events we ob-
served a high level of tweet activity during a captivating talk and others with a capti-
vating speaker had hardly any tweet activity. On the other hand we also noticed that
in cases of less captivating talks, a peak of tweet activity arose because the audience
was no longer focused on the speaker. Overall, regardless of the quality of the speaker
the audiences of our events were polite and only used negative tags 14% of the time.
Type of Content. We found that the type of content of an event and its audience could
be highly related factors when it comes to annotation activity. For Instance, one of
the events’ topic was the websites of the Pompidou Center and the Tate Gallery. In
accordance to the topic, the audience consisted of people active on the web and social
networks. During this event we saw a very high participation (Fig. 6. A) in terms of
tweets and tags: 6.06 tweets per minute and 2.13 tags per minute. On the other hand,
we were also surprised to see low participation for certain events where the content
would have suggested high Twitter usage. For example the "Muséologie 2.0" had the
topic: museum digitization, and preservation policies. Here, the level of participation
was extremely low: 0.20 tweets per minute and 0.12 tags per minute.
Observance of the PT Protocol. We found that the protocol was generally well applied
by the event organizers. Yet, in some cases we observed that deviance from the proto-
col could impact user activity. In particular we found problems related to hashtag
selection, instruction diffusion, and connectivity.
For the event “L'Open Data, et nous, et nous, et nous ?”, organizers chose to use an
existing hashtag to boost interaction between audience and remote Twitter users.
They used #opendata, a common hashtag, which had been in use daily before the
event by this community and others. The effect was that the tweet number per minute
exploded to 7.94 but the number of tags per minute stayed really low at 0.88 as the
tags were not known outside of the event. The backchannel was crowded by other
tweets relative to the subject but not to the conference. This was a source of frustra-
tion for some attendees and made our system less useful in real-time and as a video
annotation tool. Choosing a specific hashthag is important if video annotation is a
goal, even if the event should stay connected to existing Twitter communities.
Another issue regarding the observance of the PT protocol was that the instruction
distribution to the audience was always different. Sometimes flyers were put on a
seat, sometimes handed out with oral instructions, and sometimes placed somewhere
on a table at the entrance. Despite these differences, most of the time attendees found
the information and tweeted. Yet on some events we observed that flyers were not
provided and just an announcement of instructions was made. This dramatically im-
pacted the audience participation. For example this resulted in only 0.27 tweets per
minute for the event “Du vinyl au numérique” (Fig. 6. C). The last and most obvious
factor that highly impacted the audience participation was network connectivity. For
instance, in the event “Mashup and Remix” (Fig. 6. B) mobile networks (3G and oth-
ers) were hidden because the conference room was usually a cinema. A wifi network
was provided but connectivity information was just given orally and not on the flyer.
Thus, despite an audience of 70 people, only five sent any tweets (0.85 per minute).

Does the visual backchannel incite people to add tags?
Fig. 7. Tweet with and without PT tags split by backchannel vs. other clients.

Of the 27 responses to our first questionnaire, 89 % (24) reported to remember PT
tags from attending the event. While our general goal in making the tags known was
reached, we were interested to learn more about people’s tagging practices and in
particular in regards to our backchannel interface.
   We observed that tweets sent by the PT backchannel interface had a higher rate of
tag adoption (55% of tweets were tagged) than for the top ten other clients used (20%
of tweet were tagged) (Fig. 7.). A Welch's t-test was conducted to compare percentage
of tagged tweets emitted through the backchannel and by all others clients. There was
a significant difference in the score for the backchannel (M=70%, SD=26%) com-
pared to all other clients (M=24%, SD=11): t(23)=6.74, p .1). All
trails that were correlated to the tweets had on average more than one tweet by bar in
the chart. According to the attendees survey sent after the end of the event 40 % (11)
reported to have used the Polemic Line visualization. 90 % (10) of these respondents
found that the interface provided the following useful information:

• Item summary of twitter activity: 90 % (10).
• To view a part of video with:
  ─ Many tweets: 81 % (9)
  ─ Positive opinions (++): 36 % (4)
  ─ Negative opinions (--): 54 % (6)
  ─ Questions (??): 45 % (5)
  ─ References (==): 36 % (4)

81 % (9) respondents agreed or strongly agreed that the visualization helped them to
browse the video and 100 % (11) would recommend PT to a friend.
   We received additional feedback from open questions in our surveys and report the
most interesting here. One particularly prominent comment was the notion of hotspot
and points of interest, also resonating in the answers above. Several comments were
similar to this one: “PT is useful to browse videos faster and find a hotspot (polemic,
debate, synthesis, and minutes)”. Another frequent comment related to video over-
view. Five users wrote PT was useful for “viewing the mood (of the audience)”, and
that this overview helped to “construct an opinion”, and to put the talk in perspective
to the audience’s opinions and references”. Others commented on the usefulness of
the player after an event to “re-find some information and share it with people who
could not attend.” We also received a comment from one of the organizers that the
player was useful to “prepare the chaptering, for taking notes of a speaker change, and
references (to others resources).” On the same point, probably one of the most enthu-
siastic organizers reported that during the event he used the system for note taking: “it
replaced my pencil and paper for note taking.”

6      Discussion

Evaluating PT as a deployed system over a long period of time was challenging be-
cause we had little control over our audience and settings. Yet, our analysis and feed-
back of PT has been predominantly positive on both usability and usefulness as
shown in the results from questionnaires and informal feedback.
   According to our analysis, the three main goals of PT were achieved: 1) the system
engaged the audience to provide data for crowdsourced video tagging, 2) the visual
backchannel incited people to tag their tweets and thus provided annotation structure,
and 3) the media player augmented with the annotated tweet visualization was con-
sidered a significant improvement over traditional video players.
   We found that PT was successful beyond its originally intended purpose of video
tagging. In particular remote participants were able to get real-time visual feedback
about audience sentiment and could be involved in the event as a commentator and
annotator and not just a passive listener. The PT environment and backchannel inter-
face provide a friendly tool for augmenting the public debate around conferences; this
is something we consider valuable for improving the communication between im-
portant societal issues such as citizens and science or politics in the digital era.
   Beyond that, the PT outcomes indicate that we can crowdsource an annotation task
using social networks (and not only with dedicated crowdsourcing platforms) depend-
ing on the content and community. Last, the use of the backchannel interface can aid
by providing an incentive to achieve a task, like tagging during a collaborative syn-
chronous activity. In summary we found a considerable amount of excitement of par-
ticipants and event organizers. PolemicTweet can be considered as a first step into
exploring real-time information visualization of crowdsourced tasks. Our design is
applicable to a variety of different scenarios and events such as classroom presenta-
tions, synchronous web seminars, public debates, and social TV or even to popular
video websites to leverage the crowd for annotating the videos to provide a richer user
experience. Despite this, some of our choices should be re-assessed:

• Possible optimization. We collected a large number of annotations through tweets
  but not all were tagged. With our pre-defined tags we could achieve a better preci-
  sion than sentiment analysis algorithms, but for some events had only low recall.
  More work is needed to research incentives for the audience to tag tweets.
• Shared attention. Asking the audience to tweet during an event and moreover to
  tag their tweets comes with challenges. First, it requires additional work to remem-
  ber the tags and add them. The danger is that attendees may be losing focus of their
  main activity (listening to the conference) and even of their secondary activity such
  as writing a tweet. Can we further simplify the interface to spare some attention?
• Tags Property. We received a lot of feedback from Twitter users on our tags. Some
  of them criticized their restrictiveness; others felt that tags should be based on ex-
  isting usage for expressing sentiment. We have several reasons not to rely on exist-
  ing tags or practices: tags like #fail, #happy, as well as Smileys, are not universal,
  are ambiguous and are longer than our syntax.
• Scalability, User interface design and system. PT comes with some scalability
  problems. Due to the homothetic representation of tweets, the interface is limited
  by temporal density. Our design works well for events in which Twitter activity is
  between 0.5-5 tweets per minute. A graphical scalability problem existed with two
  of our recorded events: the standard representation took too much screen real es-
  tate. To solve this problem, we used a classical aggregated stacked area chart.

7      Conclusion

In this paper we present PolemicTweet a system and protocol that allows reducing
video annotation complexity and cost for events of approx. 25-300 attendees, such as
academic conferences. We crowdsourced the annotation process through Twitter and
made the annotation process more engaging and open for a wider audience. The sys-
tem’s initial goal was to provide an open and engaging method for event organizers to
tag and annotate the videos they recorded during their events, but also to supply an
accessible tool to play the video over the web and show the annotations.
PolemicTweet is a deployed system, used regularly now at least once a month.
This system was deployed for more than one year and co-evolved during several cy-
cles with its users (audience and organizers). This is the reason for its success as well
as for the difficulty of evaluating it according to its design goals: they have evolved.
   We assessed the success of PolemicTweet and the factors influencing adoption,
participation, and use in a long-term deployment. We recorded a wide range of differ-
ent events and despite the differences in audience, topic content, and event location,
the system showed its robustness and effectiveness: 1) to produce useful structured
annotation and tagging in most cases, 2) to provide a method and tool to engage the
audience in a live tagging activity, 3) to support web-based video browsing activity
while providing useful landmarks with a simple yet powerful navigation tool.

8      References

1.      TED: Ideas worth spreading, Retrieved January 01, 2013 from http://www.ted.com/.
2.      Allen, C.: The use of video in organizational studies. SIGCHI Bull. 21, 115–117
        (1989).
3.      Hauptmann, A.: Lessons for the future from a decade of informedia video analysis
        research. Proc. CIVR. pp. 1–10 Springer-Verlag(2005).
4.      Roschelle, J., Goldman, S.: VideoNoter: A productivity tool for video data analysis.
        Journal of Behavior Research Methods. 23, 219–224 (1991).
5.      Mackay, W.E.: EVA: An experimental video annotator for symbolic analysis of video
        data. SIGCHI Bull. 21, 68–71 (1989).
6.      Abowd, G.D., Gauger, M., Lachenmann, A.: The Family Video Archive: An
        annotation and browsing environment for home movies. Proc. Workshop on
        Multimedia Information Retrieval. pp. 1–8. ACM (2003).
7.      Diakopoulos, N., Goldenberg, S., Essa, I.: Videolyzer: Quality analysis of online
        informational video for bloggers and journalists. Proc. CHI. pp. 799–808. ACM
        (2009).
8.      Cockburn, A., Dale, T.: CEVA: A tool for collaborative video analysis. Proc.
        GROUP. pp. 47–55. ACM (1997).
9.      Schroeter, R., Hunter, J., Kosovic, D.: Vannotea: A collaborative video indexing,
        annotation and discussion system for broadband networks. Proc. of. K-CAP. pp. 1–8.
        ACM (2011).
10.     Engström, A., Perry, M., Juhlin, O.: Amateur vision and recreational orientation:
        Creating live video together. Proc. CSCW. pp. 651–660. ACM (2012).
11.     Daniel, G., Chen, M.: Video visualization. pp. 409–416. Proc. VIS. IEEE (2003).
12.     Ruppert, T., Kohlhammer, J.: A radial visualization tool for depicting hierarchically
        structured video content. Proc. VAST. pp. 251–252. IEEE (2010).
13.     Tonomura, Y., Akutsu, A., Otsuji, K., Sadakata, T.: VideoMAP and VideoSpaceIcon:
        tools for anatomizing video content. Proc. INTERACT & CHI. pp. 131–136. ACM
        (1993).
14.     Parry, M.L., Legg, P.A., Chung, D.H.S., Griffiths, I.W., Chen, M.: Hierarchical event
        selection for video storyboards with a case study on snooker video visualization. IEEE
        TVCG, 17, 1747–1756 (2011).
15.     Diakopoulos, N.A., Shamma, D.A.: Characterizing debate performance via aggregated
        twitter sentiment. Proc. of CHI, pp. 1195–1198. ACM (2010).
16. Diakopoulos, N., Naaman, M., Kivran-Swaine, F.: Diamonds in the rough: Social
media visual analytics for journalistic inquiry. Proc. of Visual Analytics Science and
Technology (VAST), pp. 115–122. IEEE (2010).
17. Bernstein, M.S., Brandt, J., Miller, R.C., Karger, D.R.: Crowds in two seconds:
Enabling realtime crowd-powered interfaces. Proc. UIST. pp. 33–42. ACM (2011).
18. Wu, S.-Y.Y., Thawonmas, R., Chen, K.-T.T.: Video summarization via
crowdsourcing. Extended abstracts CHI. pp. 1531–1536. ACM, (2011).
19. Snow, R., Connor, B.O., Jurafsky, D., Ng, A.Y., Labs, D., St, C.: Cheap and fast—but
is it good? Evaluating non-expert annotations for natural language tasks. Proc.
EMNLP, pp. 254–263. ACL (2008).
20. Ipeirotis, P.G., Provost, F., Wang, J.: Quality management on Amazon Mechanical
Turk. Proc. SIGKDD Workshop on Human Computation. pp 1403. ACM (2010).
21. McCarthy, J.F., boyd, d., Churchill, E.F., Griswold, W.G., Lawley, E., Zaner, M.:
Digital backchannels in shared physical spaces: attention, intention and contention.
Proc. CSCW, pp. 550–553. ACM, (2004).
22. Rekimoto, J., Ayatsuka, Y., Uoi, H., Arai, T.: Adding another communication channel
to reality: An experience with a chat-augmented conference. Proc. CHI. ACM (1998).
23. Harry, D., Green, J., Donath, J.: Backchan.nl: integrating backchannels in physical
space. Proc. of CHI. pp. 1361–1370. ACM (2009).
24. McNely, B.: Backchannel persistence and collaborative meaning-making. Proc.
SIGDOC. pp. 297–304. ACM (2009).
25. Cogdill, S., Fanderclai, T.L., Kilborn, J., Williams, M.G.: Backchannel: Whispering in
digital conversation. Proc. HICSS. pp 8 (2001).
26. Dörk, M., Gruen, D., Williamson, C., Carpendale, S.: A Visual Backchannel for
Large-Scale Events. IEEE TVCG. 16, 1129–1138 (2010).
27. Marcus, A., Bernstein, M.S., Badar, O., Karger, D.R., Madden, S., Miller, R.C.:
Twitinfo: Aggregating and visualizing microblogs for event exploration. Proc. CHI.
pp. 227–236. ACM (2011).
28. Bry, F., Gehlen-Baum, V., Pohl, A.: Promoting awareness and participation in large
class lectures: The digital backchannel backstage. Proc. IADIS. pp. 27–34. Emerald
Group Publishing Limited(2011).
29. McCarthy, J.F., boyd, d.: Digital backchannels in shared physical spaces: experiences
at an academic conference. Extended abstracts CHI. pp. 1641–1644. ACM (2005).
30. Sopan, A., Rey, P., Butler, .B, Shneiderman, B.: Monitoring Academic Conferences:
Real-time Visualization and Retrospective Analysis of Backchannel Conversations,
Proc. SOCINFO. (2012)
31. Pang, B., Lee, L.: Opinion mining and sentiment analysis. Journal of Foundations and
Trends in Information Retrieval - FTIR. pp. 135 (2008).
32. Jiang, L., Yu, M., Zhou, M., Liu, X., Zhao, T.: Target-dependent twitter sentiment
classification. Proc. ACL HLT. pp. 151–160 (2011).
33. Speriosu, M., Sudan, N., Upadhyay, S., Baldridge, J.: Twitter polarity classification
with label propagation over lexical links and the follower graph. Proc. HLT. pp. 53–
63. ACM (2011).
34. Huron, S. Fekete J-D.: User-Supplied Sentiments in Tweets. In. 2nd Workshop on
Interactive Visual Text Analysis. IEEE (2012)
35. Crowdflower :Senti crowdflower, Retrieved January 01, 2013 from
https://senti.crowdflower.com/senti.
35. Quinn, A.J., Bederson, B.B.: Human computation: a survey and taxonomy of a
growing field. Proc. CHI. pp. 1403–1412. ACM, (2011).
36. Médiamétrie-eStat: La fréquentation des sites Internet français Février 2012. Retrieved
January 01, 2013 from http://www.mediametrie-estat.com/la-frequentation-des-sites-
internet-francais-en-fevrier-2012/.You can also read