Twitter-derived neighborhood characteristics associated with obesity and diabetes - CS @ Utah
←
→
Page content transcription
If your browser does not render page correctly, please read the page content below
www.nature.com/scientificreports

                        OPEN          Twitter-derived neighborhood
                                      characteristics associated with
                                      obesity and diabetes
Received: 18 August 2017              Quynh C. Nguyen 1, Kimberly D. Brunisholz2, Weijun Yu3, Matt McCullough4, Heidi A.
Accepted: 14 November 2017            Hanson 5,8, Michelle L. Litchman6, Feifei Li7, Yuan Wan8, James A. VanDerslice9, Ming Wen10
Published: xx xx xxxx                 & Ken R. Smith11
                                      Neighborhood characteristics are increasingly connected with health outcomes. Social processes
                                      affect health through the maintenance of social norms, stimulation of new interests, and dispersal of
                                      knowledge. We created zip code level indicators of happiness, food, and physical activity culture from
                                      geolocated Twitter data to examine the relationship between these neighborhood characteristics
                                      and obesity and diabetes diagnoses (Type 1 and Type 2). We collected 422,094 tweets sent from Utah
                                      between April 2015 and March 2016. We leveraged administrative and clinical records on 1.86 million
                                      individuals aged 20 years and older in Utah in 2015. Individuals living in zip codes with the greatest
                                      percentage of happy and physically-active tweets had lower obesity prevalence—accounting for
                                      individual age, sex, nonwhite race, Hispanic ethnicity, education, and marital status, as well as zip code
                                      population characteristics. More happy tweets and lower caloric density of food tweets in a zip code
                                      were associated with lower individual prevalence of diabetes. Results were robust in sibling random
                                      effects models that account for family background characteristics shared between siblings. Findings
                                      suggest the possible influence of sociocultural factors on individual health. The study demonstrates the
                                      utility and cost-effectiveness of utilizing existing big data sources to conduct population health studies.

                                      Where we live, including the social, political, economic, and built environment, impacts health and creates health
                                      disparities. Poor access to food1–6, abundance of fast food chains7, lack of recreational facilities8,9, low levels of
                                      walkability10–12, and high crime rates2,13 have been shown to predict higher obesity rates. Environmental exposure
                                      to toxicants, noise, and violence can also be detrimental to physical and mental health14,15. Conversely, neighbor-
                                      hood resources such as playgrounds for children to play outdoors, access to healthy food, and parks or fitness
                                      centers for physical activity engagement can be beneficial to developmental outcomes and chronic disease preven-
                                      tion1,14,16,17. Adverse neighborhood conditions often converge in poor and minority neighborhoods18–21, thereby
                                      increasing health disparities.
                                          Social environments can offer social and emotional support as well that buffers stressful life events22. Johns
                                      and colleagues found that neighborhoods with higher social cohesion had residents with lower risk of posttrau-
                                      matic stress disorder23. Communities with higher happiness levels have residents with lower rates of obesity,
                                      hypertension, and suicide as well as increased life expectancy24–29. Health behaviors, such as, healthy food con-
                                      sumption, health screening, smoking, alcohol consumption, drug use and poor sleep patterns have been observed
                                      to spread through social networks30–33. Social processes and networks can affect health through mechanisms such
                                      as the maintenance of norms around health behaviors, the stimulation of new interests, political advocacy for
                                      access to resources, emotional support, and dispersal of knowledge about health promotion practices. The social

                                      1
                                       Department of Department of Epidemiology and Biostatistics, University of Maryland, College Park, School of
                                      Public Health, College Park, USA. 2Institute for Healthcare Delivery Research, Intermountain Healthcare, Salt Lake
                                      City, USA. 3Department of Health, Kinesiology, and Recreation, College of Health, University of Utah, Salt Lake City,
                                      USA. 4Department of Geography, University of Utah, Salt Lake City, USA. 5Department of Surgery, University of
                                      Utah, Salt Lake City, UT, USA. 6College of Nursing, University of Utah, Salt Lake City, USA. 7School of Computing,
                                      University of Utah, Salt Lake City, USA. 8Utah Population Database, Huntsman Cancer Institute, University of Utah,
                                      Salt Lake City, USA. 9Division of Public Health, Department of Family and Preventive Medicine, University of Utah,
                                      Salt Lake City, USA. 10Department of Sociology, University of Utah, Salt Lake City, USA. 11Department of Family and
                                      Consumer Studies and Population Science & Huntsman Cancer Institute, University of Utah, Salt Lake City, USA.
                                      Correspondence and requests for materials should be addressed to Q.C.N. (email: qtnguyen@umd.edu)

        SCIENTIFIC REPOrTS | 7: 16425 | DOI:10.1038/s41598-017-16573-1                                                                                    1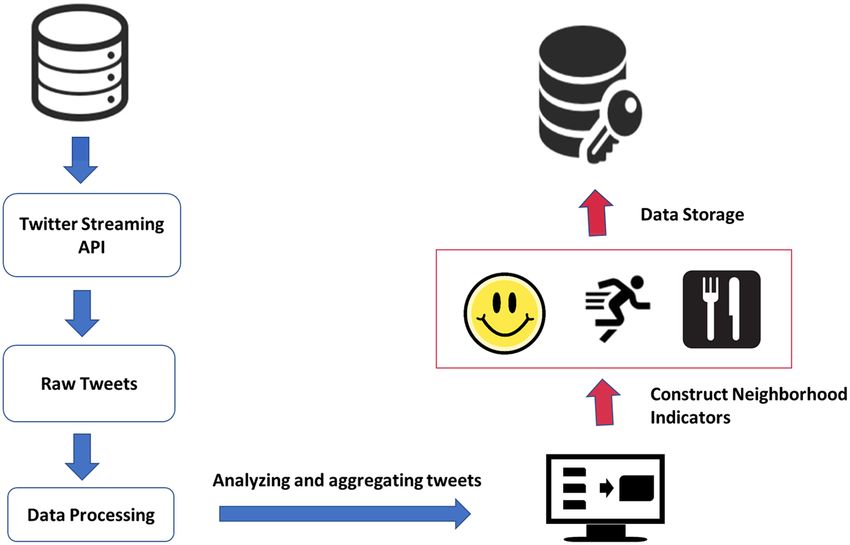
www.nature.com/scientificreports/

                              environment can therefore offer opportunities for social control, in regulating unhealthy behaviors and facilitat-
                              ing the social learning of healthy behaviors, but can also promote risky behaviors. Nonetheless, patterns observed
                              in one area may not be applicable to another as characteristics vary by location. One strategy for understanding
                              geographical disparities is through the use of pervasive and publicly available social media data.
                                  The scarcity of data on neighborhood characteristics greatly limits understanding of neighborhood effects on
                              health outcomes. Neighborhood data collection is expensive and time consuming, and then existing data are only
                              available for certain time periods or certain areas34. Widespread usage of the Internet and recordings of many
                              transactions (e.g., Yelp reviews, Foursquare check-ins, and reporting of personal opinions and behaviors through
                              social media) has led to the availability of massive amounts of data that enable understanding of previously hid-
                              den local area interactions. Social media are also being used to examine public health concerns. Researchers are
                              increasingly utilizing social media and user-generated data to track health behaviors and perform health surveil-
                              lance (e.g., for outbreak detection)35–39. Researchers have utilized social media to track sleep issues40, personal
                              health states disclosed by Twitter users41,42, and patient-perceived quality of care43. Information generated via
                              Twitter can be useful in the examination of beliefs, attitudes, and sentiment towards certain health topics (e.g.,
                              vaccines)44 as well as health-related activities and health status. Social learning theory posits that learning is a
                              cognitive process that occurs in a social context. Views and activities described via social media can help shape
                              perceived norms, attitudes, beliefs and subsequently, behaviors of people.

                              Study Aims and Hypotheses.             The aim of this study is to investigate associations between neighborhood
                              characteristics and chronic disease, while accounting for potentially confounding individual and zip code level
                              census characteristics. We create zip code level indicators of community happiness and social modeling of diet
                              and physical activity from tweets (utilizing the location information of where the tweet was sent). We then test
                              these sociocultural contextual factors as predictors of individual level health outcomes. We hypothesize that indi-
                              viduals living in communities that are happier and that model healthy eating and physical activity will have lower
                              prevalence of obesity and diabetes. Data from social media can help uncover prevalent personal attitudes, beliefs,
                              and health-related activities. Combining Twitter data with other sources can allow for the investigation of geo-
                              graphic disparities in health outcomes.
                                 We merge our Twitter data with large-scale administrative data from the state of Utah (driver licenses data
                              with self-reported anthropometrics; birth certificate data with information on birth weight, education, non-
                              white race, and Hispanic ethnicity). We examine obesity and diabetes diagnoses utilizing clinical data from the
                              University of Utah Health Sciences Center Enterprise Data Warehouse and Intermountain Healthcare’s Enterprise
                              Data Warehouse. In total, we examine the health outcomes of close to two million individuals in Utah.

                              Methods
                              Social media data collection and spatial joins.            From February 2015–April 2016, we utilized Twitter’s
                              Streaming Application Programming Interface (API) to continuously collect a random 1% sample of publicly
                              available tweets sent from Utah with latitude and longitude coordinates (n = 422,904). The Twitter API is freely
                              available to everyone and this API allows users free access to subsets of public tweets sent from anywhere in the
                              world. Users may request tweets for a certain geographic area, that contain a particular set of keywords, or just
                              random subsets of tweets.

                              Processing tweets. Each tweet was divided into tokens using the Stanford Tokenizer45, an open access soft-
                              ware tool that divides text into tokens, which roughly correspond to “words.” Below, we briefly describe algo-
                              rithms we utilized to create variables for happiness, and references to food and physical activity from tweets.
                              Please refer to our national trends paper for more details on methodology46.

                              Sentiment Analysis. To conduct sentiment analysis, we utilized MAchine Learning for LanguagE Toolkit
                              (MALLET)—a software program that characterizes the sentiment of text47. In order to train the software to ana-
                              lyze tweets, which differ from other types of text, we obtained labeled tweets from other research teams48–50.
                              MALLET uses these labeled tweets to learn what a human considers a “happy” or “unhappy” tweet. We then run
                              MALLET on our collection of tweets and it assigns to each tweet a probability ranging from 0 to 1 that the tweet
                              is happy. Higher predicted probabilities indicate higher certainty that the tweet is happy.
                                  To decide on a cut point for the MALLET predicted probability at which we would classify tweets as “happy,”
                              two coauthors manually labeled a random 1200 tweets. We computed accuracy levels at different cut points of
                              MALLET predicted probabilities. Using higher cut points improves the accuracy against human annotations but
                              also reduces the calculated prevalence of tweets deemed as happy. A MALLET probability of 0.80 achieves the
                              highest level of accuracy while still maintaining a prevalence of happy tweets of 19% (which approximates the
                              prevalence obtained by human annotations).

                              Food tweets. We compiled a list of over 1,430 popular food words from the U.S. Department of Agriculture’s
                              National Nutrient Database51. At the time of download, the USDA database had over 8000 foods listed. We
                              reduced the numbers of foods by eliminating second-level information, which is often not included in tweets. For
                              example, we did not distinguish between fruit juice that was canned, frozen or from concentrate. We also added
                              food dishes not food on the USDA list such as tiramisu by examining food lists from previous Twitter studies52
                              and food lists created by popular press53. Each food item was associated with a measure of caloric density, oper-
                              ationalized as calories per 100 grams. Fruits, vegetables, nuts, and lean proteins (e.g., fish, chicken, and turkey)
                              were labeled as “healthy foods” (340 food terms in total). Fried versions of foods (e.g., fried chicken, French fries)
                              were not considered healthy foods. Our food list also contained popular national fast food restaurants, such as

SCIENTIFIC REPOrTS | 7: 16425 | DOI:10.1038/s41598-017-16573-1                                                                                    2
www.nature.com/scientificreports/
Figure 1. Schematic diagram of data collection and processing of Twitter data. Twitter data was collected
using Twitter’s Streaming API. Each tweet was processed to extract its sentiment as well as its food and physical
activity mentions. The location information of where the tweet was sent was used to assign the tweet to its
corresponding zip code. We created neighborhood indicators by averaging for each zip code—the sentiment of
tweets, the frequency and type of food tweets, and the frequency of physical activity tweets. Blue arrow point to
steps in processing individual tweets while red arrows point to steps in processing aggregated tweets at regional
levels.
McDonald’s and Kentucky Fried Chicken (captured via 154 food terms including popular variations of restaurant
names) to enable quantification of fast food references.
To analyze food culture, each tweet was examined for words or phrases matching those on our list. Each food
item on our list was described by one or two words. Our text matching algorithm first searched over a tweet for
matches to two-word foods (e.g., orange chicken). It then searched over the remaining words for matches to
one-word food terms (e.g., taco). We computed caloric density by summing up all the foods mentioned in the
tweet.
Physical activity tweets. We created a list of physical activities using published lists of physical activity terms
gathered from physical activity questionnaires, compendia of physical activities, and popularly available fitness
programs54,55. Our physical activity list had 376 different activities that incorporate gym-related exercise (e.g.,
treadmill, weight lifting), sports (e.g., baseball), recreation (e.g., hiking, scuba diving) and household chores (e.g.,
gardening). We excluded popular phrases that generally do not relate to physical activity such as “walk away” and
“running late.” Using Metabolic Equivalents (METs) associated with physical activities, we quantified the exercise
intensity of each physical activity mention, scaled for a duration of 30 minutes and for a 155 pound individual,
which approximates the weight of an average American adult56–58.
Machine-labeled and manually-labeled tweets had a high level of accuracy: 78% for happiness, 83% for food
and 85% for physical activity for dichotomized labels, with the following F-scores: 0.86 (food), 0.90 (exercise),
and 0.54 (happiness). These variables (i.e. happiness, any food references, caloric density of foot tweets, healthy
food references, physical activity references) were then aggregated and summarized at the zip code level to create
zip code indicators of the social environment. Figure 1 provides schematic of our Twitter data collection and
processing steps.
Individual-level health data. Cohort (Utah adults): Our analytic sample consisted of adults aged 20 years and
older in 2015 living in Salt Lake City. We merged our neighborhood data with individual outcome data from the
Utah Population Database (UPDB). The UPDB is the only database of its kind in the United States and one of
the few in the world providing population-wide data for public health studies. Most families in Utah are repre-
sented in the UPBD. The central component of UPDB is the extensive set of Utah family histories with links to
demographic and medical data. The UPDB contains 19 million records for over 7.3 million individuals with links
to demographic (from state administrative records) and medical data (from participating hospitals and clinics).
The UPBD is a dynamic database that is updated annually by data contributors. New individuals are added to
the UPDB by merging genealogies with birth data. Multiple records for each individual are linked by a unique
person id. The UPDB can only be utilized for biomedical and health-related research. Confidentiality and privacy
of individuals is strictly protected. The UPDB is provided by the Pedigree and Population Resource (PPR) under
the direction of Dr. Ken Robert Smith.
Obesity: Obesity was defined dichotomously as body mass index (BMI) (kg/m2) ≥ 30 from Intermountain
Healthcare’s Enterprise Data Warehouse. If clinical BMI measurements were missing (42%) because the individ-
ual did not seek medical care with Intermountain, BMI data was supplemented by self-reported height and weight
extracted from Utah driver licenses. Utah law requires individuals to renew their driver license every five years
SCIENTIFIC REPOrTS | 7: 16425 | DOI:10.1038/s41598-017-16573-1 3www.nature.com/scientificreports/
and to renew in person every ten years. BMI data were drawn from the most recent driver license data available,
with dates that ranged from 2011–2017. Using these two data sources in combination (clinical BMI measure-
ments, Utah driver licenses), only 1% of individuals’ obesity status were missing.
Diabetes was assessed via diagnoses by a health care provider using ICD-9 (‘250.00’, ‘250.01’, ‘250.02’, ‘250.03’,
‘250.70’, ‘250.71’, ‘250.72’, ‘250.73’, ‘250.40’, ‘250.41’, ‘250.42’, ‘250.43’, ‘250.50’, ‘250.51’, ‘250.52’, ‘250.53’, ‘250.60’,
‘250.61’, ‘250.62’, ‘250.63’,) and ICD-10 codes (E11.40’, ‘E10.9’, ‘E10.29’, ‘E11.51’, ‘E11.29’, ‘E11.36’, ‘E10.36’, ‘E10.39’,
‘E10.51’, ‘E10.40’, ‘E10.65’, ‘E11.21’, ‘E11.319’, ‘E10.319’, ‘E11.65’, ‘E11.311’, ‘E11.39’, ‘E10.21’, ‘E10.311’, ‘E11.9’). In
addition, if available, lab values for glycated hemoglobin (HbA1c (%)) and fasting plasma glucose values (mg/
dL) were obtained. Sources of the clinic data included the University of Utah Health Sciences Center Enterprise
Data Warehouse (UUHSC EDW), Utah’s Department of Health inpatient and ambulatory surgery data, and
Intermountain Enterprise Data Warehouse. Patients were linked across files and sources via a Master Patient
Index.
Covariates. We included individual socio-demographic characteristics along with health/disease predisposi-
tions to adjust for potential confounding of the relationship between neighborhood environments and adult obe-
sity and diabetes. As a clarification, in the United States, race and Hispanic ethnicity are treated as different social
constructs following federal standards established by the 1997 Revisions to the Standards for the Classification
of Federal Data on Race and Ethnicity59. A person who is of Hispanic origin can be white or nonwhite. In our
analytic sample, most individuals who report Hispanic ethnicity are white (84%). The remainder of Hispanic
individuals report nonwhite race. In the analyses, we control for nonwhite race and Hispanic ethnicity. In total,
the following individual-level covariates were included: age (years), sex (male/female), marital status (married
vs. divorced/single), race (white/nonwhite), Hispanic ethnicity (yes/no), and education (less than high school,
high school, some college, college or greater). We utilized education information appearing on the Utah birth
certificates of their children (if any).
Indicator variables were created for missing data on individual level covariates. Zip code characteristics. We
utilized zip code boundaries as a working definition of neighborhoods. To assess whether our social environment
variables were associated with individual health outcomes above and beyond other zip code level characteristics,
we obtained five-year estimates (2011–2015) from the American Community Survey for the following zip code
level characteristics: population density, percent of the population 65 years and older, percent Hispanic, percent
black, and median household income. The study was approved by the University of Utah’s Institutional Review
Board and all methods were performed in accordance with the relevant guidelines and regulations. The study
utilized publically available big data sources as well as de-identified data from the Utah Population Database and
Intermountain Healthcare Data Warehouse (and thus informed consent was not relevant for the study).
Analytic Approach. Mapping. Each geolocated tweet we collected was assigned its corresponding zip code
using Python software (version 2.7.12). We created maps using ArcGIS Desktop Version 10.5 (ESRI, Redlands
CA, http://www.esri.com/arcgis/about-arcgis) and the 2016 U.S. Census TIGER/Line Shapefiles (https://www.
census.gov/geo/maps-data/data/tiger-line.html)60. We utilized natural breaks in the data to display spatial
patterns.
Regression modeling. To examine the relationship between neighborhood characteristics and individual-level
health outcomes, we merged administrative and medical records from the Utah Population Database to zip code
summaries of social environment characteristics derived from Twitter data and census data. Zip code character-
istics were categorized into tertiles and the lowest tertile was utilized as the referent level. We hypothesize that
individuals living in areas with more happy tweets and physical activity tweets would have lower obesity and
diabetes prevalence. Additionally, we hypothesize that individuals living in areas with higher caloric food tweets
would have worse health outcomes. We implemented log Poisson regression models to estimate associations
between neighborhood characteristics and chronic disease, accounting for individual sociodemographic char-
acteristics. Reported prevalence ratios represent comparisons between individuals in the 3rd tertile (vs. 1st tertile)
and 2nd tertile (vs. 1st tertile) for zip code characteristics. Because our analyses are cross-sectional, the results of
the log Poisson regression models are prevalence ratios (rather than risk ratios as would be the case of longitu-
dinal data). Higher prevalence ratios indicate that individuals living in zip codes in the 3rd and 2nd tertile have
higher chronic disease prevalence than those in the 1st tertile. Lower prevalence ratios indicate that individuals
living in zip codes in the 3rd and 2nd tertile have lower chronic disease prevalence than those in the 1st tertile.
We estimated prevalence ratios rather than odds ratios because prevalence ratios are arguably more interpretable;
this is because people are more likely to think in terms of probabilities such as 10% and 33% rather than their cor-
responding odds (1:9 and 1:2 odds)61. Additionally, odds ratios can overestimate prevalence ratios for common
outcomes62. Adjusted linear regression was utilized for continuous outcome variables such as body mass index
(kg/m2), fasting plasma glucose (mg/dL) and glycated hemoglobin (HbA1c; %). Positive values for linear regres-
sion results indicate higher BMI, fasting glucose, and HbA1c, while negative values indicate lower BMI, fasting
glucose, and HbA1c values. In sensitivity analyses, we utilized sibling random effects models to control for family
and background characteristics shared among siblings. For sibling random effects models, we examined how
siblings living in different neighborhood contexts may have different health outcomes.
Missingness on variables varied from less than 1% (obesity) to 39% (education). In sensitivity analyses, multi-
variate normal imputation was utilized to fill in missing values with predicted values based on information from
non-missing covariates (using the mi impute mvn command in Stata). Additionally, we stimulated extreme values
for missing data and examined impacts on estimates. Standard errors adjusted for clustering of zip code values
within a county. Statistical analyses were implemented with Stata MP13 (StataCorp LP, College Station, TX).
SCIENTIFIC REPOrTS | 7: 16425 | DOI:10.1038/s41598-017-16573-1 4www.nature.com/scientificreports/
N Mean (SD)
Zip code level Twitter characteristics
% of tweets that are happy 216 22.06 (11.13)
% of tweets about physical activity 183 3.06 (3.18)
Caloric density of food tweets 216 231.89 (94.94)
Individual-level characteristics
Age (years) 1,968,451 46.23 (17.37)
% Female 1,964,485 49.55 (50.00)
% Married 1,786,137 61.82 (48.58)
% Nonwhite 1,832,286 4.73 (21.23)
% White 1,832,286 95.27 (21.23)
% Hispanic ethnicity 1,703,412 11.05 (31.35)
% Less than high school 1,208,101 9.11 (28.77)
% High school 1,208,101 30.00 (45.83)
% Some college 1,208,101 31.90 (46.61)
% College or greater 1,208,101 28.99 (45.37)
% Obese 1,952,993 28.75 (45.26)
% Diabetes 1,968,451 5.22 (22.24)
Body mass index (kg/m2) 1,952,993 27.67 (6.52)
Fasting glucose (mg/dL) 137,589 94.91 (32.15)
Hemoglobin A1c (%) 382,100 6.06 (2.17)
Table 1. Descriptive characteristics for neighborhood and individual characteristics. Data sources: 422,904
geolocated tweets from Utah aggregated to the zip code level; Utah Population Database, University of Utah
Health Science Center Data Warehouse; Intermountain Healthcare Data Warehouse.
Data availability. Twitter-derived summaries of happiness, food and physical activity culture at the state,
county, zip code and census tract levels can be downloaded here: https://hashtaghealth.github.io/geoportal/start.
html.
Results
Table 1 presents descriptive statistics for zip code level and individual level characteristics. Across 216 zip codes
in Utah, the average prevalence of happy tweets was 22%. On average, 3.1% of tweets mentioned physical activ-
ity and 3.8% were related to food. The average caloric density of food tweets (per 100 grams) was 232 calories.
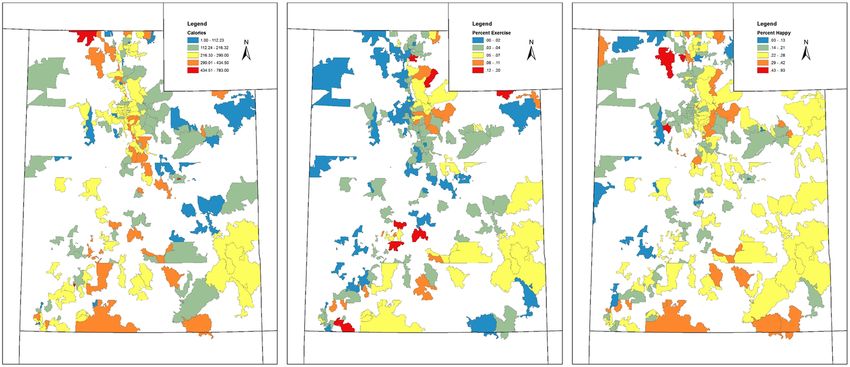
Figure 2 displays the geographic distribution of zip code summaries of Twitter-derived variables. At the zip code
level, the percentage of happy and physical activity tweets were weakly correlated, r = 0.35. All other correlations
had absolute values less than r = 0.11. Zip codes along the Utah - Idaho border in Box Elder County show a pat-
tern of higher calories, lower exercise and lower happiness percentages. Summit County and Wasatch County
are well known for their outdoor recreational activities and lifestyle, and these zip codes just east of the Salt Lake
Valley are moderately high in exercise and happiness and low in calories. Larger regional patterns also show that
zip codes in the Northwest corner of Utah are lower in exercise, whereas zip codes in the Northeast corner near
Vernal and Duchesne County have a cluster of low calories. The South and Southeastern areas of Utah have rela-
tively high percentages of happiness and they are classified as rural and frontier areas with many opportunities for
recreation, including hiking and camping.
Our analytic sample was restricted to adults 20 years and older in Utah; the mean age was 46 years old
(Table 1). The sample is equally divided by sex. About 62% were married and over 95% of individuals were white
and 11% were of Hispanic ethnicity (of any race). About 29% of individuals had a college degree or greater.
Obesity prevalence was about 29% and diabetes prevalence was about 5.2%.
We find that individuals living in zip codes with the highest percentages of happy tweets (PR = 0.88 (95%
CI: 0.81, 0.96) and physical activity tweets (PR = 0.91 (95% CI: 0.85, 0.97) had 9–12% lower obesity prevalence
(Table 2). Zip codes with the highest percentages of happy tweets and physical activity tweets also saw a reduction
in overweight status (eTable 1). More happy tweets in a zip code (PR = 0.91 (95% CI: 0.83, 0.99) was also associ-
ated with lower individual diabetes prevalence (Table 2). Higher caloric density of food tweets for a zip code was
related to higher diabetes prevalence. Individuals living in zip codes with the highest percentages of healthy food
tweets had lower obesity and diabetes prevalence (eTable 2). The abundance of fast food tweets in a zip code was
not related to individual obesity or diabetes. Analyses utilizing continuous BMI and fasting glucose (mg/dL) also
suggested a relationship between Twitter-derived positive social environment characteristics and lower chronic
disease (Table 2). Results were attenuated and non-significant for glycated hemoglobin (HbA1c (%)).
Variables with the most missing data included education level and Hispanic ethnicity. Using data imputation
and alternatively, extreme value substitution for missing values resulted in qualitatively very similar estimates
(eTable 3). We additionally adjusted for birth weight, a predisposing factor for obesity and diabetes63,64. Results
were qualitatively very similar (eTable 4), but the sample size was smaller because analyses were limited to adults
who were born in Utah and hence a birth certificate was available with birth weight.
SCIENTIFIC REPOrTS | 7: 16425 | DOI:10.1038/s41598-017-16573-1 5www.nature.com/scientificreports/
Figure 2. Geographic distribution of Twitter-derived zip code characteristics, Utah. Zip code summaries
of caloric density of tweets, percent of tweets about physical activity, and percent of tweets that are happy.
Choropleth maps were created using ArcGIS Desktop Version 10.5 (ESRI, Redlands CA, http://www.esri.com/
arcgis/about-arcgis) and the 2016 U.S. Census TIGER/Line Shapefiles (https://www.census.gov/geo/maps-data/
data/tiger-line.html).
Log Poisson Regression for dichotomous outcomes Linear regression for continuous outcomes
Obese Diabetes Body Mass Index (kg/m2) Fasting glucose (mg/dL) HbA1c (%)
Zip code level Twitter predictors Prevalence Ratio (95% CI)b Prevalence Ratio (95% CI)b Beta (95% CI)b Beta (95% CI)b Beta (95% CI)b
Happy tweets
3rd tertile (highest) 0.88 (0.81, 0.96) 0.91 (0.83, 0.99) −0.57 (−0.94, −0.21) −1.44 (−2.43, −0.44) −0.01 (−0.08, 0.07)
2nd tertile 0.94 (0.90, 0.98) 0.97 (0.95, 0.99) −0.34 (−0.56, −0.12) −0.86 (−1.44, −0.28) 0.01 (−0.09, 0.11)
Physical activity tweets
3rd tertile (highest) 0.91 (0.85, 0.97) 0.96 (0.88, 1.05) −0.39 (−0.71, −0.07) −0.87 (−2.30, 0.56) −0.08 (−0.19, 0.03)
2nd tertile 0.96 (0.93, 1.00) 1.00 (0.95, 1.05) −0.16 (−0.33, 0.01) −0.70 (−1.18, −0.21) 0.02 (−0.06, 0.10)
Caloric density of food tweets
3rd tertile (highest) 1.03 (0.98, 1.08) 1.08 (1.01, 1.16) 0.13 (−0.07, 0.34) 0.80 (0.10, 1.49) 0.02 (−0.04, 0.08)
2nd tertile 1.04 (1.00, 1.07) 1.13 (1.06, 1.20) 0.17 (0.03, 0.31) 0.76 (0.11, 1.41) 0.02 (−0.02, 0.06)
N 1,855,768 1,866,509 1,855,768 131,015 362,035
Table 2. Twitter-derived predictors of adult obesity and diabetes (Type 1 and Type 2)a. aData source for health
outcome: Utah Population Database and Intermountain Healthcare Enterprise Data Warehouse on Utah
adults 20 years and older. bAdjusted regression models were run for each outcome separately. For dichotomous
outcomes such as obesity and diabetes (0 = no; 1 = yes), log Poisson models were utilized. For continuous
variables like body mass index, linear regression was used. Models controlled for age, sex, nonwhite race,
Hispanic ethnicity, education, marital status as well as the following zip code area characteristics: population
density, percent of the population 65 years and older, percent Hispanic, percent black, and median household
income. Indicator variables were created for missing data on covariates. Twitter-derived characteristics were
categorized into tertiles, with the lowest tertile serving as the referent group. Standard errors adjusted for
clustering of values at the county level.
Sibling random effects models that are able to account for the full set of family background characteristics
shared between siblings additionally suggested relationships between social environment indicators and obesity
and diabetes. In sibling random effects models, more happy tweets and physical activity tweets in a zip code were
related to 7–8% reduction in obesity prevalence (Table 3).
Discussion
As demonstrated by a vast literature, environmental conditions (social, economic, physical characteristics of
places) are important determinants of health. The goal of this study was to test associations between social envi-
ronment factors and individual health outcomes. This study utilized unique data sources—Twitter data as well as
massive administrative and clinical data from the state of Utah. The unique nature of our database also allowed us
to implement rarely applied sibling random effects models that further account for shared family and background
characteristics. We found that individuals living in zip codes with more happy tweets, physical activity tweets, and
SCIENTIFIC REPOrTS | 7: 16425 | DOI:10.1038/s41598-017-16573-1 6www.nature.com/scientificreports/
Log Poisson Regression Linear Regression
Obese Diabetes Body Mass Index (kg/m2)
Built environment characteristics Prevalence Ratio (95% CI) b
Prevalence Ratio (95% CI) b
Beta (95% CI)b
Happy tweets
3rd tertile (highest) 0.92 (0.91, 0.93) 0.93 (0.90, 0.95) −0.40 (−0.44, −0.36)
2nd tertile 0.96 (0.95, 0.96) 0.98 (0.96, 1.00) −0.24 (−0.27, −0.20)
Physical activity tweets
3rd tertile (highest) 0.93 (0.92, 0.94) 0.99 (0.96, 1.02) −0.29 (−0.34, −0.25)
2nd tertile 0.96 (0.95, 0.97) 1.00 (0.98, 1.03) −0.15 (−0.19, −0.12)
Caloric density of food tweets
3rd tertile (highest) 1.02 (1.01, 1.03) 1.06 (1.03, 1.08) 0.07 (0.04, 0.11)
2nd tertile 1.03 (1.02, 1.04) 1.10 (1.07, 1.13) 0.16 (0.13, 0.19)
N 944,309 946,324 944,309
Table 3. Sibling random effects model results: Twitter predictors of individual health outcomes. aData source
for health outcome: Utah Population Database and Intermountain Healthcare Enterprise Data Warehouse
on Utah adults 20 years and older. bAdjusted regression models were run for each outcome separately. For
dichotomous outcomes such as obesity and diabetes (0 = no; 1 = yes), log Poisson models were utilized. For
continuous variables like body mass index, linear regression was used. Models controlled for age, sex, nonwhite
race, Hispanic ethnicity, education, and marital status as well as the following zip code area characteristics:
population density, percent of the population 65 years and older, percent Hispanic, percent black, and median
household income. Twitter-derived characteristics were categorized into tertiles, with the lowest tertile serving
as the referent group.
food tweets with lower caloric density had lower chronic disease prevalence. Our results were robust to a variety
of different model specifications. Findings provide initial evidence for targeted population health interventions
to improve the health of specific communities to decrease obesity and diabetes risk.
Studying finding in context. Social media is being leveraged for a variety of public health research activi-
ties including identifying individuals with mental health needs65, sleep disorders40 and providing timely informa-
tion on infectious disease outbreaks and spread66. Our study, which found associations between higher percentage
of physical activity tweets, align with the results of a study conducted by Chunara (2013) who found that locations
in the United States with more Facebook likes for physical activity had lower obesity rates67. Additionally, De
Choudhury and colleagues (2016) found places designated as food deserts which lack access to healthy foods, had
more Instagram posts of foods that are higher in fat, sugar, and cholesterol68. Previous studies have also linked
happiness to lower morbidity and mortality69.
Study strengths and limitations. This study is innovative because it demonstrates the utility and
cost-effectiveness of using “organic data” not produced for the primary purpose of research. Besides census data,
there are few national neighborhood datasets, especially on the social environment, and thus we leverage Twitter
data for the purpose of constructing sociocultural characteristics of neighborhoods. Health information on the
population of Utah is derived from sources that collect these data for their everyday functioning, which enables
our study to include more individuals than would be typically practical to collect for any single study. Lastly, the
study furthers our understanding of the potential influence of the social environment on health.
However, this study is subject to several limitations. The study capitalized on unique data sources for indi-
vidual characteristics and health outcomes that were available on residents of Utah. Utah has the youngest pop-
ulation, highest birth rate, and largest average household size in the U.S70. Additionally, the racial and ethnic
composition of Utah is not as diverse as the United States as a whole, but diversity has increased substantially
in recent decades. In 2013, 13.3% of Utah’s population was Hispanic and 8.3% were foreign-born, compared to
16.9% and 12.9% for the entire United States population respectively71. Finally, Utah has lower chronic disease
prevalence than most of the country; it is ranked number one and eleven in the United States for the lowest inci-
dence of diabetes and obesity respectively72,73. Thus, study results may not be generalizable to locations outside of
Utah. In future work, we will expand our analysis to the general U.S. population. Using for instance, residential
location information in the National Health Interview Survey (NHIS) to examine national patterns in the rela-
tionship between social environment characteristics derived from Twitter and individual health outcomes.
We aggregated data sources from health care institutions who deliver the majority of care in the state of Utah;
University of Utah Health Sciences Center and Intermountain Healthcare currently provide about 85% of the care
in the state of Utah. However, we may still be under- or over-estimating diagnoses of obesity and diabetes. The
diabetes registry did not distinguish between Type 1 and Type 2 diabetes mellitus but our analytic sample was
restricted to adults.
Another limitation was that analyses were cross-sectional, and thus the study was unable to evaluate longi-
tudinal or temporal trends. The analyses did not take into account residential histories and the length of time
individuals lived in their current communities. We found links between social environment characteristics (prev-
alent happiness, social modeling of health behaviors) and chronic disease risk—however, our study was unable to
SCIENTIFIC REPOrTS | 7: 16425 | DOI:10.1038/s41598-017-16573-1 7www.nature.com/scientificreports/
identify the directionality of associations. Populations that are healthier may also have happier Twitter posts and
may be more likely to socially model healthy behaviors.
For a given zip code, tweets sent from that zip code were utilized to construct indicators of happiness, food and
physical activity culture. However, tweets could be sent by both residents and visitors. Additionally, users of social
media tend to be younger than the general population; in 2016, 36% of individuals aged 18–29 years old used
Twitter compared to 21% of individuals 50–64 years and 10% among those 65+ years74. Nonetheless, adoption
rates of social media have been steadily increasing75. Importantly, mobile access to internet results in individuals
from all socioeconomic status tweeting74. Tweets also include information rarely found in other neighborhood
sources. Twitter users are composed of individuals as well as groups of individuals, organizations, companies
and news outlets. Thus, compiling such information may allow for a more comprehensive examination of the
social environment as well as community issues and needs. Nonetheless, using social media data, like other data
relies upon people’s willingness to report. The content of tweets reflects information that people feel comfortable
reporting and may not represent the true spectrum of their feelings or their experiences. Additionally, leveraging
big data sources for health research is relatively new, requiring further refinement as seen by Google Flu Trends—
which had difficulty accurately forecasting influenza76. To fully capitalize on emerging big data sources, further
assessment of potential biases and continued development new methods are needed.
Conclusions
In this study we investigated whether individuals living in social environments that have higher happiness and
more social modeling of healthy behaviors have lower rates of obesity and diabetes. We leverage population-wide
administrative and clinical data from large health care providers in the state of Utah to examine potential neigh-
borhood influences on individual health outcomes. We constructed neighborhood summaries from Twitter posts.
Individuals living in zip codes with high percentages of happy and physically-active tweets had lower obesity
prevalence. More happy tweets and lower caloric density of food tweets in a zip code were also linked with lower
diabetes. Findings suggest the possible influence of sociocultural factors on individual health. The study demon-
strates the utility and cost-effectiveness of utilizing existing big data sources to conduct population health studies.
Human participant protection. The University of Utah Institutional Review Board approved the study.
References
1. Morland, K., Wing, S., Diez Roux, A. & Poole, C. Neighborhood characteristics associated with the location of food stores and food
service places. American Journal of Preventive Medicine 22, 23–29, https://doi.org/10.1016/S0749-3797(01)00403-2 (2002).
2. Stafford, M. Pathways to obesity: identifying local, modifiable determinants of physical activity and diet. Social Science & Medicine
65, 1882–1897 (2007).
3. Wang, M. C., Kim, S., Gonzalez, A. A., MacLeod, K. E. & Winkleby, M. A. Socioeconomic and food-related physical characteristics
of the neighborhood environment are associated with body mass index. Journal of Epidemiology Community Health 61, 491–498
(2007).
4. Inagami, S., Cohen, D. A. & Finch, B. K. You are where you shop: grocery store locations, weight, and neighborhoods. American
Journal of Preventive Medicine 31, 10–17 (2006).
5. Christiansen, K. M. H., Qureshi, F., Schaible, A., Park, S. & Gittelsohn, J. Environmental Factors That Impact the Eating Behaviors
of Low-Income African American Adolescents in Baltimore City. Journal of Nutrition Education and Behavior 45, 652–660, https://
doi.org/10.1016/j.jneb.2013.05.009 (2013).
6. Zick, C. et al. Running to the store? The relationship between neighborhood environments and the risk of obesity. Soc Sci Med 69,
1493–1500 (2009).
7. Block, J. P., Scribner, R. A. & DeSalvo, K. B. Fast food, race/ethnicity, and income: A geographic analysis. American Journal of
Preventive Medicine 27, 211–217, https://doi.org/10.1016/j.amepre.2004.06.007 (2004).
8. Roemmich, J. N. et al. Association of access to parks and recreational facilities with the physical activity of young children. Preventive
Medicine 43, 437–441, https://doi.org/10.1016/j.ypmed.2006.07.007 (2006).
9. Brownson, R. C., Hoehner, C. M., Day, K., Forsyth, A. & Sallis, J. F. Measuring the Built Environment for Physical Activity: State of
the Science. American Journal of Preventive Medicine 36, S99–S123.e112, https://doi.org/10.1016/j.amepre.2009.01.005 (2009).
10. Smith, K. et al. Walkability and Body Mass Index: Density, design, and new diversity measures. Am J Prev Med 35, 237–244 (2008).
11. Brown, B. B. et al. Neighborhood Design for Walking and Biking: Physical Activity and Body Mass Index. American Journal of
Preventive Medicine 44, 231–238, https://doi.org/10.1016/j.amepre.2012.10.024 (2013).
12. Kowaleski-Jones, L., Fan, J. X., Wen, M. & Hanson, H. Neighborhood context and youth physical activity: Differential associations
by gender and age. American Journal of Health Promotion, https://doi.org/10.1177/0890117116667353 (2016).
13. Mujahid, M. S. et al. Relation between neighborhood environments and obesity in the multi-ethnic study of atherosclerosis.
American Journal of Epidemiology 167, 1349–1357 (2008).
14. Yen, I. H. & Kaplan, G. A. Poverty area residence and changes in physical activity level: Evidence from the Alameda County Study.
American Journal of Public Health 88, 1709–1712 (1998).
15. Ross, C. E. Walking, exercising, and smoking: Does neighborhood matter? Social Science and Medicine 51, 265–274 (2000).
16. Morland, K., Wing, S. & Roux, A. D. The contextual effect of the local food environment on residents’ diets: The atherosclerosis risk
in communities study. American Journal of Public Health 92, 1761–1767 (2002).
17. Milteer, R. M., Ginsburg, K. R. & Mulligan, D. A. The importance of play in promoting healthy child development and maintaining
strong parent-child bond: Focus on children in poverty. Pediatrics 129, e204–e213 (2012).
18. Black, J. L., Macinko, J., Dixon, L. B. & Fryer, J. G. E. Neighborhoods and obesity in New York City. Health & Place 16, 489–499,
https://doi.org/10.1016/j.healthplace.2009.12.007 (2010).
19. Diez-Roux, A. Bringing context back into epidemiology: variables and fallacies in multi-level analysis. American Journal of Public
Health 88, 216–222 (1998).
20. Macintyre, S., Maciver, S. & Sooman, A. Area, class and health: Should we be focusing on places or people. Journal of Social Policy
22, 213–233 (1993).
21. Duncan, C., Jones, K. & Moon, G. Context, composition and heterogeneity: using multilevel models in health research. Social
Science & Medicine 46, 97–117 (1998).
22. Pearlin, L. I. The Sociological Study of Stress. Journal of Health and Social Behavior 30, 241–256 (1989).
23. Johns, L. E. et al. Neighborhood social cohesion and posttraumatic stress disorder in a community-based sample: findings from the
Detroit Neighborhood Health Study. Soc Psychiat Epidemiol 47, 1899–1906 (2012).
SCIENTIFIC REPOrTS | 7: 16425 | DOI:10.1038/s41598-017-16573-1 8www.nature.com/scientificreports/
24. Oswald, A. J. & Powdthavee, N. Obesity, unhappiness, and the challenge of affluence: theory and evidence. Economic Journal
117(117), F441–154 (2007).
25. Bray, I. & Gunnell, D. Suicide rates, life satisfaction and happiness as markers for population mental health. Soc Psychiat Epidemiol
41, 333–337, https://doi.org/10.1007/s00127-006-0049-z (2006).
26. Tella, R. D., MacCulloch, R. J. & Oswald, A. J. The Macroeconomics of Happiness. The Review of Economics and Statistics 85,
809–827, https://doi.org/10.2307/3211807 (2003).
27. Blanchflower, D. G. & Oswald, A. J. Hypertension and happiness across nations. Journal of Health Economics 27, 218–233, https://
doi.org/10.1016/j.jhealeco.2007.06.002 (2008).
28. Dodds, P. S., Harris, K. D., Kloumann, I. M., Bliss, C. A. & Danforth, C. M. Temporal Patterns of Happiness and Information in a
Global Social Network: Hedonometrics and Twitter. PLoS ONE 6, e26752, https://doi.org/10.1371/journal.pone.0026752 (2011).
29. Di Tella, R. & MacCulloch, R. Gross national happiness as an answer to the Easterlin Paradox? Journal of Development Economics 86,
22–42, https://doi.org/10.1016/j.jdeveco.2007.06.008 (2008).
30. Pachucki, M. A., Jacques, P. F. & Christakis, N. A. Social network concordance in food choice among spouses, friends, and siblings.
American Journal of Public Health 101, 2170–2177 (2011).
31. Keating, N. L., O’Malley, A. J., Murabito, J. M., Smith, K. P. & Christakis, N. A. Minimal social network effects evident in cancer
screening behavior. Cancer 117, 3045–3052 (2011).
32. Rosenquist, J. N., Murabito, J., Fowler, J. H. & Christakis, N. A. The spread of alcohol consumption behavior in a large social
network. Annals of Internal Medicine 152, 426–433 (2010).
33. Mednick, S. C., Christakis, N. A. & Fowler, J. H. The spread of sleep loss influences drug use in adolescent social networks. PLoS One
e9775 (2010).
34. Peterson, R. D. & Krivo, L. J. National Neighborhood Crime Study (NNCS), http://www.icpsr.umich.edu/icpsrweb/RCMD/
studies/27501(2000).
35. Eysenbach, G. Infodemiology: Tracking Flu-Related Searches on the Web for Syndromic Surveillance. AMIA Annual Symposium
Proceedings 2006, 244–248 (2006).
36. Eysenbach, G. Infodemiology and Infoveillance. American Journal of Preventive Medicine 40, S154–S158, https://doi.org/10.1016/j.
amepre.2011.02.006 (2011).
37. Yepes, A. J., MacKinlay, A. & Han, B. Investigating Public Health Surveillance using Twitter. ACL-IJCNLP 2015, 164 (2015).
38. Nsoesie, E. O., Kluberg, S. A. & Brownstein, J. S. Online reports of foodborne illness capture foods implicated in official foodborne
outbreak reports. Preventive medicine 67, 264–269 (2014).
39. Woo, H. et al. Estimating Influenza Outbreaks Using Both Search Engine Query Data and Social Media Data in South Korea. J Med
Internet Res 18, e177, https://doi.org/10.2196/jmir.4955 (2016).
40. McIver, J. D. et al. Characterizing Sleep Issues Using Twitter. J Med Internet Res 17, e140, https://doi.org/10.2196/jmir.4476 (2015).
41. Nguyen, Q. C. et al. Leveraging geotagged Twitter data to examine neighborhood happiness, diet, and physical activity. Applied
Geography 73, 77–88, https://doi.org/10.1016/j.apgeog.2016.06.003 (2016).
42. Yin, Z., Fabbri, D., Rosenbloom, T. S. & Malin, B. A Scalable Framework to Detect Personal Health Mentions on Twitter. J Med
Internet Res 17, e138, https://doi.org/10.2196/jmir.4305 (2015).
43. Hawkins, J. B. et al. Measuring patient-perceived quality of care in US hospitals using Twitter. BMJ Quality & Safety, https://doi.
org/10.1136/bmjqs-2015-004309 (2015).
44. Bahk, C. Y. et al. Publicly available online tool facilitates real-time monitoring of vaccine conversations and sentiments. Health
Affairs 35, 341–347 (2016).
45. Stanford Natural Language Processing Group. Stanford Tokenizer, http://nlp.stanford.edu/software/tokenizer.shtml (2015).
46. Nguyen, Q. C. et al. Building a National Neighborhood Dataset From Geotagged Twitter Data for Indicators of Happiness, Diet, and
Physical Activity. JMIR Public Health Surveillance 2, e158, https://doi.org/10.2196/publichealth.5869 (2016).
47. Nigam, K., Lafferty, J. & McCallum, A. In IJCAI-99 workshop on machine learning for information filtering. 61–67 (1999).
48. Sentiment140. For Academics, http://help.sentiment140. com/for-students. Archived at: http://www.webcitation.org/6joQzyTSS (
49. Sanders Analytics. Twitter Sentiment Corpus, http://www.sananalytics.com/lab/twitter-sentiment/ (2011).
50. Kaggle in Class. Sentiment Classification, https://inclass.kaggle.com/c/si650winter11 (2011).
51. United States Department of Agriculture. National Nutrient Database, http://ndb.nal.usda.gov/ndb/search/
list?format=&count=&max=25&sort=&fg=&man=&lfacet=&qlookup=&offset=50 (2014).
52. Widener, M. J. & Li, W. Using geolocated Twitter data to monitor the prevalence of healthy and unhealthy food references across the
US. Applied Geography 54, 189–197 (2014).
53. App Spring Inc. List Challenges: Food, https://www.listchallenges.com/lists/food (2015).
54. Ainsworth, B. E. et al. 2011 Compendium of Physical Activities: A Second Update of Codes and MET Values. Medicine & Science in
Sports & Exercise 43, 1575–1581 (2011).
55. Zhang, N. et al. Electronic Word of Mouth on Twitter About Physical Activity in the United States: Exploratory Infodemiology
Study. J Med Internet Res 15, e261, https://doi.org/10.2196/jmir.2870 (2013).
56. Harvard Heart Letter. Vol. July 2004 (Harvard Health Publications, www.health.harvard.edu, 2004).
57. Ainsworth, B. E. et al. Compendium of physical activities: an update of activity codes and MET intensities. Medicine and science in
sports and exercise 32, S498–S504 (2000).
58. Harvard Health Publications. Calories burned in 30 minutes for people of three different weights, http://www.health.harvard.edu/
newsweek/Calories-burned-in-30-minutes-of-leisure-and-routine-activities.htm (2015).
59. U.S. Office of Management and Budget’s (OMB). (Whitehouse.gov, 1997).
® ®
60. United States Census Bureau. TIGER/Line Shapefiles and TIGER/Line Files, https://www.census.gov/geo/maps-data/data/tiger-
line.html (2016).
61. Simon, S. D. Understanding the Odds Ratio and the Relative Risk. Journal of Andrology 22, 533–536, https://doi.
org/10.1002/j.1939-4640.2001.tb02212.x (2001).
62. Knol, M. J., Cessie, S. L., Algra, A., Vandenbroucke, J. P. & Groenwold, R. H. H. Overestimation of risk ratios by odds ratios in trials
and cohort studies: alternatives to logistic regression. CMAJ 184, 895–899 (2012).
63. Yu, Z. B. et al. Birth weight and subsequent risk of obesity: a systematic review and meta-analysis. Obesity Reviews 12, 525–542,
https://doi.org/10.1111/j.1467-789X.2011.00867.x (2011).
64. Davey, R. X. Birthweight and Risk for Diabetes. Diabetes Care 25, 1886 (2002).
65. De Choudhury, M., Gamon, M., Counts, S. & Horvitz, E. In Proceedings of the 7th International AAAI Conference on Weblogs and
Social Media 2 (Boston, MA, 2013).
66. Nsoesie, E. O. & Brownstein, J. S. Computational Approaches to Influenza Surveillance: Beyond Timeliness. Cell host & microbe 17,
275–278 (2015).
67. Chunara, R., Bouton, L., Ayers, J. W. & Brownstein, J. S. Assessing the Online Social Environment for Surveillance of Obesity
Prevalence. PLOS ONE 8, e61373, https://doi.org/10.1371/journal.pone.0061373 (2013).
68. Choudhury, M. D., Sharma, S. & Kiciman, E. In Proceedings of the 19th ACM Conference on Computer-Supported Cooperative Work
& Social Computing 1157–1170 (ACM, San Francisco, California, USA, 2016).
SCIENTIFIC REPOrTS | 7: 16425 | DOI:10.1038/s41598-017-16573-1 9www.nature.com/scientificreports/
69. Koopmans, T. A., Geleijnse, J. M., Zitman, F. G. & Giltay, E. J. Effects of Happiness on All-Cause Mortality During 15 Years of
Follow-Up: The Arnhem Elderly Study. Journal of Happiness Studies 11, 113–124, https://doi.org/10.1007/s10902-008-9127-0
(2010).
70. Utah Department of Health. Utah Chronic Disease Prevention and Health Promotion State Plan, Partnering for a Healthy State,
2014 to 2020. Version 1.0., (Salt Lake City, Utah, 2013).
71. U.S. Census Bureau. State & County QuickFacts: Utah, http://quickfacts.census.gov/qfd/states/49000.html (2013).
72. Gallup-Healthways. 2015 State & Community Rankings for Incidence of Diabetes. (2015).
73. Gallup-Healthways. 2014 Obesity Rankings. (2014).
74. Greenwood, S., Perrin, A. & Duggan, M. Social Media Update 2016 (Pew Research Center, Washington, DC, 2016).
75. Duggan, M., Ellison, N. B., Lampe, C., Lenhart, A. & Madden, M. Social MediaUpdate 2014. (Available at: http://www.pewinternet.
org/files/2015/01/PI_SocialMediaUpdate20144.pdf, 2015).
76. Lazer, D., Kennedy, R., King, G. & Vespignani, A. Google Flu Trends still appears sick: An evaluation of the 2013–2014 flu season.
(2014).
Acknowledgements
This study was supported the National Institutes of Health’s Big Data to Knowledge Initiative (BD2K) grants
5K01ES025433; 3K01ES025433-03S1 (Dr. Nguyen, PI).
Author Contributions
Q.N. took the lead in designing the study, implementing analyses, and writing the manuscript. M.M. mapped the
data, created the online mapping tool, and edited the manuscript. W.Y. assisted with the analyses and edited the
manuscript. K.B., H.H., M.L., F.L., Y.W., J.V., M.W. and K.S. assisted with the design of the study and edited the
manuscript.
Additional Information
Supplementary information accompanies this paper at https://doi.org/10.1038/s41598-017-16573-1.
Competing Interests: The authors declare that they have no competing interests.
Publisher's note: Springer Nature remains neutral with regard to jurisdictional claims in published maps and
institutional affiliations.
Open Access This article is licensed under a Creative Commons Attribution 4.0 International
License, which permits use, sharing, adaptation, distribution and reproduction in any medium or
format, as long as you give appropriate credit to the original author(s) and the source, provide a link to the Cre-
ative Commons license, and indicate if changes were made. The images or other third party material in this
article are included in the article’s Creative Commons license, unless indicated otherwise in a credit line to the
material. If material is not included in the article’s Creative Commons license and your intended use is not per-
mitted by statutory regulation or exceeds the permitted use, you will need to obtain permission directly from the
copyright holder. To view a copy of this license, visit http://creativecommons.org/licenses/by/4.0/.
© The Author(s) 2017
SCIENTIFIC REPOrTS | 7: 16425 | DOI:10.1038/s41598-017-16573-1 10You can also read