Immersive Visualization for Materials Science Data Analysis using the Oculus Rift
←
→
Page content transcription
If your browser does not render page correctly, please read the page content below
Immersive Visualization for Materials Science
Data Analysis using the Oculus Rift
Margaret Drouhard∗ , Chad A. Steed∗ , Steven Hahn† , Thomas Proffen† , Jamison Daniel‡ , and Michael Matheson‡
∗ Computational Sciences and Engineering Division, Oak Ridge National Laboratory, Oak Ridge, TN 37831
Email: mdrouhard@acm.org, csteed@acm.org
† Neutron Data Analysis and Visualization Division, Oak Ridge National Laboratory, Oak Ridge, TN 37831
Email: hahnse@ornl.gov, tproffen@ornl.gov
‡ National Center for Computational Sciences, Oak Ridge National Laboratory, Oak Ridge, TN 37831
Email: danieljr@ornl.gov, mathesonma@ornl.gov
Abstract—In this paper, we propose strategies and objectives the Oculus Rift to provide intuitive interactions and efficient
for immersive data visualization with applications in materials navigation in an immersive 3D environment.
science using the Oculus Rift virtual reality headset. We provide This endeavor has been a collaborative effort with materials
background on currently available analysis tools for neutron
scattering data and other large-scale materials science projects. science experts as co-designers of the prototype system. We
In the context of the current challenges facing scientists, we describe our initial results toward integrating the Oculus
discuss immersive virtual reality visualization as a potentially Rift into existing visualization tools, and we address issues
powerful solution. We introduce a prototype immersive visual- that may affect the broader implementation of virtual real-
ization system, developed in conjunction with materials scientists ity immersive visualizations. Thus far, our experiments have
at the Spallation Neutron Source, which we have used to explore
large crystal structures and neutron scattering data. Finally, we encompassed virtual navigation of crystal structure data and
offer our perspective on the greatest challenges that must be exploration of a 3D-printed turbine blade imaged using the
addressed to build effective and intuitive virtual reality analysis CG-1D Cold Neutron Imaging Facility2 of the High Flux
tools that will be useful for scientists in a wide range of fields. Isotope Reactor at Oak Ridge National Laboratory (ORNL).
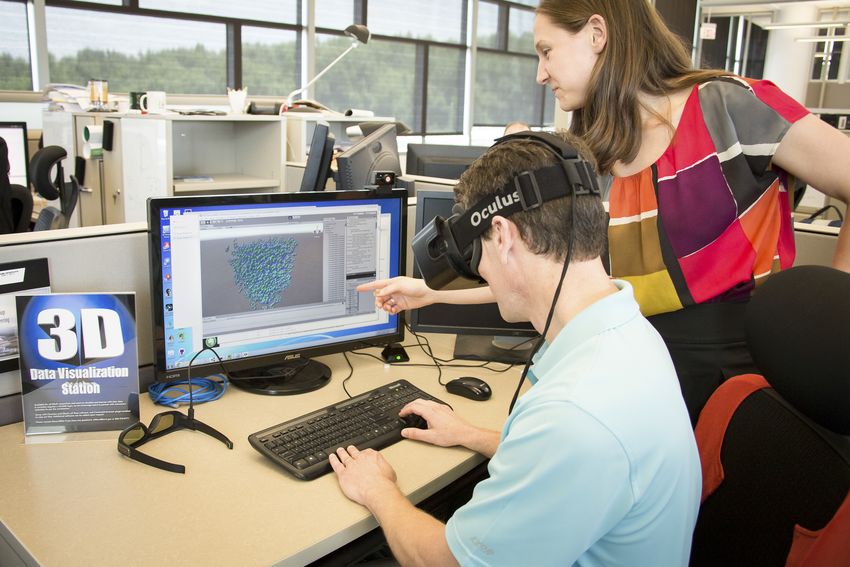
I. I NTRODUCTION We include gaze interaction to “bookmark” points of interest
in the data. We anticipate that these tools will assist researchers
In this work, we introduce an immersive visualization envi- in rapid data exploration and help them acquire near real-time
ronment for materials science data and discuss general strate- feedback for ongoing experiments. We also expect that the
gies for virtual reality applications in scientific research. Using immersive visualizations accessible through the Oculus Rift
an Oculus Rift head-mounted device (HMD), we demonstrate will facilitate collaborative investigation of complex data sets
exploratory visualizations of crystal structure and neutron and allow for the convenient sharing of knowledge.
scattering data sets. Currently, researchers have access to Beyond introducing our approach for immersive visualiza-
powerful three dimensional (3D) visualization tools, including tion, we identify key research questions and propose strategies
VMD [1], Mantid [2], and ParaView [3], allowing them to toward further development of virtual reality (VR) tools for
interactively explore large, complex scientific data and gen- scientific visualization and analysis. We suggest factors to
erate illuminating figures for communicating insight gleaned. consider when designing VR systems for scientific analysis
However, these tools have steep learning curves for standard purposes. We also pinpoint some of the key challenges that
usage, and navigation of the data is difficult, even for advanced must be addressed to enable safe, comfortable, and intuitive
users. Moreover, most views are limited to two dimensional experiences for diverse users. Finally, we address the human-
(2D) projections. The Oculus Rift1 integrates immersive 3D centered strategies that are necessary to discover the most
rendering with predictive head tracking [4], [5] to provide useful interfaces and interactions for analysis tasks. Using
intuitive comprehension and interaction with the data. In this a human-centered approach, we can leverage scientists’ a
project, our objective is to lower the barriers to entry for priori knowledge and analysis procedures with innovative
exploratory analysis of complex scientific data by leveraging representations and machine learning tools to gain greater
This manuscript has been authored by UT-Battelle, LLC under Contract No.
insight more efficiently than prior systems have allowed.
DE-AC05-00OR22725 with the U.S. Department of Energy. The United States
Government retains and the publisher, by accepting the article for publication, II. R ELATED W ORK
acknowledges that the United States Government retains a non-exclusive, paid-
up, irrevocable, worldwide license to publish or reproduce the published form Although much of the excitement about consumer level
of this manuscript, or allow others to do so, for United States Government VR centers on video game development, many scientific and
purposes. The Department of Energy will provide public access to these results
of federally sponsored research in accordance with the DOE Public Access engineering applications for immersive visualizations have
Plan (http://energy.gov/downloads/doe-public-access-plan).
1 Information about the Oculus Rift is available online at 2 More information about the facility is available at
https://www.oculus.com/en-us/rift/. https://neutrons.ornl.gov/imaging.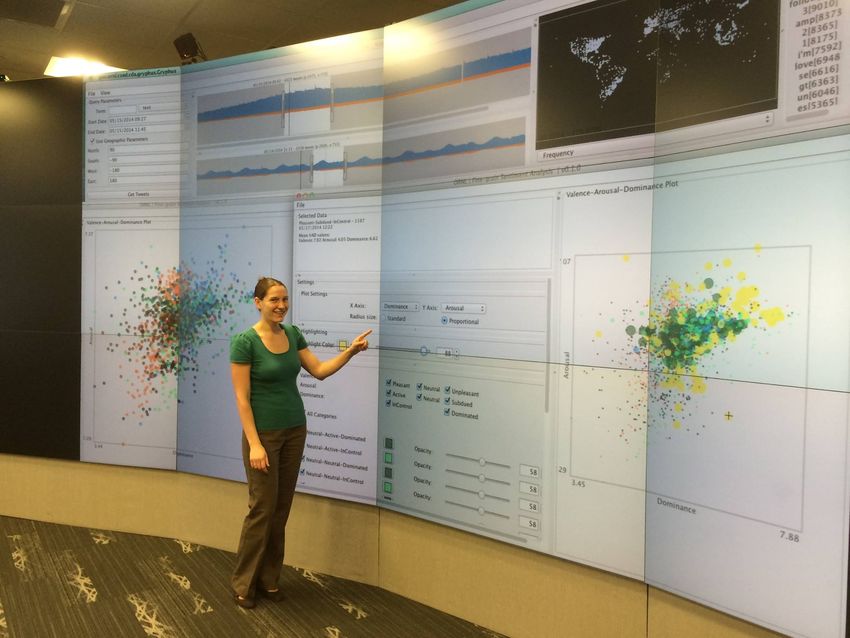
been explored. Medicine is one of the most extensively studied      user comfort and overall usability [12]. They examine how
areas for scientific visualization using VR. Richard Satava         traditional methods for 2D User interface/User Experience
has outlined several of the early uses of VR systems in             usability evaluation may be applied to VR interfaces. They
medical training and surgical pre-planning [6]. He describes        also discuss subjective measures that should be used to assess
how surgeons have used VR models to practice and prepare            VR applications, including user comfort and ease of use.
for tendon transplants, surgical correction of facial bone de-
                                                                                          III. BACKGROUND
formities, plastic surgery procedures, and radiation therapy for
tumors. An augmented reality system that fuses MRI scans               One of the most important barriers between performing
with real-time video from neurosurgery is also presented, as        an experiment and publishing the results is the complex and
well as surgical simulators for laparoscopic and abdominal          time-consuming effort that individual researchers apply to data
procedures. Van Dam et al. detail similar applications and          reduction, visualization and analysis. While the first neutron
argue that VR offers substantial advantages for nonhuman-           scatterers had to manually set up their instrument and record
scale visualization, particularly for data that should be ex-       neutron counts in handwriting a single point at a time, users at
plored in multiple time and space scales [7]. These functions       a modern time of flight spectrometer rapidly collect hundreds
are especially challenging for user interface design, the authors   of gigabytes of data in less than one day. Rapid reduction,
point out, but VR has the potential to display a larger quantity    analysis, and visualization provide feedback for users, helping
of meaningful data and facilitate more natural interaction than     them make optimal use of limited beam time. Traditional line
traditional 2D visualization techniques.                            plots and cuts become less effective for rapid exploration of
   Extensive research has been conducted regarding the per-         large multidimensional datasets.
ceptual mechanisms and analysis task strategies that affect            Software must also be accessible to and customizable by
how pattern-finding and analysis are performed in 3D, as            users with a broad range of abilities and interests in program-
opposed to 2D. Colin Ware points out that “the most powerful        ming. Facilities such as ORNL’s Spallation Neutron Source
pattern-finding mechanisms of the brain work in 2D, not             (SNS) support users with widely different levels of experience
3D” [8, p. 239]. Nevertheless, Ware argues that 3D user             and technical ability. Visualization and analysis software suites
interfaces are likely to predominate in the long run, since         must accommodate this range of users while maintaining the
humans are accustomed to perceiving, interacting with, and          capabilities to address important and challenging scientific
forming intuition about objects in a 3D world [8, p. 290]. A        questions.
study by Cockburn and McKenzie in 2002 indicated that 3D               Addressing today’s scientific questions requires the study
interfaces for document retrieval tasks hindered user perfor-       of materials with large, complex crystal structures. These
mance [9]. It should be noted that the virtual 3D environment       materials are described by large unit cells regularly containing
in the Cockburn-McKenzie study was a 2D projection of               tens to millions of atoms. Given such large structures, 2D
a 3D environment. However, regardless of the results with           projections severely hinder users’ ability to conceptualize the
virtual environments, users in this study sorted and retrieved      structures and to identify meaningful patterns or anomalies.
documents more quickly in a physical 2D environment than               The scattering function S(Q,ω) is often visualized using
in a physical 3D environment. This study demonstrates that          the software DAVE MSlice [13] and Horace [14], both of
3D environments are not inherently better suited to analysis        which are written in Interactive Data Language (IDL). While
than 2D environments, underscoring the need for human-              adequate for the facilities and instruments that existed when
centered design. When building 3D immersive visualizations,         they were initially developed, these legacy tools struggle to
researchers should carefully consider if a 3D VR environment        scale up to data generated by new instruments at current
is the most appropriate for a given task, and if so, which inter-   facilities. The Mantid Project [2] was started in 2007 at
actions should be implemented to best facilitate the analysis       ISIS3 , partially in response to the need for an integrated,
needs for that particular task.                                     maintainable, and high performance solution.
   Safety and usability should also be critically examined when        Mantid utilizes the multidimensional visualization capabili-
designing VR applications. Davis et al. present a survey of         ties of ParaView. A custom application called the Vates Simple
research on cybersickness, whose symptoms constitute some           Interface and a variety of plugins for the ParaView application
of the most pressing safety concerns for VR [10]. In their          come bundled with Mantid. Challenges include navigating
review, the authors address risk factors for cybersickness with     science requirements such as displaying the nonorthogonal
respect to individual users, VR devices, and tasks performed        basis vectors that describe complex crystal structures with a
in VR. They also summarize mechanisms for assessing the             general purpose library expecting Cartesian coordinates. Many
severity of cybersickness symptoms, including physiological         of the improvements are evolutionary instead of revolution-
studies and self-reporting through questionnaires, and they         ary. Interfaces are often derived from legacy software, with
propose strategies for mitigating the risks and severity of         improvements including tight integration with Mantid’s data
symptoms. Marks et al. highlight the importance of developing       reduction algorithms and higher performance.
metrics to systematically assess latency, one of the most sig-         3 ISIS is a pulsed neutron and muon source at the Rutherford Ap-
nificant factors contributing to cybersickness symptoms [11].       pleton Laboratory in Oxfordshire. More information is available at
Bowman et al. discuss mechanisms for the evaluation of both         http://www.isis.stfc.ac.uk/about/aboutisis.html.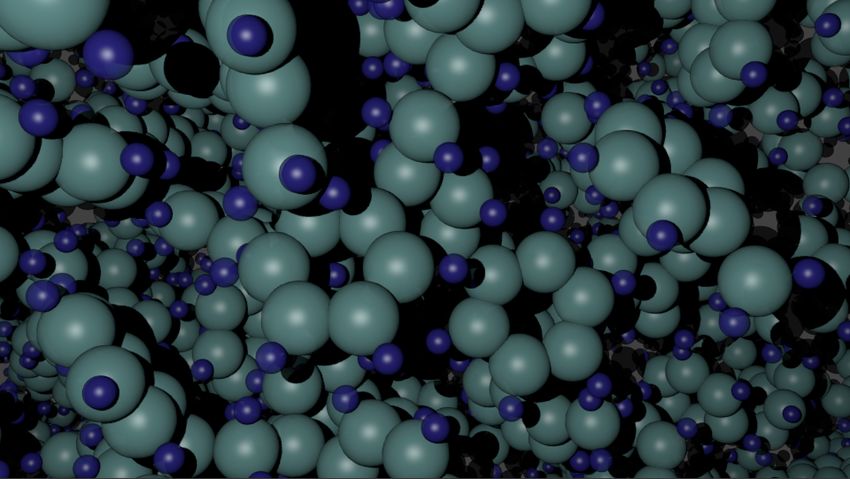
to immediately strengthen their understanding of their data.
                                                                        Ideally, scientists will be able to use the additional insight to
                                                                        ensure that their experiments are as productive and enlighten-
                                                                        ing as possible.
                                                                           For our applications in material science, our primary ob-
                                                                        jective is to provide users intuitive means for exploring their
                                                                        data in near real-time. As a proof of concept, we built our pro-
                                                                        totype immersive visualization for Oculus Rift using Blender
                                                                        modeling software [15] and the Unity game engine [16]. An
                                                                        outline of the development workflow is shown in Figure 1.
                                                                        In order to ensure low latency and provide feedback on the
                                                                        data as quickly as possible, we prioritized the formulation of
                                                                        a streamlined process for model creation and optimization.
  Fig. 1. Workflow for prototype immersive visualization environment.
                                                                        Models can be imported, optimized, and exported to formats
                                                                        compatible with Unity in minutes. We leveraged Unity’s
   Even though SNS, along with its partner institutions, main-          simplified development environment and built-in virtual reality
tains and provides support for Mantid and other analysis tools,         integration to rapidly implement and test various interactions.
challenges remain. Visualization is a particularly salient area            We imported crystal structure data from PDB and CIF for-
of need, as evidenced by some users acknowledging that they             mats, as well as neutron imaging data from VTK format. Using
“don’t look at their data enough.” Based on our observations            Blender and Atomic Blender [17], we created, experimented
and feedback from facility users, the two determining factors           with, and optimized meshes from the crystal structures for
in the adoption of new technologies are user-friendliness and           molecules consisting of up to 12,000 atoms. We also tested
performance and scalability for big data. The scientists who            procedural mesh generation in Unity for molecules composed
make use of specialized materials science facilities are experts        of up to 19,000 atoms. The Blender model imported with
in growing materials and in the operation of neutron scattering,        Atomic Blender in NURBS format and exported as an FBX
electron microscopy, or other appropriate instrumentation. The          object achieved the best synthesis of appearance and low
majority of these users have limited experience with visual-            latency, consistently performing at 30 fps. Figure 2 shows
ization and visual analytics tools. In order for them to use            renderings from models created using this technique.
such tools to gain insight about their data, the tools must have           Data from neutron imaging instruments proved more of a
sufficiently intuitive controls and minimal latency.                    challenge for modeling and optimization. The volume of neu-
   The development of our immersive visualization tool has              tron scattering data was significantly larger, and its volumetric
been motivated by the need for intuitive controls in an                 point cloud representation was not well-suited to prototyping
exploratory environment. Using a human-centered approach                in Unity. We relied on custom volume rendering software to
to design, we also aim for the tools to take advantage of               extract isosurfaces and create meshes from the volume data,
users’ a priori knowledge and analysis strategies. To encour-           which could then be reduced and optimized. The turbine blade
age adoption of new analysis tools, we must minimize the                shown in Figure 3 is an example of a mesh produced using this
learning curve for effective usage while leveraging Mantid’s            method. This turbine blade was created using 3D-printing, then
performance and specialized capabilities. We also anticipate            analyzed with neutron scattering to determine how closely the
that availability of meaningful visualization tools for materials       final product fit the original CAD model [18]. The extracted
science data will promote the sharing of knowledge in the field.        mesh depicted in Figure 3 was reduced to under one million
These objectives have guided our approach to development of             triangles for import into Unity. Though our proof of concept
VR tools for data visualization.                                        technique does not yet offer near real-time feedback, it would
                                                                        enable researchers to view their data within minutes, so the
                          IV. A PPROACH                                 knowledge gained could help refine experiments as they are
   Materials science data continues to proliferate rapidly as the       carried out, offering a substantial improvement over current
discipline grows and intersects with other fields. Due to the           timelines for analysis.
diversity of scientists and applications, many of the analysis             Coupled with timely feedback, intuitive interaction is the
techniques for materials science data are highly specialized.           most critical need for materials science data analysis tools.
Analysis tools such as VMD, Mantid, and ParaView offer                  Natural controls are particularly crucial in virtual reality
sophisticated features, but require significant training time for       environments where input may be limited. Oculus does not
proficiency. Rather than taking advantage of these tools at the         currently provide native hand tracking, but the Oculus Touch
SNS user facilities, most scientists utilizing the instruments opt      is slated to be released in the first half of 2016 [19]. We
to analyze their data after returning to their home institutions.       did not implement hand tracking, but mapped our navigation
Consequently, their analysis cannot be used to guide their              controls through Unity’s cross platform input manager. The
experimental controls. Our objective is to provide human-               cross platform input manager maps Xbox and other standard
centered analysis tools that visiting researchers can utilize           game controllers, but it allows for keyboard and mouse input as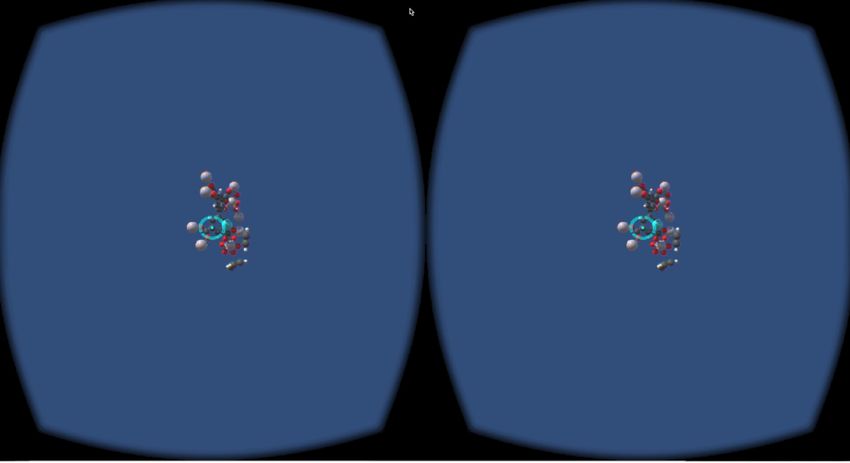
(a) Structure of C37 H95 B8 Cl5 Co4 N6 Si4, modeled and rendered in
Blender.

                                                                           Fig. 3. Mesh created by extracting isosurfaces from volumetric neutron
                                                                           scattering data of turbine blade. Custom software was used to extract and
                                                                           reduce the number of polygons in the mesh.

    (b) Structure of styrene toluene, modeled and rendered in Blender.

                                                                           Fig. 4. Demonstration of virtual reality exploration of crystal structure data
                                                                           at the Joint NSRC Workshop 2015: Big, Deep, and Smart Data Analytics in
                                                                           Materials Imaging.

                                                                           an alternative. At our demonstrations, we observed that many
                                                                           users had difficulty interacting with keyboard and mouse when
                                                                           they could not see their hands, but most users were able to use
                                                                           the Xbox controller intuitively. Figure 4 shows a demonstration
(c) Structure for a sample Metal-organic Framework, modeled and rendered
in Blender.
                                                                           of the first implementation of the prototype from the 2015 Joint
                                                                           NSRC Workshop on Big, Deep, and Smart Data Analytics in
Fig. 2. Crystal structure data modeled using Blender. We utilized Atomic   Materials Imaging. Users were able to “fly” through the data
Blender to import PDB models, and we experimented with optimization of
both NURBS and meshes to determine the best performing models for import   and, using the Oculus head-tracking, look around and view
into Unity.                                                                the data from different perspectives.
                                                                              Our immersive visualization also incorporates gaze interac-
                                                                           tion, arguably the most natural form of interaction in virtual
                                                                           reality environments. Since one of our objectives is to support
Developers of specialized visualization software used by SNS
are working to integrate support for the Oculus Rift into their
standard interface, and we have collaborated with them on
guiding principles for interactions in VR. Together with a
software engineering group at ORNL, we are also working
to integrate our prototype and other VR visualizations into
standard workflow tools used for scientific research.
V. V IRTUAL R EALITY FOR S CIENTIFIC V ISUALIZATION
A. Why now?
Enthusiasm for VR has risen and fallen several times in
recent decades. Will the current wave, like previous ones,
Fig. 5. Oculus Rift display with gaze interaction for crystal structure data. dissipate without sustainable and widely usable VR tools?
Since Oculus does not currently support eye tracking, crosshairs are used to Although there are no guarantees, we believe the current
help users target data points of interest and save locations.
surge of interest will endure primarily because both VR
hardware and software are now more accessible. Current head-
mounted devices (HMDs) are more portable and affordable
remote virtual collaboration, we focused on allowing users than CAVE environments or HMDs of the past, making them
to “bookmark” locations and data objects as an annotation ideal tools for exploratory visualization. This factor is unique
that allows other users to take the same “journey” through the to the current movement and could result in the widespread
data. Oculus does not support eye tracking, so gaze interaction utilization and democratization of VR technology.
is accomplished by tracking the center anchor of the Oculus The concept of a stereoscopic HMD was demonstrated at
field of view and using raycasting to determine whether any least as early as Ivan Sutherland’s device in 1965 [20]. After
data objects are encountered in that direction. In order to help decades of iterative development, the Oculus Rift is the first
users target objects more effectively, we provide a crosshair HMD to deliver satisfactory VR performance on commodity
reticle that is rendered visible when a button is pressed to enter hardware. Moreover, the API provided by Oculus, as well
“target mode.” When the button to exit target mode is pressed, as the integration packages for commonly used video game
the reticle is no longer rendered. While in target mode, a user engines, have removed many of the complexities of software
may save the current location of the avatar–including position development for VR. Since the release of the first Oculus
and orientation–using a trigger button. If, when the trigger prototype, several more HMD systems have been released,
button is pressed, the reticle is targeting a data object, the including the most affordable model, Google’s Cardboard
trigger also bookmarks that data object and highlights it in a VR [21].
contrast color. When the trigger button is pressed, the user’s The confluence of affordability, acceptable performance,
location is saved regardless of whether or not a data object is and straightforward development tools has created an ideal
bookmarked. As an alternative, a user may bookmark a data climate for innovation. These factors have encouraged in-
object and simultaneously save location using “extended gaze” tensive development by competing hardware manufacturers,
by focusing the reticle on the object of interest for longer experienced video game designers, and casual enthusiasts.
than the specified gaze period (two seconds by default). A A favorable corollary to the accessibility of HMD hardware
screenshot of the gaze interaction is shown in Figure 5. At and development tools is the increased familiarity that the
our demonstrations, the gaze interaction feature was intuitive technology attains with the general public. As the technology
to users, and only explanations of the buttons for entering and is introduced to more people, familiarity with VR interfaces
exiting target mode were required. expands, which in turn, reduces the learning curve for the
Our prototype immersive visualization has been well re- use of HMDs and further lowers the barriers to entry for
ceived by materials scientists at ORNL. The performance has development. All of these considerations have influenced our
been satisfactory, even for large models, and the controls approach to immersive visualization for scientific analysis. The
were intuitive. Researchers have been particularly impressed data visualization community should take advantage of the
by the ease of navigation through the data, since navigation feedback available from this broad base of new VR users and
through 3D data tends to be onerous when using 2D monitors. developers. Our application in particular stands to benefit from
We iterated several features of our design based on feedback this insight, since it targets users from various technical and
from demonstrations, and we received numerous suggestions scientific backgrounds.
for alternative uses of immersive visualizations in materials
science. B. Challenges and Design Strategies
In addition to developing the prototype tool using the Unity Over the course of our investigation, we have demonstrated
game engine, we are collaborating with software engineers the prototype to numerous scientists. In some cases, these
and developers of specialized visualization tools towards the encounters were one-time events, but with two materials
creation of more scalable and usable long-term solutions. science experts (who are also co-authors on this paper), thetesting occurred on a bi-weekly basis. By observing the scien- • Minimal latency
tists’ reactions, collecting feedback, and capturing our own Abrash asserts that all of these factors are critical for offering
observations, we have identified several key challenges for users a sense of presence and that subpar performance for
bringing new VR systems to bear for scientific visualization. any of them could cause cybersickness. He also enumerates
In the remainder of this section, we describe these challenges minimum specifications for each factor that, according to
and discuss our design strategies. research at Valve, provide adequate VR performance.
1) Safety, Comfort, and Ease of Use: The first and perhaps 2) Adaptive and Intuitive Interactions: Human interactions
most critical factors we considered were safety, comfort, and with the 3D environment should be both adaptive and intuitive
ease of use. Prompted by health warning screens on Oculus to minimize cognitive burdens on the user. It is important
applications and in the development kit’s documentation, we to understand what interactive capabilities are important for
studied ways to mitigate adverse effects as we designed natural each scientific use case to increase the usability of the system
interactions in VR. Cybersickness is a significant limitation and stimulate the adoption in scientific analysis scenarios. One
of the Oculus Rift system. The product documentation rec- way to improve usability is through less intrusive, longitudinal
ommends no more than 30 minutes of uninterrupted use and studies (e.g., interviews, diaries, paired analysis sessions) of
suggests 15 minutes for new users. Cybersickness is not a new the traditional ways scientists interact with their data. Also,
phenomenon [10], and best practices based on user studies as with any multi-disciplinary problem, we believe domain
are promoted to avoid it. However, beyond the immediate scientists should be tightly integrated in the design team. As
symptoms of cybersickness, questions remain as to the per- co-designers, they can directly use their domain knowledge
sisting short- and long-term effects. For example, we received and experience to shape the resulting system in meaningful
reports of delayed dizziness from some scientists up to an ways, which could escalate both adoption rates and overall
hour after brief exploration of a 3D mesh using the Oculus effectiveness of the resulting systems in the context of real-
Rift. Furthermore, co-authors of this paper have experienced world problems in data-rich domains.
nausea that lasted over 24 hours after prolonged use of a room- In the case of scientific analysis, the transition to a 3D
level stereoscopic display wall during development testing. environment can be difficult, as most scientists typically
Given the potential for more widespread use with current VR explore their data using 2D visualizations, and they have
equipment, we believe more studies are needed to carefully in- been doing so for decades. Careful thought should be devoted
vestigate potential health and safety issues. Specifically, these to ways to capture the essence of the most effective 2D
studies should address the most effective ways to mitigate interactions and bring them to bear in a 3D display. For
adverse effects and metrics to quantify whether a particular instance, scientists will often slice 3D volume data using 2D
application is sufficiently safe for a particular user. plane slices. How might we allow the scientist to intuitively
Another important safety issue is physical safety of the slice a 3D volume and visualize the result in a way that
location where the Oculus device is operated. As the user captures the immersive experience? We envision a 2D slicing
will be unable to see the real world surroundings, the area plane widget that can be controlled by the user’s gaze and
must be open and clear of hazards. Furthermore, as the Oculus hand gestures while providing the context of the overall 3D
system recommends, the user should be seated during device volume with a semi-transparent volume rendering. Slices could
operation, and an observer/spotter should be present to monitor be intuitively selected and grabbed to analyze, annotate, and
the user–particularly for new users. save for later use in a supporting knowledge repository. If
In our investigation we noted that latency has a significant the user is also presented with supplemental 2D plots in
effect on the user experience. When rendering lags, user the viewer’s peripheral area, will the display produce user
discomfort rapidly increases, which degrades performance and, discomfort or increased efficiency? If it is the former, it could
ultimately adoption potential. In the context of big data, the be advantageous to devise representations that are consistent
latency effect will be a key challenge to overcome. The with the virtual world in which the user is immersed, but
most viable strategy to overcome latency is through optimized with interactions that capture the essence of established 2D
rendering algorithms and multi-scale representations running interactions.
on powerful graphics hardware. In addition to minimizing la- We believe the answers to these and other questions related
tency, Michael Abrash has outlined the other hardware factors to VR interaction for scientific analysis will be answered
that must be addressed to avoid cybersickness risks [22]. He through studies of human-centered scientific analysis. The
describes the need for each of the following: resulting theories will inform the development of new inter-
• Wide field of view active VR prototypes that can be further studied for practical
• Sufficient resolution use. Likewise, studies of these prototypes will then contribute
• Low pixel persistence to new design iterations that will lead to more relevant and
• High refresh rate useful systems. Some of the research in this area focuses
• Displays illuminating all pixels simultaneously (global on Information-rich Virtual Environments (IRVEs), which
display) enhance virtual environments created to display data whose
• Excellent optics and capabilities for optical calibration spatial relationships are tied to physical features of the data.
• Precise tracking These virtual environments leverage information visualizationand human gesture interaction. The EVEREST display wall
is shown in Figure 6. Smaller scale GPU clusters are envi-
sioned at scientific data analysis facilities to allow interactive
exploratory investigations at the location where the data is
generated.
4) Integrating Automated Analytics (Big Data): In con-
junction with intuitive interactions and powerful computing
technology, we can collect human feedback to feed real-time
machine learning algorithms that assist the user for large data
sets. Often called intelligent user interfaces, such systems
leverage human interactions to label data, infer importance
using multiple feature spaces, and ultimately feed the construc-
tion of a model to predict what is of interest to the user. This
online recommender system can then be leveraged to highlight
or filter potentially important associations and data items. For
example, we can make the potentially important associations
that are found with the machine learning algorithms more
Fig. 6. EVEREST facility for analysis and visualization. EVEREST features
a 37 mega-pixel display wall that accommodates stereoscopic views and can visually salient using pre-attentive processing guidelines from
track a user throughout the room. perceptual psychology. For large, complex data sets where
manual inspection is either undesirable or impossible, this
approach can be a game-changer as it lets the user focus on
techniques to encode additional information about data into the most interesting data, which are defined by the user during
3D virtual environments beyond explicit representations of the analysis session.
the data’s spatial properties. Bowman et al. describe poten- In our prototype, we capture the user’s gaze to se-
tial applications and early research strategies in the area of lect/highlight geometries of interest. If the user focuses the
IRVEs [23], and Polys et al. delve deeper into the depth and gaze for an extended period of time, the object is highlighted
gestalt cues that affect analysis tasks within these environ- and saved. In conjunction with gestural inputs, this method can
ments [24]. User studies on IRVEs and other human- centered be used to label an item as relevant in the display. Variations to
strategies for exploration and analysis in virtual environments the interaction can be used to label other items irrelevant. The
will help guide the features that are prioritized in immersive two classes of items, relevant and irrelevant, can then be used
visualizations for scientific analysis. to predict the relevance of the remaining unlabeled elements.
3) Computational Challenges (Big Data): In general, the Through visual cues, the system could then highlight the
volume and complexity of scientific data sets continues to potentially relevant items or, conversely, hide the potentially
increase at an unprecedented rate, which fuels the current irrelevant items.
attention to big data analysis. As computational power in- In light of big data challenges in science, this guided
creases and the associated costs decrease, data sets produced analysis concept has become a necessity rather than an option.
in scientific experiments and simulations also increase in By leveraging both automated analytics and human-centered
complexity and volume. Given the importance of latency in analysis, the resulting system can tackle challenges neither
VR experiences, we must harness the increasing power of could solve easily in isolation. We believe this approach can
computational machinery for big data analytics that reduce also be used to improve latency, as we could remove irrelevant
latency, particularly with the largest data sets. With point items. We also envision such a system could maintain a
clouds and volume visualizations, we can leverage decades knowledge repository that stores human labels, algorithmic
of computer graphics research to implement level-of-detail predictions, decisions, and results. Such a knowledge repos-
rendering with optimized indexing and aggregation schemes itory can be built from expert users to provide guidance to
that throttle the number of graphical primitives rendered based novice users and improve initial investigations of new datasets
on the virtual proximity of user’s viewpoint [25]. There have based on the similarities and results of prior work.
been several rendering optimization schemes proposed for 5) Increasing the Adoption of VR in Scientific Domains:
computer games, simulations, and scientific visualization. We noted that VR has risen and fallen in waves over the
In addition, we believe there is the potential to leverage dis- last few decades. Today, the accessibility of VR equipment
tributed rendering and analytical processing so that the display such as the Oculus Rift, promises to provide a more long-
system is not burdened with the full rendering workflow. For lasting, transformative effect. To ensure that we do not waste
example, we have explored ways to remotely render extreme this opportunity, we must consciously explore ways to increase
scale scientific data using GPUs on the Titan supercomputer in the adoption of VR in the scientific domains. We noted earlier
the Oak Ridge Leadership Computing Facility (OLCF). The that intuitive interactions that are modeled after long-standing
resulting images can then be displayed on a 37 mega-pixel analysis practices may help reduce the time for training
display wall, called EVEREST, with stereoscopic rendering and adoption of these systems. Other practical considerationsinclude incorporation of the domain scientists into the design couraged by the performance we have obtained with our
process, connections to real-world scientific domains with prototype system, and the feedback we have received from
pressing big data challenges, and smart designs that lever- domain scientists is overwhelmingly positive. We anticipate
age both human and computer strengths. Another practical that continued development of intuitive interaction features
consideration is the communication of results and training will further broaden the field of scientists who can gain insight
information for domain scientists. The disconnect between the and share knowledge using VR tools.
latest visualization advances and scientific analysis techniques
ACKNOWLEDGMENTS
has long been an issue for many scientific domains.
Also, we must validate the new systems using metrics This work is sponsored by Oak Ridge National Laboratory
and studies that are understood in the scientific domain as LDRD project No. 7409. A portion of this research at ORNL’s
well as the Human-Computer Interaction (HCI) and visualiza- High Flux Isotope Reactor and Spallation Neutron Source was
tion domains. Human subject studies and newer longitudinal sponsored by the Scientific User Facilities Division, Office of
studies are the gold standard for validating new visualiza- Basic Energy Sciences, US Department of Energy.
tion techniques. However, in the scientific community, more R EFERENCES
quantifiable metrics such as reduced knowledge discovery
[1] W. Humphrey, A. Dalke, and K. Schulten, “Vmd: visual molecular
timelines, use cases that identify discoveries that VR enabled, dynamics,” Journal of molecular graphics, vol. 14, no. 1, pp. 33–38,
and rates of adoption among the expert users carry more 1996.
weight. As most of the research in new VR technologies will [2] O. Arnold, J.-C. Bilheux, J. Borreguero, A. Buts, S. I. Campbell,
L. Chapon, M. Doucet, N. Draper, R. F. Leal, M. Gigg et al., “Mantid—
be performed in the visualization and HCI communities, we data analysis and visualization package for neutron scattering and µ sr
assume the former evaluations will be executed. However, experiments,” Nuclear Instruments and Methods in Physics Research
the community should also ensure equal treatment of more Section A: Accelerators, Spectrometers, Detectors and Associated Equip-
ment, vol. 764, pp. 156–166, 2014.
practical evaluations that may be more convincing to the [3] U. Ayachit, The ParaView Guide: A Parallel Visualization Application.
scientific community. Likewise, more traditional HCI study Kitware, Inc., 2015.
results should be published in scientific venues in an accessible [4] V. Oculus, “Oculus rift-virtual reality headset for 3d gaming,” URL:
http://www. oculusvr. com, 2012.
manner to educate future users. [5] S. LaValle, A. Yershova, M. Katsev, and M. Antonov, “Head tracking
for the oculus rift,” in 2014 IEEE International Conference on Robotics
VI. C ONCLUSION AND F UTURE W ORK and Automation (ICRA), May 2014, pp. 187–194.
[6] R. M. Satava, “Medical applications of virtual reality,” Journal of
In the future, we plan to move our Unity-based prototype Medical Systems, vol. 19, no. 3, pp. 275–280, 1995.
to a more scalable solution with hardware acceleration that [7] A. Van Dam, D. H. Laidlaw, and R. M. Simpson, “Experiments in
renders directly to the Oculus Rift display. We have already immersive virtual reality for scientific visualization,” Computers &
Graphics, vol. 26, no. 4, pp. 535–555, 2002.
implemented a system that renders to the ORNL EVEREST [8] C. Ware, Information Visualization: Perception for Design, ser.
display using the full 37 million pixel resolution. An alter- Interactive Technologies. Elsevier Science, 2012. [Online]. Available:
native solution is to integrate Oculus support into a high http://books.google.com/books?id=UpYCSS6snnAC
[9] A. Cockburn and B. McKenzie, “Evaluating the effectiveness of spatial
performance visualization system such as ParaView or VISIT. memory in 2d and 3d physical and virtual environments,” in Proceedings
In either scenario, our goal is to develop a more generalized of the SIGCHI Conference on Human Factors in Computing Systems,
system that supports alternative immersive displays and incor- ser. CHI ’02. New York, NY, USA: ACM, 2002, pp. 203–210.
[Online]. Available: http://doi.acm.org/10.1145/503376.503413
porates hand-tracking to offer more natural interactions. We [10] S. Davis, K. Nesbitt, and E. Nalivaiko, “A systematic review of
also plan to investigate the inclusion of methods drawn from cybersickness,” in Proceedings of the 2014 Conference on Interactive
the information visualization community, such as details-on- Entertainment, ser. IE2014. New York, NY, USA: ACM, 2014, pp. 8:1–
8:9. [Online]. Available: http://doi.acm.org/10.1145/2677758.2677780
demand, context maps, provenance tracking, and user annota- [11] S. Marks, J. E. Estevez, and A. M. Connor, “Towards the
tions in immersive systems. holodeck: Fully immersive virtual reality visualisation of scientific and
Another promising area for future study is a collaborative engineering data,” in Proceedings of the 29th International Conference
on Image and Vision Computing New Zealand, ser. IVCNZ ’14.
VR system that allows users at different locations to interact New York, NY, USA: ACM, 2014, pp. 42–47. [Online]. Available:
and explore scientific data. Collaborative visualization with http://doi.acm.org/10.1145/2683405.2683424
VR displays is particularly desirable at one-of-kind user fa- [12] D. A. Bowman, J. L. Gabbard, and D. Hix, “A survey of usability
evaluation in virtual environments: classification and comparison of
cilities such as the ORNL SNS. If distributed collaborative methods,” Presence: Teleoperators and Virtual Environments, vol. 11,
analysis were possible, faculty at the home institution for a no. 4, pp. 404–424, 2002.
given research project could collaborate remotely with peers [13] R. T. Azuah, L. R. Kneller, Y. Qiu, P. L. Tregenna-Piggott, C. M. Brown,
J. R. Copley, and R. M. Dimeo, “Dave: a comprehensive software suite
and students at the user facility as the experiment is running, for the reduction, visualization, and analysis of low energy neutron
which would increase efficiency and reduce knowledge discov- spectroscopic data,” Journal of Research of the National Institute of
ery timelines. Finally, we believe additional research is needed Standards and Technology, vol. 114, no. 6, pp. 341–358, 2009.
[14] S. . T. F. C. ISIS, “Horace,” http://horace.isis.rl.ac.uk/, 2015.
to develop practical workflows in collaboration with both [15] Blender Online Community, Blender, Blender Foundation, Blender
software engineers and computational scientists to increase the Institute, Amsterdam, 2015. [Online]. Available: http://www.blender.org
adoption within the scientific community. [16] U. Technologies, “Unity 5,” http://unity3d.com, 2015.
[17] C. Barth, “Atomic blender - utilities,”
Immersive virtual reality environments hold tremendous http://wiki.blender.org/index.php/Extensions:2.6/Py/Scripts/Import-
promise for scientific visualization applications. We are en- Export/PDB, August 2014.[18] T. Watkins, H. Bilheux, K. An, A. Payzant, R. Dehoff, C. Duty, W. Peter,
C. Blue, and C. Brice, “Neutron characterization,” Advanced Materials
& Processes, p. 23, 2013.
[19] M. Swider, “Oculus touch sends both of your hands in to rift’s virtual
reality,” [Online. Published June 11, 2015], June 2015.
[20] I. E. Sutherland, “The ultimate display,” Multimedia: From Wagner to
virtual reality, 1965.
[21] Google, “Google cardboard,” https://www.google.com/get/cardboard/,
June 2014.
[22] M. Abrash, “What vr could, should, and almost certainly will
be within two years,” [Powerpoint Slides and Presentation Notes.
http://media.steampowered.com/apps/steamdevdays/slides/vrshouldbe.pdf],
January 2014.
[23] D. A. Bowman, C. North, J. Chen, N. F. Polys, P. S. Pyla, and
U. Yilmaz, “Information-rich virtual environments: Theory, tools,
and research agenda,” in Proceedings of the ACM Symposium on
Virtual Reality Software and Technology, ser. VRST ’03. New
York, NY, USA: ACM, 2003, pp. 81–90. [Online]. Available:
http://doi.acm.org/10.1145/1008653.1008669
[24] N. F. Polys, D. A. Bowman, and C. North, “The role of depth and gestalt
cues in information-rich virtual environments,” International journal of
human-computer studies, vol. 69, no. 1, pp. 30–51, 2011.
[25] J. H. Clark, “Hierarchical geometric models for visible surface
algorithms,” Commun. ACM, vol. 19, no. 10, pp. 547–554, Oct. 1976.
[Online]. Available: http://doi.acm.org/10.1145/360349.360354You can also read