The World Optical Depth Research and Calibration Center (WORCC) quality assurance and quality control of GAW-PFR AOD measurements - GI
←
→
Page content transcription
If your browser does not render page correctly, please read the page content below
Geosci. Instrum. Method. Data Syst., 7, 39–53, 2018
https://doi.org/10.5194/gi-7-39-2018
© Author(s) 2018. This work is distributed under
the Creative Commons Attribution 4.0 License.

The World Optical Depth Research and Calibration
Center (WORCC) quality assurance and quality control of
GAW-PFR AOD measurements
Stelios Kazadzis, Natalia Kouremeti, Stephan Nyeki, Julian Gröbner, and Christoph Wehrli
Physikalisch-Meteorologisches Observatorium Davos, World Radiation Center (PMOD/WRC) Dorfstrasse 33,
7260 Davos Dorf, Switzerland

Correspondence: Stelios Kazadzis (stelios.kazadzis@pmodwrc.ch)

Received: 10 October 2017 – Discussion started: 23 October 2017
Revised: 19 December 2017 – Accepted: 1 January 2018 – Published: 2 February 2018

Abstract. The World Optical Depth Research Calibration             Junge (1952) studied the relationship between particle vol-
Center (WORCC) is a section within the World Radiation             ume and aerosol number size distribution. They have mainly
Center at Physikalisches-Meteorologisches Observatorium            set the theoretical basis for studying aerosol extinction. How-
(PMOD/WRC), Davos, Switzerland, established after the              ever, Volz (1959) have developed a Sun photometer that
recommendations of the World Meteorological Organization           is able to measure atmospheric turbidity at different wave-
for calibration of aerosol optical depth (AOD)-related Sun         lengths using filters, used in the first US (Volz, 1969) and the
photometers. WORCC is mandated to develop new methods              first European (Flowers, 1969) networks of turbidity mea-
for instrument calibration, to initiate homogenization activ-      surements. Since then various sites have included AOD mea-
ities among different AOD networks and to run a network            surements in their monitoring schedules, constructing long-
(GAW-PFR) of Sun photometers. In this work we describe             term series of AOD (e.g., Barreto et al., 2014; Weller and
the calibration hierarchy and methods used under WORCC             Gericke, 2005; Nyeki et al., 2012). Most of these measure-
and the basic procedures, tests and processing techniques in       ments are site specific, with little relevance to long-term trend
order to ensure the quality assurance and quality control of       analysis on a global scale. However, more recently, several
the AOD-retrieved data.                                            multiyear spatial studies (Holben, 2001; Che et al., 2015;
                                                                   Mitchell et al., 2017) have been conducted.
                                                                      The World Meteorological Organization (WMO) insti-
1   Introduction                                                   gated the Global Atmosphere Watch (GAW) program in 1989
                                                                   as a successor to the Background Air Pollution Monitoring
Aerosols in the atmosphere, through direct and indirect ef-        Network (BAPMoN). In 1993 (WMO, 1993) it was recom-
fects, mainly result in a cooling contribution to the global ra-   mended that AOD measurements, conducted previously un-
diation balance (IPCC, 2013). The parameter that describes         der BAPMoN, should be discontinued until new instruments,
their integrated optical attenuation is the aerosol optical        methods and protocols could be established to collect AOD
depth (AOD), which can be derived by measurements of               data of known and assured quality. Based on a recommen-
the sunlight transmittance (WMO, 2016b). AOD has been              dation by GAW experts, the World Optical Depth Research
used in case studies and local studies in order to characterize    Calibration Center (WORCC) was established in 1996 at the
aerosols and assess atmospheric pollution and the aerosol-         PMOD/WRC in Switzerland. WORCC has since been ad-
related radiative forcing.                                         vised by the GAW Scientific Advisory Group for Aerosols.
   Atmospheric extinction of sunlight has been studied             Fifteen existing GAW stations were chosen for the deploy-
for at least 250 years by P. Bouger (http://glossary.              ment and operation of 12 N-type precision filter radiometers
ametsoc.org/wiki/Bouguer_s_law). Linke (1942) studied tur-         (PFRs; manufactured by PMOD/WRC) (Wehrli, 2000), pro-
bidity, Angström (1929) studied extinction power law and

Published by Copernicus Publications on behalf of the European Geosciences Union.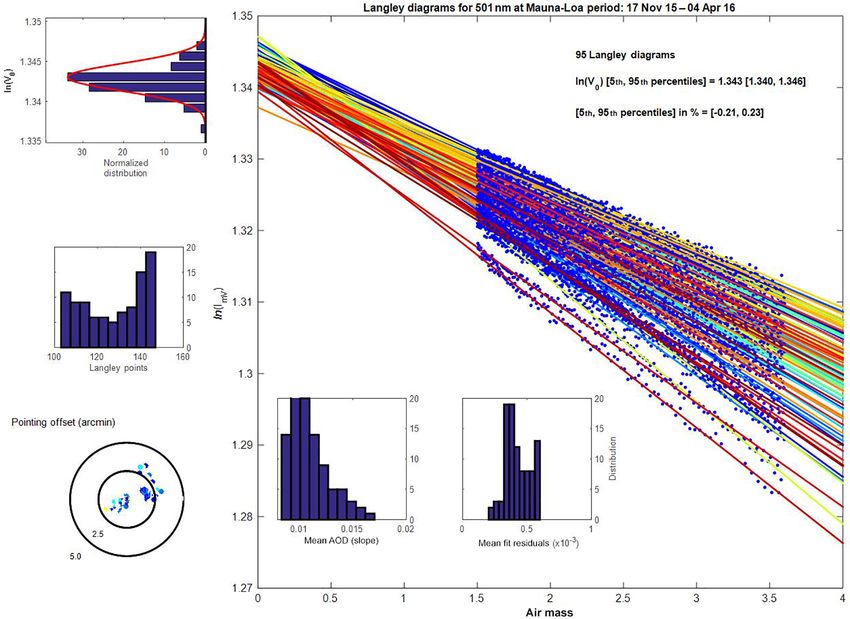
40                                           S. Kazadzis et al.: The World Optical Depth Research and Calibration Center

vided by the Swiss Government. WORCC was assigned the             satellite agencies, a system for integrating global AOD obser-
following tasks:                                                  vations. Towards the same goal, WORCC organizes a filter
                                                                  radiometer comparison every 5 years with a number of ref-
     – development of a radiometric reference for spectral ra-    erence AOD-measuring instruments from different networks.
       diometry to determine AOD                                  The last comparison was held in 2015 with the participation
                                                                  of 30 instruments (WMO, 2016a). In this work, we present
     – development of procedures to ensure worldwide homo-        the research activities of WORCC and more specifically the
       geneity of AOD observations                                calibration hierarchy, the quality assurance and quality con-
                                                                  trol of the GAW-PFR network AOD measurements.
     – development of new instrumentation and methods for
                                                                     The characterization and calibration of the PFR instru-
       AOD
                                                                  ments, together with the quality assurance and quality control
     – implementation of a pilot network for AOD at GAW           of the measurements, is WORCC’s major task. In this work,
       global observatories including quality control and qual-   we summarize the calibration procedures and hierarchy since
       ity assurance of data called GAW-PFR                       the GAW-PFR network was established 17 years ago and the
                                                                  quality assurance and control of the data that the instruments
     – training operators to use and maintain AOD instru-         provide.
       ments.

   There are different global networks measuring AOD,             2   Calibration principles and hierarchy
mainly distinguished by the different instruments used in
                                                                  AOD is a dimensionless quantity that cannot be measured
each of them. The AErosol RObotic NEtwork (AERONET)
                                                                  directly. It can be retrieved from atmospheric transmission
(Holben et al., 1998, 2001) (http://aeronet.gsfc.nasa.gov/)
                                                                  measurements and cannot be directly linked to any SI (In-
is the major global network with central calibration facili-
                                                                  ternational System of Units) reference since the atmospheric
ties in the USA, France and Spain. The sky radiometer net-
                                                                  transmission is also a relative factor related to the direct so-
work (SKYNET) aerosol network (Takamura and Nakajima,
                                                                  lar irradiance (I ) at a particular wavelength (λ) and I (λ) at
2004; Campanelli, 2004) is an observational network dedi-
                                                                  the surface and at the top of the atmosphere Io (λ, r), where
cated to aerosol–cloud–radiation interaction research studies.
                                                                  r is the Sun–Earth distance. As a consequence, transmission
The Australian AOD network includes 22 stations (Mitchell
                                                                  can be measured in any unit and in the case of Sun photome-
et al., 2017). The Chinese Aerosol Remote Sensing network
                                                                  ters, the instrument voltage signal V (λ) and the signal at the
(CARSNET), reporting AOD measurements for 50 sites, rep-
                                                                  top of the atmosphere (extra-terrestrial value Vo (λ, r)) can be
resenting remote, rural and urban areas (Che et al., 2015).
                                                                  written based on the Beer–Lambert law:
In addition, national, regional and global networks such as
the French component of AERONET, PHOTONS (Goloub                  V (λ, m, R) = Vo (λ) e−mδ(λ) R −2 + ε                        (1)
et al., 2007), the Iberian Network for aerosol measurements
(RIMA) (Toledano et al., 2011) and Aerosol Canada (AERO-          where Vo is the exoatmospheric signal at wavelength λ and
CAN) (Bokoye et al., 2001) have contributed to AOD clima-         standard Sun–Earth distance of 1 astronomical unit, m is the
tology studies.                                                   optical air mass along the line of sight to the Sun, δ is the to-
   The Swiss-built PFR (Wehrli in WMO, 2005) has been             tal optical depth, R is the Sun–Earth distance in astronomical
operating continuously at 15 GAW stations and at another 23       units, and ε accounts for the circumsolar sky radiance in the
associated ones worldwide. The PFR is expressly designed to       field of view of the Sun photometer. The total optical thick-
make automated long-term observations at four wavelengths         ness m×δ includes several terms describing the extinction by
(368, 412, 500 and 862 nm). Several studies using data from       different atmospheric components: molecular scattering, gas
the GAW-PFR network have been published mainly focusing           absorption and aerosol extinction. Then in order to calculate
on long-term changes in AOD (e.g., Ruckstuhl et al., 2008;        the AOD we use the following:
Nyeki et al., 2012, 2015). In addition to these studies, GAW-
                                                                           ln (Vo ) − ln(V )
PFR aims to provide intercomparison information between           τaer =                     − τrt ,                           (2)
networks by overlapping at selected sites                                          m
   PFR instruments of the GAW-PFR network currently over-         where τaer is the AOD, m is the optical air mass and τrt is the
lap with AERONET, SKYNET, CARSNET, the Australian                 attenuation due to Rayleigh scattering and other trace gases
Network and other Sun photometers at several sites. As there      for cloudless conditions. Using Eq. (2), we conclude that an
is a need for a common strategy to merge the various network      error of 1 % in V o(λ) results in an AOD of 0.01 for an air
observations into a global data set, the WMO-GAW scientific       mass equal to 1.
advisory group for aerosols recommended that GAW will                According to WMO (2005), as traceability is not currently
have to collaborate with existing major networks to develop       possible based on physical measurement systems, the initial
this strategy, implementing and developing, together with         form of traceability will be based on difference criteria. That

Geosci. Instrum. Method. Data Syst., 7, 39–53, 2018                   www.geosci-instrum-method-data-syst.net/7/39/2018/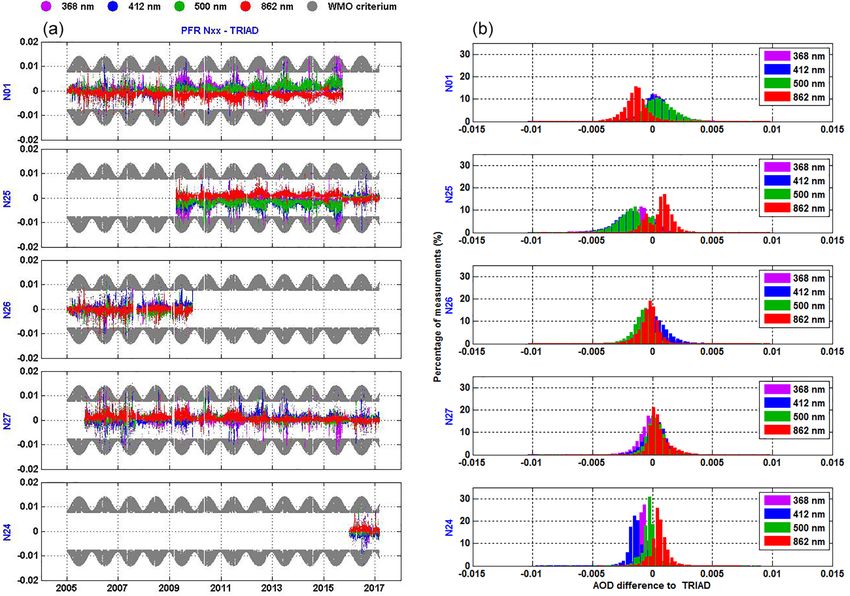
S. Kazadzis et al.: The World Optical Depth Research and Calibration Center 41
is, at an intercomparison or co-location, traceability will be allel with the triad. Table 1 lists the details of these visits.
established if the difference between the AOD of one net- For each period it describes the current status of the PFR in-
work and another is within specific limits. Those limits for fi- struments of the triad, the transferred instrument performing
nite field-of-view instruments have been set (WMO, 2005) to the Langley plots and the Langley plot measurement location
optical depths of 0.005 + 0.01 m−1 and the acceptable trace- and period.
ability is when 95 % of the absolute AODs are within those The determination of V o with the Langley calibration
limits. So requiring 95 % uncertainty (U95) within optical method using a 6-month period of measurements requires
depths of ±0.005 + 0.01 m−1 , where the first term (0.005) high accuracy and quantification of the introduced uncertain-
is linked to instrument uncertainties (signal linearity, Sun ties. Using a defined calibration method, the V o accuracy
pointing, temperature effects, processing, etc.) and the sec- can be traced back to the variability of the V o determination
ond term to a calibration uncertainty of 1 %. and is related to the instrument precision and the procedures.
The WORCC standard group of three PFRs (defined as Practically, the long-term stability of V o is mainly related to
the “PFR triad”) was established in 2005 by WORCC in degradation/changes in the transmission of the optical inter-
order to fulfill the WMO mandate on “homogenization of ference filters, or hardware-related failures/changes that are
global AOD through provision of traceability to the World linked to changes in the instrument signal.
Standard Group (WSG) of spectral radiometers for contribut- WORCC Langley algorithms use half-days to determine
ing networks at co-located sites and/or periodic international V o values. The main requirements for accepting a half-day
filter radiometer comparisons, and further standardization Langley determination of V o are the AOD stability, the sig-
of evaluation algorithms”. Since 2005, five different well- nal stability and the statistics of the retrieved signal versus air
maintained instruments have been used as part of the PFR mass linear regression using specific air mass limitations. An
triad. Figure 1 shows the long-term (12 years) comparison of example of accepted Langley (half-day) measurements for a
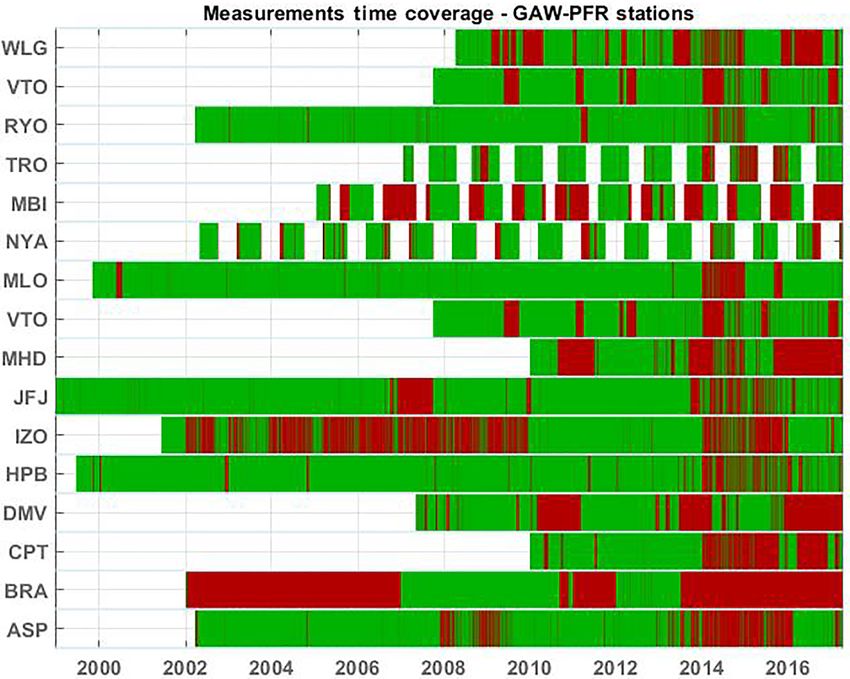
the PFR triad instruments. 6-month period at MLO is shown in Fig. 2.
The long-term relative stability of each of the five PFRs Figure 2 shows 95 Langley diagrams/days that have been
that were part of the triad is presented in Fig. 1. The left panel used to analyze Langley calibration results and related un-
shows the 1 min AOD PFR differences, compared using the certainties. The mean ln(V o) calculated for this period at
WMO-U95 criterion at all four PFR-measuring wavelengths. 500 nm was 1.343, the standard deviation was 0.002 and
It should be noted that all instruments measure at WORCC the 5th and 95th percentiles were 1.340 and 1.346, respec-
in Davos, Switzerland. They are mounted on the same solar tively. The distribution of ln(V o) values is also shown with
tracking system and their signal is processed using a com- the statistics for mean AOD values (0.010–0.015 at 500 nm).
mon processing algorithm. In the 12 years of 1 min measure- The distribution and the normal distribution are shown in the
ment data, more than 99 % of retrieved AOD lies within the upper-left subplot of Fig. 2.
U95-WMO criterion, at all wavelengths. The right panel of Based on Eq. (1) the AOD absolute uncertainty, δAODV o
Fig. 1 shows the individual instrument comparisons with the that is related only to the Langley calibration factor, using
mean triad AOD in more detail. As shown, all differences are Eq. (2), equals δ ln(V
m
o)
where δ ln(V o) is the uncertainty in
well within ±0.005 with small shifts for different PFRs and ln(V o). The uncertainty of ln(V o) can be described by the
particular wavelengths. coefficient of variation (standard deviation/mean, CV) or in
In order to continuously check and maintain the triad the case of a normal distribution by the standard error (stan-
stability we have defined a calibration protocol including dard deviation divided by the square root of the number of
instruments frequently performing Langley calibrations at measurements, SE). For the particular example in Fig. 2, the
high-altitude stations. For this calibration method (Holben calibration uncertainties are shown in Table 2.
et al., 1998; Michalsky et al., 2001) the main requirement is As described above, this uncertainty is directly related to
the stability of AOD during the measurement Langley pe- the calculated δAODV o uncertainty and is equal to δln(V o)
riods (half days). Theoretically, this can be achieved any- when m = 1. In Fig. 3, V o values at 500 and 865 nm are
where, but in practice AOD is variable during the day, so the shown as a function of time for measurements of the PFR
current practice is to perform such measurements at high- instrument N06 that measured at Davos from 2000 to 2005
altitude locations where AOD is very low; thus its variabil- and at IZO from 2005 to 2016. In addition, the evolution of
ity is very small on an absolute level. Since 2003, Mauna the SE is shown.
Loa, Hawaii, USA (MLO, 19.5◦ N, 155.6◦ W, 3397 m a.s.l.), Each of the data points in Fig. 3 represents average V o
Izana, Tenerife, Spain (IZO, 28.3◦ N, 16.5◦ W, 2370 m a.s.l.) values at the end of the averaging period which varies be-
and Jungfraujoch, Switzerland (JFJ, 3580 m a.s.l. 46.5◦ N, tween 3 and 6 months. PFR N06 has exhibited good stability
7.9◦ E), have mainly been used for such Langley calibra- since 2000. All instrument filters have not changed more than
tions. PFR instruments have been permanently deployed at 0.1 in V o units, which corresponds to maximum changes
these stations for certain periods since 2003, and approxi- in AOD of ∼ 0.02 when m = 1. However, the 412 nm filter
mately every 6 months, one of these instruments is returned is an exception which has apparently degraded since 2009.
to WORCC to perform synchronous measurements in par- The maximum changes in AOD (at m = 1) were ∼ 0.05 from
www.geosci-instrum-method-data-syst.net/7/39/2018/ Geosci. Instrum. Method. Data Syst., 7, 39–53, 2018
42                                            S. Kazadzis et al.: The World Optical Depth Research and Calibration Center

Figure 1. (a) Difference between each PFR with the mean of the PFR triad at the four PFR wavelengths. Grey areas represent the WMO-U95
limits. (b) Frequency distribution of these differences for the four measuring wavelengths.

Table 1. Details of PFR triad Langley calibration measurements.

                    Year           Triad           Comparison       Calibration           Comparison period
                                                   reference        type
                    2003    N01     N26            N26              MLO-Langley      1 Mar 2000     31 May 2003
                    2005    N01     N26    N27     N27              MLO-Langley      1 Sep 2005     31 Dec 2005
                    2009    N01     N26    N27     N25              IZO-Langley      1 Apr 2009     31 Jun 2009
                    2010    N01     N25    N27     N24              JFJ-Langley      1 Jan 2010     31 Jan 2010
                            N01     N25    N27     N22              MLO-Langley      1 Jun 2010     31 Jun 2010
                    2011    N01     N25    N27     mean of
                                                   N01, N25, N27
                    2012    N01     N25    N27     N21              IZO-Langley      1 Oct 2012     31 Dec 2012
                    2013    N01     N25    N27     N06              IZO-Langley      1 Aug 2013     31 Aug 2013
                    2014    N01     N25    N27     mean of
                                                   N01, N25, N27
                    2015    N01     N25    N27     N06              IZO-Langley      21 Sep 2015    28 Sep 2015
                            N01     N25    N27     N21              IZO-Langley      21 Sep 2015    28 Sep 2015
                            N01     N25    N27     N24              MLO-Langley      21 Sep 2015    28 Sep 2015
                    2016    N24     N25    N27     N06              IZO-Langley      01 Oct 2016    31 Dec 2016
                    2017    N24     N25    N27     N21              IZO-Langley      17 Mar 2017    14 Apr 2017

Geosci. Instrum. Method. Data Syst., 7, 39–53, 2018                       www.geosci-instrum-method-data-syst.net/7/39/2018/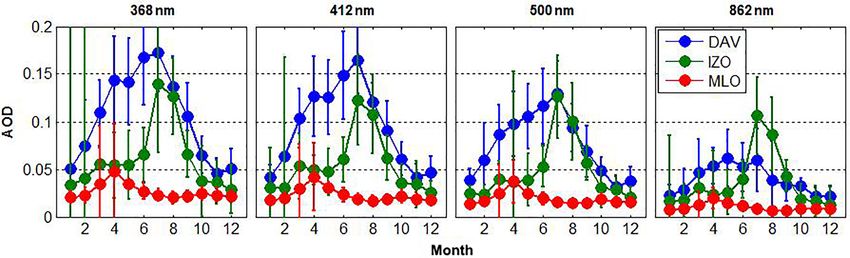
S. Kazadzis et al.: The World Optical Depth Research and Calibration Center                                                       43

Figure 2. Langley plots for Mauna Loa observatory from November 2015 to April 2016.

Table 2. Calibration uncertainties derived from 6 months of Langley calibration measurements shown in Fig. 2.

                          PFR             Number of         Mean     Standard    δln(V o) (CV)   δln(V o) (SE)
                          wavelength    Langley plots    (ln(V o))   deviation          m=1      (norm. distr.)
                          (nm)                   (N)                                                    m=1
                          368                      75       1.438       0.002          0.0013         0.00015
                          412                      93       1.308       0.002          0.0015         0.00015
                          500                      95       1.343       0.002          0.0014         0.00014
                          863                      56       1.276       0.001          0.0007         0.00009

2009 to 2016. It has to be noted that all the above-described          demonstrating that PFR instruments, together with standard
changes have been taken into account in order to calculate             calibration techniques and quality assurance procedures, can
the corresponding AOD for the individual periods. Results in           be used to determine AOD with a precision adequate for the
Fig. 3 illustrate the stability of PFR instruments over time.          fulfilment of the objectives of GAW (WMO, 2001). In addi-
The very low filter response changes over long-term periods            tion, it is intended that long-term high-resolution AOD mea-
increase the statistical validity of each 6-month Langley cal-         surements are conducted and analyzed at selected GAW lo-
ibration period.                                                       cations.
                                                                          The locations, together with their characteristics in terms
                                                                       of aerosol sources and their period of measurements, are de-
3   GAW-PFR network                                                    scribed in Table 3. Bratts Lake and Mace Head measure-
                                                                       ments were unfortunately discontinued in 2012 and 2015, re-
A primary task of WORCC is the implementation of a global              spectively, due to logistical aspects. However, Valentia (Ire-
trial network at selected GAW stations with the objective of

www.geosci-instrum-method-data-syst.net/7/39/2018/                           Geosci. Instrum. Method. Data Syst., 7, 39–53, 2018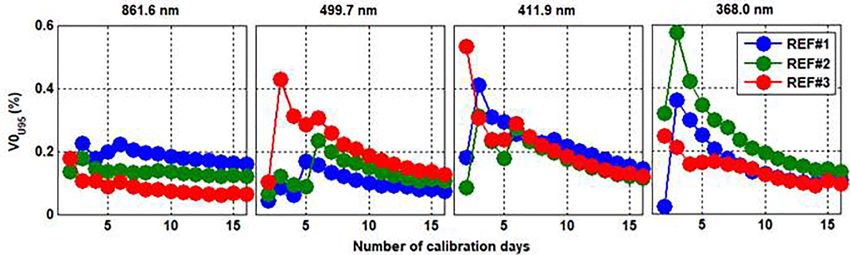
S. Kazadzis et al.: The World Optical Depth Research and Calibration Center

                                                                                                                                                                                                                                                        www.geosci-instrum-method-data-syst.net/7/39/2018/
                                                                              Table 3. GAW-PFR station details, location characteristics and AOD time-series information.
                                                                               Station              Lat         Long          Altitude (m)   Country       Type of location        Main types of           PFR AOD           Previous studies
                                                                               (abbreviation)                                                                                      Air masses              Time series
                                                                               Alice Springs        23.80◦ S    133.87◦ E     547            Australia     desert                  remote continental      2002 to present   Mitchell et al. (2017)
                                                                               (ASP)
                                                                               Bratts Lake (BRA)    50.28◦ N    104.70◦ W     576            Canada        prairie, agricultural   remote continental      2001–2012         McArthur et al. (2003)
                                                                               Danum Valley         4.98◦ N     117.84◦ E     436            Malaysia      tropical forest         remote continental      2007–2016
                                                                               (MAL)
                                                                               Hohenpeissenberg     47.80◦ N    11.02◦ E      995            Germany       pre-alpine, rural       rural                   1999 to present   Ruckstuhl et al. (2008),
                                                                               (HPB)                                                                                                                                         Nyeki et al. (2012)
                                                                               Izana (IZO)          28.31◦ N    16.50◦ E      2371           Spain         island                  free troposphere        2001 to present   Barreto et al. (2014)
                                                                               Jungfraujoch (JFJ)   46.55◦ N    7.99◦ N       3580           Switzerland   high alpine             free troposphere        1999 to present   Ruckstuhl et al. (2008),
                                                                                                                                                                                                                             Nyeki et al. (2012)
                                                                               Mauna Loa (MLO)      19.53◦ N    155.58◦ W     3397           USA           island                  free troposphere        2000 to present   Dutton et al. (1994)
                                                                               Mace Head (MHD)      53.33◦ N    9.89◦ E       20             Ireland       coast                   marine boundary layer   2000–2015         Mulcahy et al. (2009)

                                                                                                                                                                                                                                                        Geosci. Instrum. Method. Data Syst., 7, 39–53, 2018
                                                                               Ny Ålesund (NYA)     78.91◦ N    11.88◦ N      17             Svalbard      Arctic coast, island    Arctic/marine           2002 to present   Herber et al. (2002)
                                                                                                                                                                                   boundary layer
                                                                               Ryori (RYO)          39.03◦ N    141.83◦ E     230            Japan         coast                   marine boundary layer   2002 to present
                                                                               Cape Point (CPT)     34.35◦ S    18.49◦ E      230            S. Africa     coast                   marine boundary layer   2007 to present   Nyeki et al. (2015)
                                                                               Mt. Waliguan         36.28◦ N    100.90◦ E     3810           China         high mountain           free troposphere        2007 to present   Che et al. (2011)
                                                                               (WLG)
                                                                               Valentia (VAL)       51.94◦ N,   10.24◦ W      24             Ireland       coast                   marine boundary layer   2007 to present
                                                                               Marambio (MAR)       64.24◦ S    56.62◦ W      205            Argentina     coast                   marine boundary layer   2005 to present   Tomasi et al. (2015)
                                                                               Troll (TRO)          72.01◦ S,   2.54◦ E       1309           Antarctica    polar                   free troposphere        2012 to present   Tomasi et al. (2015)
44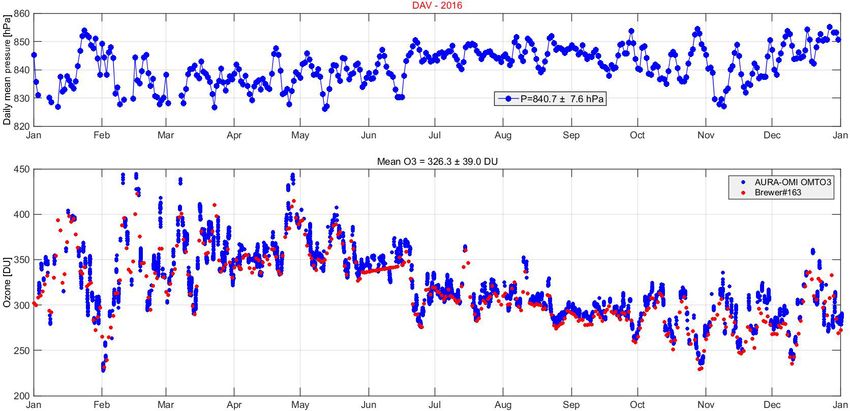
S. Kazadzis et al.: The World Optical Depth Research and Calibration Center                                                      45

Figure 3. Long-term V o values for PFR-N06 at Davos and IZO for the four PFR channels. Bars indicated the standard error.

                                                                         Smaller (red) gaps are due to instrument recalibrations
                                                                      through transfer and measurements in parallel with the PFR
                                                                      triad at Davos, Switzerland.

                                                                      3.1     Instrument calibrations

                                                                      Instruments are regularly calibrated (every 1 to 2 years, de-
                                                                      pending on instrument-related and logistical aspects). The
                                                                      calibration of the filter radiometer has to be assured with
                                                                      an uncertainty of ±1 % in order to achieve the required
                                                                      AOD uncertainty within the U95-WMO limits. Quality-
                                                                      assured AOD data can only be obtained when pre- and post-
                                                                      deployment calibration constants are available. That means
                                                                      that AOD data for a certain location and period can only be
                                                                      considered as final after the recalibration of the instrument,
                                                                      which is performed at the end of the specific period.
                                                                         Postcalibrations can be obtained by different methods:
Figure 4. Data coverage of GAW-PFR stations. Green indicates pe-
riods with data availability and red indicates missing data.          3.1.1    WORCC calibration certificate

                                                                      The WORCC calibration certificate is obtained by instru-
land), Troll (Antarctica) and Marambio (Argentina) have               ments/stations that have their PFR calibrated at Davos,
since been added to the core of GAW-PFR stations.                     against the WORCC triad. Polar and high-altitude sta-
   In addition to the core GAW-PFR instruments, 30 other              tions are often set for calibration annually during po-
locations exist that perform AOD measurements using PFR               lar night/longest night periods. For other stations, a re-
instruments belonging to individual users and institutes. An          calibration should be performed every 12 to 24 months. This
overview of data flow and availability for every location is          method implies that preparation of the final version of the
shown in Fig. 4.                                                      AOD data might be postponed by 1 to 2 years. Comparison
   At high-latitude locations such as Troll and Ny Ålesund,           of each of the instruments with the triad is performed based
AOD measurements can only be performed during part of the             on the WMO criteria for AOD intercomparisons. The inter-
year due to the luck of direct Sun. Big gaps (red colors) are         comparison lasts for at least 5 cloudless days.
linked to instrument damage (e.g., MHD, DMV and CPT)                     The extraterrestrial calibration constants of an instrument
due to various factors (corrosion, lightning etc.).                   x, V0xR are determined by using 1 min measurements Six
                                                                      of the instrument to be calibrated and synchronous measure-
                                                                      ment SiR of the reference (mean of the three triad PFRs) in-

www.geosci-instrum-method-data-syst.net/7/39/2018/                            Geosci. Instrum. Method. Data Syst., 7, 39–53, 2018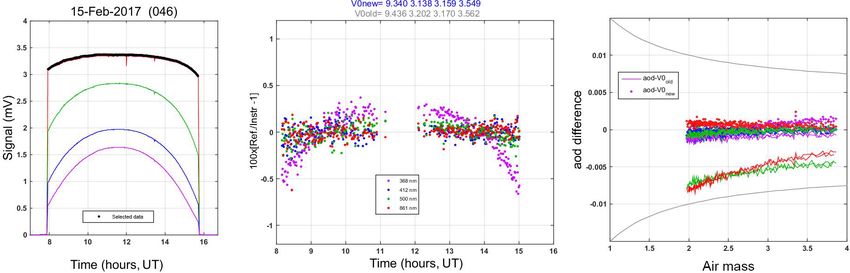
46                                             S. Kazadzis et al.: The World Optical Depth Research and Calibration Center

Figure 5. Calibration of an instrument against the triad: (a) measurement signals at four wavelengths, (b) comparison of instrument signals,
(c) differences between instrument- and triad-retrieved AOD using the old and the new calibration V0xR .

Figure 6. Graphs of V0U95 calculated over an extended calibration period of 35 days for a PFR instrument measuring against each of the
three triad instruments for the four PFR wavelengths.

strument.                                                               calibration constants from each reference instrument are av-
         1    XN Six                                                    eraged to give the final calibration constants V0x with an ex-
V0xR =     V0R n=1                                             (3)      panded uncertainty U95:
         N         SiR
                                                                                   v                  !2 N             !2
                                                                                   uN
The daily calibration constants V0xR , according to (Eq. 4),                       uX ref
                                                                                          V 0xR − V0x     Xref
                                                                                                                σ0xR
are determined for days on which a number (N ≥ 120) of                  U95 = 1.96 t          √         +      p          .             (4)
                                                                                     i=1
                                                                                            2 Nref        i=1
                                                                                                                 Ndays
solar measurements unobstructed by clouds were collected.
Comparing the instrument measurement signal to that of the              The two terms under the square root in Eq. (4) describe the
triad, a new V0xR is calculated and compared with the last              combined statistical (comparison) and triad uncertainty dur-
one used. Details of such an analysis for a single day are              ing the calibration period.
shown in Fig. 5. Instrument signals are shown in Fig. 5a,                  For a normal distribution, V 0U95 corresponds to a cover-
then the percentage differences of 1 min data are calculated            age probability of approximately 95 %.
for all four wavelengths in Fig. 5b. An example of the cal-                The calibration is considered successful when the coeffi-
culated AOD differences from the triad before and after the             cient of variation CV = V 0U95 /V0x becomes smaller than
calibration is finally shown in Fig. 5c. For the specific instru-       ±0.5 % for all four channels of the instrument to be cali-
ment, the V0xR differences for the particular day were up to            brated. This limit is typically reached after 3 to 5 days of
0.5 % and depended on the wavelength. The impact of this                comparison. In Fig. 6, we show V 0U95 calculated over an
difference in AOD calculation is an air-mass-dependent dif-             extended calibration period of 35 days for a PFR instrument
ference of 0.008 to 0.003. In practice, when an instrument is           measuring against the triad. For each of the four PFR wave-
calibrated against the triad, the only limitation on using the          lengths, 2σ within the period is on the order of 0.4 to 0.9 %
synchronous signals is the cloud presence. So, no air mass or           of the mean V o. In addition, we have calculated the V 0U95
AOD limits are included.                                                in percent using Eq. (3) for the instrument under calibration
   The average over the number of measurements over a day,              with each of the three PFRs that are part of the WORCC
values V 0xR and standard deviations σ0x of the daily mean              triad. For this particular case, all wavelengths are within

Geosci. Instrum. Method. Data Syst., 7, 39–53, 2018                          www.geosci-instrum-method-data-syst.net/7/39/2018/
S. Kazadzis et al.: The World Optical Depth Research and Calibration Center                                                     47

Figure 7. (a) Daily mean pressure during 2016 at Davos, Switzerland. (b) Brewer and OMI ozone values.

the limit CV < 0.4 % after 3 days and after 10 days within           3.2.1    Check for ancillary data
CV < 0.2 %.
                                                                     Ancillary data of atmospheric pressure and total ozone are
3.1.2    Langley sites                                               needed to retrieve the Rayleigh and ozone optical thick-
                                                                     nesses, respectively, according to Eq. (1). Atmospheric pres-
Calibrations can be obtained by statistical analysis of objec-       sure measurements, required for Rayleigh scattering, should
tive Langley plots collected in situ over an extended period of      be accurate to about 3 hPa. This accuracy is readily achieved
time at high-altitude (IZO, JFJ, MLO) or remote background           by meteorological grade barometers built into new PFR log-
(ASP, BRA, TRO) sites. Such an evaluation of Langley plots           gers. Accurate pressure data are requested from each station
is routinely performed every 6 months using Langley results          and compared to the daily PFR logger values. If the mean dif-
from 6 months before and after the anchor dates of 1 January         ferences are larger than ∼ 3 hPa, then the atmospheric pres-
and 1 July for each year. This method implies that annual            sure is corrected and all data are reprocessed. The use of av-
quality-assured data can be obtained in July or August of the        erage atmospheric pressure data over a day or longer periods
following year.                                                      can lead to wavelength-dependent AOD retrieval errors and
   A smaller (< 1 %) calibration uncertainty can be expected         to large Ångström exponent errors.
and is required for Langley sites where AOD is lower than               Total column ozone values are needed to correct opti-
elsewhere, and inconsistent calibration may lead to erroneous        cal depth at 500 nm for ozone absorption. As the absorp-
conditions such as an inverted Ångström relation (channels           tion coefficient at 500 nm is low, total ozone needs to be
crossing over) or negative AOD.                                      known to ±30 Dobson units or 10 % of typical values, for
   Calibration V o values calculated for the four AOD chan-          an uncertainty of ±0.001 optical depths at 500 nm. GAW-
nels are used in order to retrieve the AOD. For the data ob-         PFR uses (AURA) satellite overpass observations with the
tained between two calibrations a calibration slope of V o val-      Ozone Monitoring Instrument (OMI) for daily operations
ues is applied. If the differences between two calibrations are      (McPeters et al., 2015). OMI values are validated to in situ
larger than 2 % then an in situ estimate of the instrument           observations for stations operating a Dobson or Brewer in-
stability is investigated from a number of in situ Langley           strument. Where available, total column ozone may be found
plots or cross-calibrations between different PFR channels.          at the World Ozone and Ultraviolet Radiation Data Centre
This is conducted in order to determine nonlinear (over time)        database (http://woudc.org/). Figure 7 shows the evolution
changes (steps) of instrumental V o values.                          of daily mean pressure used for the Rayleigh calculations
                                                                     and ozone values at Davos, Switzerland as measured in situ
3.2     Quality control                                              with a Brewer spectrophotometer and from the OMI ozone
                                                                     retrieval.
After finalizing the calibration constants to be used for the
AOD retrieval, a series of QA/QC procedures are used before
finalizing the AOD data.

www.geosci-instrum-method-data-syst.net/7/39/2018/                           Geosci. Instrum. Method. Data Syst., 7, 39–53, 2018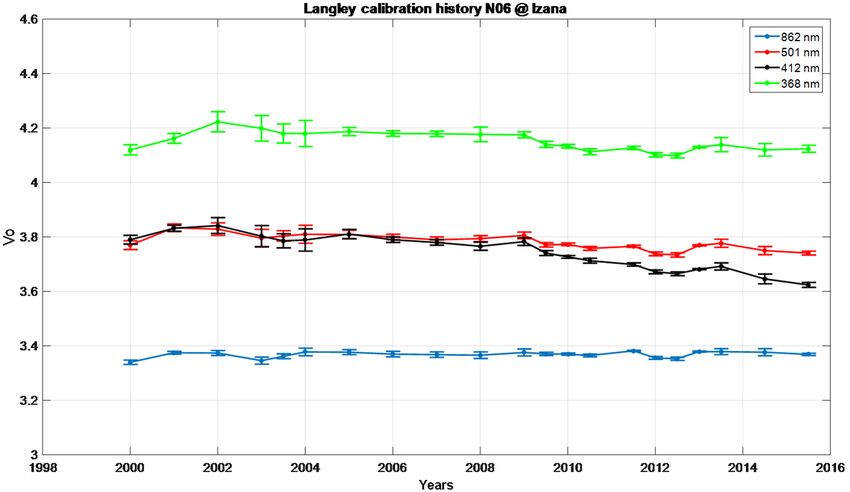
48                                            S. Kazadzis et al.: The World Optical Depth Research and Calibration Center

Figure 8. Example of good and bad pointing. (a) Instrument pointing, (b) instrument signal at 500 nm. The two lower-right panels include
some cloud-related signal changes after 15:00 h UT.

3.2.2   Corrections for temperature, dark signal                      a number of measurements are outside the 25 and 30 arcmin
                                                                      limit.
The PFR sensor temperature is checked for deviations from                 The result of the measured signal (which has a direct im-
its active stabilized set point, indicating potential problems        pact on calculated AOD) is shown in the lower panel, where
during extremely hot or cold ambient conditions. The PFR              the first two days show a very smooth daily pattern, while ar-
dark signal is checked for values > 0.25 mV, and if found on          tificial signal features can be seen in the last two cases. The
approximately 5 % of days, a correction is applied. The dark          use of these data will end up in an artificially overestimated
signal is the mean signal when the solar elevation is less than       AOD retrieval.
−6◦ , i.e., below the horizon. The temperature dependence of
                                                                      3.2.4   Check for crossing of wavelengths
its PFR is based on characterization measurements in a cli-
mate chamber. Corrections are applied only in cases in which          An additional quality control check detects instances when
the dependence on V o is more than ±2 % for the range from            AOD at one of the four PFR wavelengths is less than that at
−20 to 40 ◦ C.                                                        a higher wavelength. This quality check is mainly performed
                                                                      in order to detect the erroneous performance of one of the
3.2.3   Sun pointing                                                  four channels. The test also becomes very important when
                                                                      low AOD values are measured, which is the case at a number
In order to ensure that the full solar disk is included in            of GAW-PFR stations. Small errors related to the calibration
the field of view (FOV) of the instrument an accurate Sun-            of one channel can be easily identified, as this results in a
tracking system is required. While a PFR instrument can be            wavelength crossing of AOD. During evaluation of the data,
readily aligned to the Sun with the required accuracy, a solar-       the processing software tools give the opportunity to define
pointing monitor of the PFR is included in order to control           the limits of the accepted offset for the wavelength crossing.
the Sun-pointing accuracy. This monitor consists of a four-              An example of the graphic representation of wavelength
quadrant silicon detector that is illuminated through a pin-          crossing is shown in Fig. 9. Based on the fact that AOD at
hole of 1 mm diameter at a distance of 70 mm. When the                lower wavelengths has to be at least equal to or higher than
light is centered, all four quadrants produce equal signals.          that at higher wavelengths, colored points show the corre-
By subtracting signals from paired pixels, the sunspot can be         lation of pairs of AOD values at different wavelengths and
localized (Wehrli, 2008).                                             black points represent the cases in which wavelength cross-
   Figure 8 shows four examples of perfect to bad instru-             ing occurs. The figure is composed of 70 350 1 min, cloudless
ments pointing at four cloudless, low aerosol concentration           measurements from the year 2015 as recorded at Cape Point,
(AOD < 0.1) days. The instrument pointing is shown in the             South Africa. For example, as many as 14.3 % of data in the
upper plots. The first (from the left) case shows a perfect           412–500 nm panel (red-blue section) do not pass the wave-
pointing accuracy where 328 measurements during the day               length crossing test, so they are discarded form the postpro-
are almost identical in terms of pointing direction. The sec-         cessing analysis.
ond case shows when all measurements can be found inside
the 15 arcmin limit. Finally, the last two cases show instru-
ments with pointing issues where only 62.9 and 59.5 % cases
respectively are inside the 15 arcmin limit, and in the last case

Geosci. Instrum. Method. Data Syst., 7, 39–53, 2018                        www.geosci-instrum-method-data-syst.net/7/39/2018/
S. Kazadzis et al.: The World Optical Depth Research and Calibration Center 49
3.2.5 Other issues one of the three criteria or combination of criteria is valid at
a certain minute.
The spectral bandpasses of all PFR instruments have been The lower panel shows the calculation of AOD for the
characterized for their effective spectral wavelength and whole day, with obvious deviations due to cloud occurrence
bandwidth. This is determined as the average wavelength for the parts of the day when both criteria are fulfilled. It is
weighted by the spectral response and equivalent width of a interesting to see the 10:50 to 12:00 period which is a diffi-
rectangular bandpass with equal throughput as the filter. Min- cult period when defining the presence of clouds only with
imum and maximum central wavelengths (and bandwidths) direct Sun measurements. For this particular period, even if
that have been calculated were 367.2–367.7 (3.5–3.7), the AOD is low, the objective method shows the presence of
411.8–412.6 (4.3–4.4), 500.6–501.5 (5–5.1) and 861.3–863 thin clouds in front of the Sun.
(5.5–5.6). These measurements were performed using illu- It has to be noted that final AOD data include all available
mination by a grating monochromator (Jobin Yvon HR640) measurements that have passed the quality control proce-
with 0.6 nm spectral resolution. Lately, a pulsed tuneable dures, except the cloud-flagging ones. So, all reported AODs
laser system for the characterization of spectrometers and are available, accompanied by a flag showing which cloud-
filter radiometers has been available at PMOD/WRC. Test flagging criteria have been assigned to the particular 1 min
measurements with PFR instruments did not show significant measurement.
differences from the older characterization measurements.
3.3 Cloud flagging
4 Final AOD data
As AOD measurements cannot be performed under cloudy
conditions, a cloud detection algorithm is used for the PFR During the calibration and quality control procedure, three
measurements. Three different criteria are used (Wehrli, levels of data are defined.
2008): Level 1: These are the raw signal data as measured by the
PFR instrument at the four different channels.
a. The instrument signal derivative with respect to air mass Level 2: These are AOD values. The data are produced
is always negative. The method has been developed and at each measuring station using standardized software in-
described in detail by Harrison and Michalsky (1994). cluding QC tests, cloud screening, Sun-tracking details and
For cases in which air mass values < 2 and the influence signal-to-AOD conversion using an existing calibration file.
of clouds on the noon-side of perturbations cannot be Each of the mentioned test results is characterized by a spe-
easily detected, we compare the derivative with the es- cific flag. In addition, the true solar elevation is calculated
timate of the clear Rayleigh atmosphere and flag it as and included. None of the level 1 data are discarded.
cloudy if the rate of change is twice as much (objective Level 3: AOD data are re-evaluated at WORCC which in-
method). cludes AOD results and Ångström coefficients. Additional
checks are included, such as the detection of wavelength
b. The use of a test for optically thick clouds with crossing AOD(λ1 ) > AOD(λ2 ), where λ1 > λ2 . In addition, a
AOD500 nm > 2. day-to-day visual inspection is performed in order to iden-
tify other technical issues or the possible presence of un-
c. The use of the Smirnov triplet measurement (Smirnov et detected clouds. For the latter, additional cloud flags are in-
al., 2000) by calculating AOD and looking at the signal cluded in the final data files. Data control of level 3 data in-
variability for 3 consecutive minutes (triplet method). cludes overviews of the instrument’s tracking performance,
wavelength crossing and ancillary data.
An example of the use of these three criteria can be seen Hourly data records are prepared from quality-assured
in Fig. 10, where a day with variable cloudiness at Davos is level 3 data, which are then submitted to the World Data Cen-
presented. ter for Aerosols (WDCA) hosted by the Norwegian Norsk
For this particular day, all three criteria are applied. In the Institutt for Luftforskning (NILU; ebas.nilu.no). Final data
early morning and evening, the thick-cloud criteria are ap- files include the mean, median, standard deviation and the
plied. Then both the triplet and the objective method are ap- number of 1 min samples used to calculate the hourly value
plied due to variable cloudiness in front of the Sun. How- at all four wavelengths.
ever, there are times during the day when only the objective In order to calculate hourly, daily and monthly statistics,
method is applied (thin clouds in front of the Sun as seen in we apply the following criteria:
the first picture that is superimposed in Fig. 10). During the
last part of the day (second picture), clouds completely dis- – A minimum of 50 cloudless 1 min measurements per
appear and cloud flagging is set to zero, which means that all day are required to calculate daily statistics. In this case,
three criteria are passed. It has to be noted that cloud flag- we eliminate days with less than 1 h of sunshine.
ging is always kept as a constant number describing which
www.geosci-instrum-method-data-syst.net/7/39/2018/ Geosci. Instrum. Method. Data Syst., 7, 39–53, 201850 S. Kazadzis et al.: The World Optical Depth Research and Calibration Center Figure 9. Correlation curves of the four PFR-measuring wavelengths. Colored points represent the data that have passed the wavelength crossing test and black ones are those that have not. Figure 10. Example of a day with variable cloudiness, (a) instrument signal at 500 nm and minute-by-minute application of the three cloud- flagging methods. The two inset pictures show a 360◦ view of the sky using a cloud camera. (b) Calculation of AOD at four wavelengths. Geosci. Instrum. Method. Data Syst., 7, 39–53, 2018 www.geosci-instrum-method-data-syst.net/7/39/2018/
S. Kazadzis et al.: The World Optical Depth Research and Calibration Center                                                     51

Figure 11. Monthly means and 1σ standard deviations for Davos, Izaña and Mauna Loa using 15 years of 1 min quality-controlled PFR
measurements at four wavelengths.

  – A minimum of six 1 min cloud free measurements are             mal distribution) that affect IZO. An overview of the GAW-
    required to calculate the hourly mean.                         PFR AOD time series at all stations will be reported in a fu-
                                                                   ture study.
  – A minimum of 30 hourly values and 10 days per month
    are required to calculate the monthly mean.
                                                                   5   Summary and conclusions
  – Measurements that lie beyond 2 standard deviations for
    an hourly mean are considered outliers, as they are con-       “AOD is the single most comprehensive variable to assess
    sidered to be affected by cloud contamination.                 the total aerosol load of the atmosphere and represents the
                                                                   least common denominator by which ground-based remote
   Monthly statistics can be presented with different ap-
                                                                   sensing, satellite retrievals and global modeling of aerosol
proaches. In most studies, AOD is usually reported as the
                                                                   properties are compared” (WMO, 2016a). According to the
arithmetic mean and associated standard deviations over a
                                                                   WMO, multiwavelength AOD is one of the essential vari-
selected period. This is based on the hypothesis of an un-
                                                                   ables that critically contributes to the characterization of
derlying normal distribution. However, AOD is often better
                                                                   Earth’s climate. In addition, the Global Climate Observ-
characterized by a lognormal distribution and described by
                                                                   ing System (GCOS) includes atmospheric aerosols includ-
geometric mean and standard deviation. Based on a statis-
                                                                   ing AOD as an essential climate variable. Finally, the Euro-
tical analysis of skewness and kurtosis in a multiyear and
                                                                   pean Space Agency has included aerosols and AOD as one of
multistation AOD data set, O’Neill and co-authors (O’Neill
                                                                   the 10 climate change initiative (CCI) variables to be inves-
et al., 2000) have shown that a lognormal distribution sys-
                                                                   tigated with a view towards building space-based databases.
tematically provides a more robust base for reporting AOD
                                                                      In order to monitor AOD over the long-term and provide
statistics than the normal distribution. Using long-term se-
                                                                   data of traceable quality, the World Optical depth Research
ries of the final-selected 1 min AOD data, users can then try
                                                                   and Calibration Centre (WORCC), Davos, was established
to draw conclusions on the AOD climatology of each station,
                                                                   by the WMO Global Atmosphere Watch (GAW) program.
the aerosol changes, if any, or the daily monthly and annual
                                                                   Fifteen existing GAW baseline stations were chosen for the
patterns. As an example of the three Langley calibration-
                                                                   deployment of PFRs (precision filter radiometer; in-house
related stations IZO, DAV and MLO, monthly means calcu-
                                                                   manufacture). Quality-controlled and -assured AOD data
lated from 15 years of measurements are presented in Fig. 11.
                                                                   from this GAW-PFR network (www.pmodwrc.ch/worcc) are
IZO and MLO are the Langley calibration sites and DAV the
                                                                   being submitted by WORCC to the World Data Centre for
triad host site.
                                                                   Aerosols (ebas.nilu.no).
   For the particular sites that are all considered to have low
                                                                      Under conditions of low aerosol loading, e.g., AOD < 0.1
AOD, we can clearly see that Davos shows an increase in
                                                                   at 500 nm, a calibration error of 1 % results in an error of
AOD during the summer months, while the other two sites
                                                                   ∼ 12 % in the mean daily AOD. WMO has recommended
show much lower AOD with the exception of Saharan dust
                                                                   (WMO, 1993) an absolute limit to the estimated uncertainty
intrusions at Izaña for the July–September months.
                                                                   of 0.02 optical depths for acceptable data and < 0.01 as a goal
   When comparing MLO and IZO statistics, we calculate
                                                                   to be achieved in the near future. These specifications require
long-term AOD550 means of 0.050 and 0.020, respectively,
                                                                   a calibration uncertainty better than 2 % to be achieved for
and geometrical means of 0.033 and 0.017. Respective geo-
                                                                   spectral radiometers. In addition, measurement quality con-
metrical standard deviations are about 1.7 for MLO and 2.6
                                                                   trol and quality assurance in different processing levels of the
for IZO, meaning that AOD varies from 60 to 170 % of 0.017
                                                                   actual measured direct Sun signals or retrieved AOD have to
for MLO and from 38 to 260 % of 0.033 for IZO. This is
                                                                   be included.
linked with the Saharan dust events (AOD outliers for a nor-

www.geosci-instrum-method-data-syst.net/7/39/2018/                      Geosci. Instrum. Method. Data Syst., 7, 39–53, 2018
52 S. Kazadzis et al.: The World Optical Depth Research and Calibration Center
The calibration hierarchy of any network of Sun photome- Acknowledgements. The authors would like acknowledge the
ters is linked with the instrument performance and stability Mauna Loa and Izaña Observatory staff for the inspection and
over time. Instruments which do not exhibit good stability in situ problem solving of the PFR instrumentation presented in
(e.g., filter degradation) over time tend to utilize short peri- this work. They would also like to thank the Scientific Advisory
ods for Langley calibrations where the instrument response Group for Aerosols of the Global Atmospheric Watch, World
Meteorological Organization Program, for the scientific support for
can be considered constant. This can impact the calibration
WORCC.
constant uncertainty through the limited number of measure-
ments and the statistical analysis that is used. The PFR devel- Edited by: Mehrez Zribi
opment and construction has been based on the use of spe- Reviewed by: Lionel Doppler and one anonymous referee
cific hardware and manufacturing techniques that make them
reliable for long-term measurements without rapid interfer-
ence filter changes (e.g., Fig. 2). This provides the opportu-
nity of using longer periods for collecting Langley calibra-
tion results and thus results in better statistics for the deter- References
mination of the calibration constants.
Angström, A.: On the atmospheric transmission of sun radiation and
Quality control of routine WORCC/PFR measurements
on dust in the air, Geografiska Annaler, 11, 156–166, 1929.
includes a number of measurement-related checks, includ- Barreto, A., Cuevas, E., Pallé, P., Romero, P. M., Guirado, C.,
ing the optical window cleanliness and the accuracy of Wehrli, C. J., and Almansa, F.: Recovering long-term aerosol op-
the Sun pointing. In addition, a number of parameters tical depth series (1976–2012) from an astronomical potassium-
such as pressure, ozone and NO2 concentrations have to based resonance scattering spectrometer, Atmos. Meas. Tech., 7,
be measured, assumed and/or modeled. Further QC pro- 4103–4116, https://doi.org/10.5194/amt-7-4103-2014, 2014.
cedures involve data evaluation, especially rejecting mea- Bokoye, A. I., Royer, A., O’neill, N. T., Cliche, P., Fedosejevs, G.,
surements with wavelength-related drifts (crossing) and sus- Teillet, P. M., and McArthur, L. J. B.: Characterization of at-
pected cloud contamination in the line of sight. Cloud screen- mospheric aerosols across Canada from a ground-based sunpho-
ing becomes a difficult task, especially in the case of op- tometer network: Aerocan, Atmos. Ocean., 39, 429–456, 2001.
tically thin clouds that cannot be easily distinguished from Campanelli, M., Nakajima, T., and Olivieri, B.: Determination of
the solar calibration constant a sun-sky radiometer: Proposal of
AOD associated with coarse-mode aerosols. Finally, quality
an in situ procedure, Appl. Opt., 43, 651–659, 2004.
assurance of AOD data mainly include the determination of
Che, H., Wang, Y., and Sun, J.: Aerosol optical properties at
a proper calibration (extraterrestrial signals) within the re- Mt. Waliguan Observatory, Chinga, Atmos. Environ., 45, 6004–
quired uncertainty. 6009, 2011.
WORCC has defined a protocol for calibrating the PFR Che, H., Zhang, X.-Y., Xia, X., Goloub, P., Holben, B., Zhao,
instruments by maintaining a triad of reference PFRs that H., Wang, Y., Zhang, X.-C., Wang, H., Blarel, L., Damiri,
exhibit differences well within (more than 99 % of 1 min B., Zhang, R., Deng, X., Ma, Y., Wang, T., Geng, F., Qi, B.,
data over a 12-year period) the U95 WMO criterion. The Zhu, J., Yu, J., Chen, Q., and Shi, G.: Ground-based aerosol
procedure includes systematic checks including comparisons climatology of China: aerosol optical depths from the China
with instruments that perform measurements (Langley cali- Aerosol Remote Sensing Network (CARSNET) 2002–2013, At-
brations) at high-altitude stations. mos. Chem. Phys., 15, 7619–7652, https://doi.org/10.5194/acp-
15-7619-2015, 2015.
One of the aims of WORCC is the provision of instru-
Dutton, E. G., Reddy, P., Ryan, S., and DeLuisi J. J.: Features and
mentation and protocols for uniform global measurement
effects of aerosol optical depth observed ant Mauna Loa, Hawaii,
and records of AOD and the maintenance of the radiomet- 1982–1992, J. Geophys. Res., 99, 8295–8306, 1994.
ric reference for such measurements. So in addition to the Flowers, E. C., McCormick, R. A., and Kurfis, K. R.: Atmospheric
hosting and maintenance of the AOD triad, WORCC hosts Turbidity over United States, 1961–1966, J. Appl. Meteorol., 8,
the filter radiometer comparison every 5 years (e.g., WMO, 955–962, 1969.
2016b) and maintains long-term AOD measurements at the Goloub, P., Li, Z., Dubovik, O., Blarel, L., Podvin, T., Jankowiak,
main calibration sites of other aerosol networks such as I., Lecoq, R., Deroo, C., Chatenet, B., Morel, J. P., Cuevas,
AERONET (Mauna Loa, USA; Izaña, Spain) and SKYNET E., and Ramos, R.: PHOTONS/AERONET sunphotometer net-
(Chiba, Japan; Valencia, Spain). work overview: description, activities, results, Proc. SPIE, 6936,
69360V, https://doi.org/10.1117/12.783171, 2007.
Harrison L., Michalsky, J., and Berndt, J.: Automated multifilter
rotating shadow-band radiometer: an instrument for optical depth
Data availability. The data that has been used in this work is avail-
and radiation measurements, Appl. Opt., 33, 5118–5125, 1994.
able upon request.
Herber, A., Thomason, L. W., Gernandt, H., Leiterer, U., Nagel,
D., Schulz, K. H., Kaptur, J., Albrecht, T., and Notholt, J.: Con-
tinuous day and night aerosol optical depth observations in the
Competing interests. The authors declare that they have no conflict Arctic between 1991 and 1999, J. Geophys. Res., 107, 4097,
of interest. https://doi.org/10.1029/2001JD000536, 2002.
Geosci. Instrum. Method. Data Syst., 7, 39–53, 2018 www.geosci-instrum-method-data-syst.net/7/39/2018/S. Kazadzis et al.: The World Optical Depth Research and Calibration Center 53 Holben, B. N., Eck, T. F., Slutsker, I., Tanre, D., Buis, J. P., Setzer, Aerosol and cloud effects on solar brightening and the A., Vermote, E., Reagan, J. A., Kaufman, Y. J., Nakajima, T., recent rapid warming, Geophys. Res. Lett., 35, L12708, Lavenu, F., Jankowiak, I., and Smirnov, S.: AERONET – A Fed- https://doi.org/10.1029/2008GL034228, 2008. erated Instrument Network and Data Archive for Aerosol Char- Smirnov, A., Holben, B. N., Eck, T. F., Dubovik, O., and Slutsker, acterization, Remote Sens. Environ., 66, 1–16, 1998. I.: Cloud-screening and quality control algorithms for the Holben, B. N., Tanré, D., Smirnov, A., Eck, T. F., Slutsker, I., AERONET database, Remote Sens. Environ., 30, 337–349, Abuhassan, N., Newcomb, W. W., Schafer, J. S., Chatenet, 2000. B., Lavenu, F., Kaufman, Y. J., Vande Castle, J., Setzer, A., Takamura, T. and Nakajima, T.: Overview of SKYNET and its ac- Markham, B., Clark, D., Frouin, R., Halthore, R., Karneli, A., tivities, Opt. Pura Apl., 37, 3303–3308, 2004. O’Neill, N. T., Pietras, C., Pinker, R. T., Voss, K., and Zibordi, Toledano, C., Cachorro, V. E., Berjon, A., de Frutos, A. M., Fuertes, G.: An emerging ground-based aerosol climatology: Aerosol op- D., Gonzalez, R., Torres, B., Rodrigo, R., Bennouna, Y., Mar- tical depth from AERONET, J. Geophys. Res., 106, 12067– tin, L., and Guirado, C.: RIMA-AERONET network: long-term 12097, 2001. monitoring of aerosol properties, Opt. Pura Apl., 44, 629–633, IPCC: climate change 2013: the physical science basis, edited by: 2011 . Stocker, T. F., Qin, D., Plattner, G. K., Tignor, M., Allen, S. K., Tomasi, C., Kokhanovsky, A. A., Lupi, A., Ritter, C., Smirnov, Boschung, J., Nauels, A., Xia, Y., Bex, B., and Midgley, B. M., A., O’Neill, N. T., Stone, R. S., Holben, B. N., Nyeki, S., Contribution of working group I to the fifth assessment report of Wehrli, C., Stohl, A., Mazzola, M., Lanconelli, C., Vitale, V., the intergovernmental panel on climate change, 2013. Stebel, K., Aaltonen, V., de Leeuw, G., Rodriguez, E., Her- Junge, C.: Gesetzmässigkeiten in der Grössenverteilung at- ber, A. B., Radionov, Zielinski, T., Petelski, T., Sakerin, S. mosphärischer Aerosole über dem Kontinent, Berichte des M., Kabanov, D. M., Xue, Y., Mei, L., Istomina, L., Wagener, Deutschen Wetterdienstes in der US-Zone, Nr. 35, 261–275, R., McArthur, B., Sobolewski, P. S., Kivi, R., Courcoux, Y., 1952. Larouche, P., Broccardo, S., and Piketh, S. J.: Aerosol re- Linke, F.: Die Sonnenstrahlung und ihre Schwächung in der Atmo- mote sensing in polar regions, Earth Sci. Rev., 140, 108–157, sphäre, Handbuch der Geophysik, 8, 239–338, 1942. https://doi.org/10.1016/j.earscirev.2014.11.001, 2015. McArthur, L. J. B., Halliwell, D. H., Niebergall, O. J., Volz, F.: Photometer mit Selen-Photoelement zur spektralen Mes- O’Neill, N. T., Slusser, J. R., and Wehrli, C.: Field compar- sung der Sonnenstrahlung und zur Bestimmung der Wellenlän- ison of network photometers, J. Geophys. Res., 108, 4596, genabhängigkeit der Dunsttrübung, Arch. Met. Geoph. Biokl. B, https://doi.org/10.1029/2002JD002964, 2003. 10, 100–131, 1959. McPeters, R. D., Frith, S., and Labow, G. J.: OMI total column Volz, F.: Some results of turbidity networks, Tellus XXI, 5, 625– ozone: extending the long-term data record, Atmos. Meas. Tech., 630, 1969. 8, 4845–4850, https://doi.org/10.5194/amt-8-4845-2015, 2015. Wehrli, C.: Calibrations of filter radiometers for determination of Mitchell, R. M., Forgan, B. W., and Campbell, S. K.: The Climatol- atmospheric optical depths, Metrologia, 37, 419–422, 2000. ogy of Australian Aerosol, Atmos. Chem. Phys., 17, 5131–5154, Wehrli, C.: Remote sensing of Aerosol Optical Depth in a Global https://doi.org/10.5194/acp-17-5131-2017, 2017. surface network, available at: https://www.research-collection. Michalsky, J. J., Schlemmer, J. A., Berkheiser, W. E., Berndt, J. L., ethz.ch/handle/20.500.11850/150574, 2008. Harrison, L. C., Laulainen, N. S., Larson, N. R., and Barnard, J. Weller, M. and Gericke, K.: Long-term observations of aerosol C.: Multiyear measurements of aerosol optical depth in the At- optical depths at the Meteorological Observatory Linden- mospheric Radiation Measurement and Quantitative Links pro- berg, Meteorol. Z., 14, 651–662, https://doi.org/10.1127/0941- grams, J. Geophys. Res.-Atmos., 106, 12099–12107, 2001 2948/2005/0070, 2005. Mulcahy, J. P., O’Dowd, C. D., and Jennings, S. G.: WMO/GAW: report No. 101, Report of the WMO workshop on the Aerosol optical depth in clean marine and continental measurement of atmospheric optical depth and turbidity, (WMO northeast Atlantic air, J. Geophys. Res., 114, D20204, TD No. 659), Chapter 4: Working Group Discussions – Sunpho- https://doi.org/10.1029/2009JD011992, 2009. tometry, 4–5, 1993. Nyeki, S., Halios, C. H., Baum, W., Eleftheriadis, K., Flentje, WMO/GAW: report No. 143, Global Atmosphere Watch measure- H., Gröbner, J., Vuilleumier, L., and Wehrli, C.: Ground-based ments guide, WMO/TD- No. 1073, Chapter 3: Aerosol and Op- aerosol optical depth trends at three high-altitude sites in Switzer- tical Depth, 33–49, 2001. land and southern Germany from 1995 to 2010, J. Geophys. Res., WMO/GAW: report No. 162, Experts Workshop on a Global 117, D18202, https://doi.org/10.1029/2012JD017493, 2012. Surface-based Network for Long Term Observations of Col- Nyeki, S., Wehrli, C., Gröbner, J., Kouremeti, N., Wacker, S., umn Aerosol Optical Properties (WMO TD No. 1287), Chapter: Labuschagne, C., Mbatha, N., and Brunke, E.-G.: The GAW- GAWPFR: A Network of Aerosol Optical Depth Observations PFR aerosol optical depth network: The 2008–2013 time series with Precision Filter Radiometers (from Christoph Wehrli, 36– at Cape Point Station, South Africa, J. Geophys. Res.-Atmos., 39), 153 pp., 2005. 120, 5070–5084, https://doi.org/10.1002/2014JD022954, 2015. WMO/GAW: report No. 227, WMO/GAW Aerosol Measure- O’Neill, N. T., Ignatov, A., Holben, B. N., and Eck, T. F.: The log- ment Procedures, Guidelines and Recommendations, 2nd Edn., normal distribution as a reference for reporting aerosol optical WMO- No. 1177, ISBN 978-92-63-11177-7, (WMO/TD- No. depth statistics, Geophys. Res. Lett., 27, 3333–3336, 2000. 1177), ISBN 978-92-63-11177-7, Chapter 7: Aerosol Optical Ruckstuhl, C., Philipona, R., Behrens, K., Collaud Coen, M., Depth 60–67, 2016a. Dürr, B., Heimo, A., Mätzler, C., Nyeki, S., Ohmura, A., WMO/GAW: Report No. 231, The Fourth WMO Filter Radiometer Vuilleumier, L., Weller, M., Wehrli, C., and Zelenka, A.: Comparison (FRC-IV), 2016b. www.geosci-instrum-method-data-syst.net/7/39/2018/ Geosci. Instrum. Method. Data Syst., 7, 39–53, 2018
You can also read