ATOM: A Grammar for Unit Visualizations - Deokgun Park, Steven M. Drucker, Roland Fernandez, and Niklas Elmqvist, Senior Member, IEEE - Microsoft
←
→
Page content transcription
If your browser does not render page correctly, please read the page content below

IEEE TRANSACTIONS ON VISUALIZATION AND COMPUTER GRAPHICS                                                                                              1

            ATOM: A Grammar for Unit Visualizations
     Deokgun Park, Steven M. Drucker, Roland Fernandez, and Niklas Elmqvist, Senior Member, IEEE

      Abstract—Unit visualizations are a family of visualizations where every data item is represented by a unique visual mark—a visual
      unit—during visual encoding. For certain datasets and tasks, unit visualizations can provide more information, better match the user’s
      mental model, and enable novel interactions compared to traditional aggregated visualizations. Current visualization grammars cannot
      fully describe the unit visualization family. In this paper, we characterize the design space of unit visualizations to derive a grammar that
      can express them. The resulting grammar is called ATOM, and is based on passing data through a series of layout operations that divide
      the output of previous operations recursively until the size and position of every data point can be determined. We evaluate the
      expressive power of the grammar by both using it to describe existing unit visualizations, as well as to suggest new unit visualizations.

      Index Terms—Visualization grammar, unit visualizations, declarative specification.

                                                                            F

1    I NTRODUCTION                                                              This yields a number of previously unknown visualizations that
Visualization encodes symbolic data into visual structures [1],                 may be useful to explore further, and proves that our grammar also
and arguably the most straightforward way to do this is to use                  has significant generative power.
a direct mapping where each data item becomes a unique visual                       The remainder of this paper is structured as follows: We first
mark. Such visualizations strictly maintain the identity of each                define and discuss unit visualizations and their difference from
visual mark and its relation to a corresponding data item. Drucker              visualizations that use aggregation. We then review the literature
and Fernandez use the term unit visualizations to refer to this                 on current unit visualizations and visualization grammars. This
family of visualization techniques, and prominent examples of                   leads to our design space of unit visualizations and a grammar for
such techniques include unit charts, dotplots, and scatterplots [2].            describing them. We validate our work with several examples of
In contrast, visualizations based on data aggregation—such as                   existing as well as novel unit visualizations. Finally, we discuss the
barcharts, piecharts, or histograms—merge multiple data items                   Atom grammar in contrast to existing visual grammars and derive
into inseparable graphic entities [3]. While such data abstraction              guidelines for how to best use them. We close the paper with our
improves the scalability of the visual representation, it surrenders            conclusion and our plans for future work.
the identity property of the visual marks, making it impossible to
distinguish individual data points in the visualization. Maintaining            2    AGGREGATED VS . U NIT V ISUALIZATIONS
the identity property, on the other hand, allows for many novel                 We define unit visualizations as visualizations that maintain the
interactions not possible using an aggregating visualization, such              identity property of its visual marks, i.e., where each visual mark
as querying individual data points, tracking their movement during              is a unique entity that is associated with a corresponding unique
transitions, and filtering on an item level. While many useful                  data item. The identity property means that for every data item
visualizations that exhibit these properties exist, to date, this type          in the data table, there is a corresponding visual mark in its
of visualization has not yet been classified as a unique category,              visualization. While the unit visualization family has not yet been
and their design space has not been systematically explored.                    properly categorized in the visualization field, there nonetheless
    In this paper, we address this gap in the literature by presenting          exist several examples of effective unit visualizations, such as unit
ATOM, a high-level grammar for unit visualizations based on a                   charts, dotplots, and scatterplots.
structured exploration of their design space. ATOM uses a sequence                  Maintaining the identity property can lead to visual clutter
of recursive layout operations that organize the output of previous             for large datasets. To combat this, many visualization techniques
operations until the size and position of each data point can be                are based on data abstraction, such as aggregation, segmentation,
determined, as shown in Figure 1. In our implementation, Atom                   or filtering [4]. Instead of maintaining an absolute one-to-one
specifications are standard JSON objects that are ingested by the               mapping between data items and visual marks, these abstracted
Atom engine and then rendered as Scalable Vector Graphics in a                  or aggregated visualization techniques merge multiple data items
modern web browser.                                                             into visual aggregates that can no longer be separated, and where
    We validate the ATOM grammar using a two-pronged strategy.                  the identity property thus does not hold. Examples of aggregated
First, we use ATOM to replicate existing unit visualizations, such              visualizations are barcharts, piecharts, and histograms.
as barcharts, mosaic plots, dotplots, and density plots (Figure 2).                 In this section, we contrast unit visualizations to aggregated
This approach demonstrates the expressive power of the grammar.                 visualizations in an effort to identify the areas in which using a unit
Second, we use ATOM to create new unit visualization techniques.                visualization can be advantageous. Analogously, we also recognize
                                                                                situations where unit visualizations provide limited utility.
•   Deokgun Park and Niklas Elmqvist are with the University of Maryland,
    College Park, MD, USA. E-mail:{intuinno, elm}@umd.edu.                      2.1 Strengths of Unit Visualizations
•   Steven M. Drucker and Roland Fernandez are with Microsoft Research.         Unit visualizations have the following advantages over traditional
    E-mail: {sdrucker, rfernandez}@microsoft.com.
                                                                                aggregated visualizations: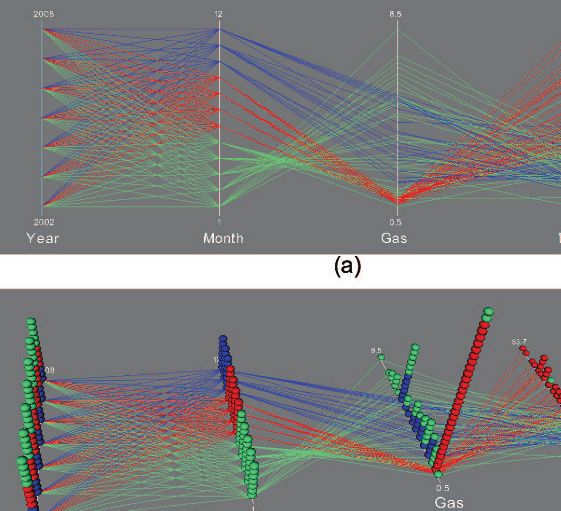
IEEE TRANSACTIONS ON VISUALIZATION AND COMPUTER GRAPHICS                                                                                                                       2

                   RootContainer
          {all the passengers of Titanic}

                                                                 Container Container Container
                                                                 {1st class} {2nd class} {3rd class}

                   The Survivors of Titanic by Passenger Class

Fig. 1. Sequence of layout operations to generate a unit column chart for survivors of the Titanic by passenger class.

      •       Intuition: The identity property ensures that there is a                                       •    Display scalability: A unit visualization is only useful if
              one-to-one mapping between data points and visual marks,                                            individual visual marks can be distinguished. This means
              which is a simple bijective function that minimizes the need                                        that there is a limit to how small each visual mark can
              for the user to consider data abstraction when interpreting                                         be relative to the screen resolution or physical size of the
              the visualization. This also allows detecting outliers in a                                         display it is being visualized on.
              subgroup. As an example, Figure 2(c) shows Miss Helen                                          •    Perceptual scalability (visual clutter): Finally, the human
              Loraine Allison, who was the only child in first and second                                         visual system is limited in the number of objects that it can
              class to die.                                                                                       perceive [3], let alone track [5], [6]. While clutter reduction
      •       Perception: Maintaining item identity allows for tracking                                           is an important research topic in visualization [11], most of
              items during animated transitions and interaction. While                                            these techniques are based on mechanisms that are in direct
              there is a limit to the number of objects that humans can                                           conflict with the identity property of unit visualizations,
              reliably track [5], [6], this property nevertheless allows a                                        including aggregation, sampling, and summarization. While
              user to follow a selected item during a transition [7] and to                                       some of these issues concern cases with a large number
              get the overall gist of where groups of items are moving.                                           of data objects, there are also issues with using unit
              This property can also be used for visual sedimentation [8],                                        visualizations for a very small number of data objects,
              where data items are accumulated over time.                                                         where empty space and aliasing can make comparison
      •       Constructivism and physicality: Correlating a unique                                                difficult. For some tasks, such as comparing proportions,
              visual mark with a unique data item conforms to how                                                 aggregated visualizations—such as stacked bar charts—
              novices think about and construct visual representations                                            may be superior if there are small numbers of data objects.
              using physical tokens [9].
      •       Interaction: The identity property ensures that users can                                3         R ELATED W ORK
              get details on demand for each individual data item [10].
              Furthermore, filtering can be performed on a per-item                                    Even though the term unit visualizations is somehwat novel, many
              level, with animations showing visual marks appearing                                    unit visualizations have been proposed in the past. In this section,
              or disappearing from the display.                                                        we review these techniques and explain why previous visualization
                                                                                                       grammars are insufficient for describing them. Table 1 gives a
                                                                                                       representative sampling of visual representations and visualization
2.2        Weaknesses of Unit Visualizations                                                           systems that can be construed as unit visualizations.

On the other hand, there are disadvantages associated with unit
                                                                                                       3.1       Unit Visualizations
visualizations that should be considered during design:
                                                                                                       Having a bijective mapping between rows of data and visual marks
      •       Computational scalability: A key limitation for unit                                     is arguably the simplest method to generate visualizations in the
              visualization is the scalability of the hardware platform [3],                           same sense as how we first learn to represent numbers as children by
              i.e., the memory, computation, and rendering performance                                 counting fingers on a hand. A simple extension of finger counting
              associated with managing unique visual marks for all data                                is to use visual shapes to represent data as tallies, where evidence
              items. For truly large datasets, or for hardware platforms                               of their use has been found as early as the upper Paleolithic eras.
              with limited capabilities—such as smartphones, tablets, and                              Neurath used multiple repetitive icons to represent quantities of
              smartwatches—this can become a limiting factor against                                   information in his I SOTYPE work in the early 1930’s [12]. Waffle
              adopting a unit visualization.                                                           charts or square pie charts uses a square matrix and fills the portion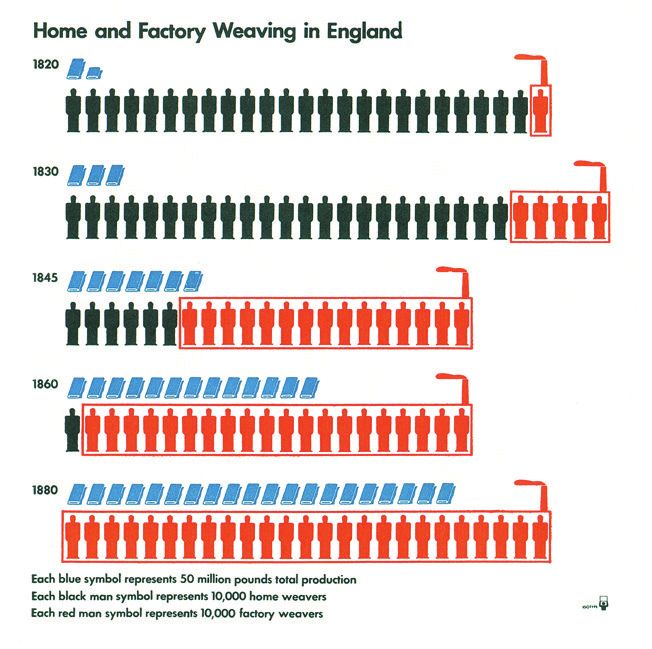
IEEE TRANSACTIONS ON VISUALIZATION AND COMPUTER GRAPHICS                                                                                              3

                                                   Survived                                                      Class
  Class                                      Yes               No                  1st                           2nd               3rd

 3rd                                    M
                                                             3rd
                                        F
 2nd
                                        M                                                                                                          Age
                                        F                     2nd
                                                                                         Helen Loraine Allison

 1st                                    M
                                        F                      1st

                    (a)                                (b)                                                         (c)

Fig. 2. Example unit visualizations authored using the Atom grammar for the Titanic dataset: (a) Unit barchart for passenger class; (b) unit mosaic plot
for passenger class, survival, and gender; and (c) unit violin plot for age distribution faceted by passenger class. In each chart, blue dots represent
the people who survived and red dots represent those who did not.

grid with colors to show the compositions of data while keeping              3.2     Grammars for Visualizations
individual points. More recently, Huron et al. has examined how
tokens can be used to help teach basic visualization literacy [9],           Visualizations can be constructed using tools at various levels of
[13]. However, in these cases, the individual blocks are physical            abstraction. To support programming visualizations from scratch,
representations of numerical quantities rather than an individual            many libraries have been proposed that provide basic primitives,
data table row. Previous visualizations have delivered the numerical         including Prefuse [31], Processing [32], D3 [33], and Protovis [34].
information effectively for print media. But the development of              However, programming falls outside the reach of many people, and
interactive visualizations leads to a more extreme approach tying            requires undue focus on implementation details rather than freeing
visual marks to data. Representing each data row as a visual mark            the designer to focus on the visual representation. Furthermore,
and interactively rearranging them to find patterns have been used           new visualizations cannot as a rule be enumerated using a general-
in exploratory business analytics in commercial software [2] and             purpose programming language.
in classroom environments [14].                                                  Declarative languages decouple the specification from the
                                                                             execution [35], [36], and using a declarative visualization grammar
    When the dimensions associated with data increases, visualiza-
                                                                             allows for simpler description as well as enabling enumeration
tions can map these additional attributes to visual variables [15]
                                                                             of legal visual representations. Many declarative visualization
such as position, shape, or area of a visual mark. The simplest
                                                                             grammars have been introduced with distinct goals: some have
version of this, the scatterplot, has been in use since the mid-17th
                                                                             lower levels of abstraction allowing more expressiveness, while
Century. Other examples include bubble charts [16], popularized
                                                                             others offer more simplicity. Examples of these pure declarative
by Hans Rosling in his Gapminder work.
                                                                             methods include ggplot2 [37], ggvis [38], Vega [36], Reactive-
    When not directly mapping the position of marks using data,              Vega [39], and Vega-Lite [40].
marks can be “packed” onto the screen. Examples of this range                    One of the first examples of this grammar-based approach to
from Wilkinson’s dotplots [17] to Keim’s pixel charts [18]. Much             visualization was Wilkinson’s “Grammar of Graphics” (GoG); an
of this work tends to blur the distinction between aggregate-based           abstraction that makes thinking, reasoning, and communicating
visualizations and unit-based visualizations, where the units are            about graphics much easier [22]. Building upon these notions,
laid out in a way that reveals both the individual units themselves          ggplot2 is a widely-used R package for visualizations that im-
as well as the overall statistical structure of the data.                    plements GoG [37]. However, GoG and ggplot2 are focused on
     While unit representations in static visualizations might be            visual specification and do not provide the interaction operations
useful for their simplicity, interaction and animation provide               necessary for truly interactive graphics.
opportunities to highlight some of the utility that the individual               Vega [36] extended the specification of visual representa-
representation of each row affords [2], [19], [20], [21]. These              tions with support for modeling the interaction design. Reactive
interactive multidimensional visualization systems maintain object           Vega [39] provided a robust implementation of this in the Vega
identity during interactive visual exploration such as axis changes,         grammar based on event-driven reactive functional programming.
filtering, brushing, and selection. Representative examples of unit          However, even declarative grammars tend to be verbose, making it
visualizations are shown in Figure 3.                                        time-consuming and difficult for novices to construct visualizations.
    Unit visualizations have arisen naturally in the visualization           Therefore, Vega-Lite [40] was developed to sacrifice some of the
community; therefore, many variations have been developed in                 expressiveness of Vega while gaining easier use.
an ad-hoc fashion based on heuristics or the authors’ intuition.                 Beyond general-purpose visualization grammars, also domain-
This paper extracts the common factors in these unit visualization           specific grammars have been developed for specific types of
representations and creates a general framework so that both the             visualizations. Product plots by Wickham and Hofmann can
description of existing visualizations and the design of novel               generate more than 20 statistical graphics by the combination
ones can take a more systematic approach. As grammars for                    of a few primitives for absolute counts or relative proportions [41].
visualizations have been successful in unifying many disparate               Baudel and Broeksema [42] describe the design space of sequential
visualization types [22], we use a similar approach for unit                 space-filling layout, including many variants of treemaps [43],
visualizations with the goal of achieving more formal mathematical           mosaic plots [44], and pixel bar charts [44], with five independent
rigor.                                                                       dimensions. MacNeil and Elmqvist [45] propose a view specifi-
IEEE TRANSACTIONS ON VISUALIZATION AND COMPUTER GRAPHICS                                                                                                                                              4

                                      (a)                                                                              (b)                       (c)                              (d)

                                      (e)                                                                            (f )                        (g)                           (h)

                                                           (i)                                                                                         (j)

                 62± 3
                           Minimize           Maximize

                 56± 3
                           Minimiz
                           Minimize           Maximize
                                              Maximiz
                                              Maximize

                 49± 3
                           Minimiz
                           Minimize           Maximize
                                              Max
                                              Maximiz
                                                 imize

                 43± 3
                           Minimiz
                           Minimize           Maximize
                                              Max
                                              Maximiz
                                                 imize

                 36± 3
                           Minimiz
                           Minimize           Maximize
                                              Max
                                              Maximiz
                                                 imize

                 29± 3
                           Minimiz
                           Minimize           Maximize
                                              Maximiz
                                                 imize

                 23± 3
                           Minimize           Maximize
                                              Max
                                              Maximiz
                                                 imize

                 16± 3
                           Minimiz
                           Minimize           Maximize
                                              Max
                                              Maximiz
                                                 imize

                 10± 3
                           Minimiz
                           Minimize           Maximize
                                              Maximiz
                                              Maximize

                  3± 3
                           Minimiz
                           Minimize           Maximize
                                              Max
                                              Maximiz
                                                 imize

                           -4± 1      -2± 1       1± 1   3± 1    5± 1   8± 1     10± 1    12± 1    14± 1    17± 1
                         Minimize Minimize Minimize Minimize Minimize Minimize Minimize Minimize Minimize Minimize
                         Maximize Maximize Maximize Maximize Maximize Maximize Maximize Maximize Maximize Maximize

                                                                (k)                                                          (l)                                         (m)

Fig. 3. Examples of unit visualizations. (a) Tallies; (b) I SOTYPES [12]; (c) Circle packing [16]; (d) Kinetica [21]; (e) Beeswarm [23]; (f) Dust &
Magnet [24]; (g) Hierarchical axes [25]; (h) Stacker [26]; (i) Visual sedimentation [8]; (j) SandDance [27]; (k) Gatherplots [28]; (l) Squares [29]; (m)
Past Visions [30].

cation grammar for slicing and dicing datasets and visual space                                                                    libraries such as D3 can be used to describe unit visualizations, and
into mosaics similar to Atom, but their grammar operates at the                                                                    this must be done directly at the mark placement level.
granularity of individual visualization techniques in the resulting
tiles. Overall, there is a tradeoff between the compactness of the                                                                    The grammar we propose in this work, Atom, incorporates
domain-specific grammar versus its expressivity. Atom adds several                                                                 many of the concepts of Wilkinson’s Grammar of Graphics [22],
primitives in order to support a wider set of possible visualizations                                                              such as mark selection, statistical calculation, and aesthetics.
than many of the grammars discussed above.                                                                                         However, in the Grammar of Graphics, only collision modifiers
                                                                                                                                   such as dodging and stacking are used to avoid the overlapping,
                                                                                                                                   which limits the range of potential layouts, whereas Atom provides
                                                                                                                                   more sophisticated such operators. Also, in contrast to GoG-style
3.3   Contributions
                                                                                                                                   grammars, which tend to specify layouts implicitly based on mark
According to our survey, existing declarative grammars are cur-                                                                    choice, visualizations in Atom emerge from a combination of
rently insufficient for describing the class of unit visualizations we                                                             low-level grouping and primitive layout operations. In this way,
have identified in this paper. To date, only low-level programming                                                                 Atom has more in common with rule-based layout systems such as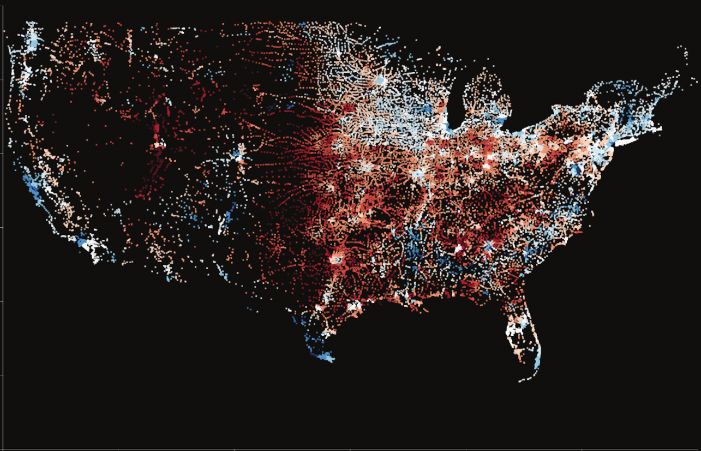
IEEE TRANSACTIONS ON VISUALIZATION AND COMPUTER GRAPHICS                                                                                             5

graftals and L-systems [46].                                              dimension (width, height)—under the constraints that each mark
                                                                          should be disjoint from other marks.
                                                                              Non-overlapping layouts can be further specialized to reduce
4     D ESIGN S PACE OF U NIT V ISUALIZATIONS                             the number of possible layouts and enable efficient comparison
A visualization grammar should be able to express the design space        among visual marks into two common patterns: subdividing and
of the visualization type with minimal specification. In this section,    packing. Subdividing fixes one visual dimension such as width or
we explore the design from the perspectives of visual space, layout,      height to be that of the entire visual space, so that the remaining
and mark representation. We focus on static representations in this       dimension can be determined by the data property. Because one
paper, leaving a survey of animation and interaction patterns for         dimension is maxed out, positioning becomes a trivial matter of
unit visualizations as future work.                                       sorting. Packing, on the other hand, lays out a visual mark—either
                                                                          a square or circle—in an 1:1 aspect ratio. Squarified treemaps [43]
                                                                          or circle packing [53] are examples of a packing layout. Beeswarm
4.1   Visual Space                                                        plots [23] enable more efficient, non-overlapping arrangements of
The visual space dimension determines the visual coordinate               points in a scatterplot. Hieraxes [25] avoids overplotting of visual
system, and typically includes 1D, 2D, and 3D coordinate systems.         marks by stacking them to resemble fluctuation diagrams. Finally,
It is important to distinguish between data dimensions and visual         new packing layouts are based on physicalization, such as the
dimensions. For example, a dotplot represents one data dimension          Kinetica [21] and TouchViz [20] systems, which both use visual
but requires 2D visual space. Similarly, a treemap of a single level      marks that resemble physical objects by occupying space and being
uses a single data dimension, but requires 2D visual space. When          affected by gravity.
the input data is 2D, 3D visual space can be used; for example, in
3D dotplots [26].                                                         4.3    Mark Representation
                                                                          The visual representation of individual marks can either be a static
4.2   Layout                                                              predefined geometry or used as a visual variable mapped by data
                                                                          properties. Rectangles are the most common representation for
The layout strategy decides the positioning of visual marks for each
                                                                          non-overlapping layouts in that they require minimal parameters
data object. We identify two fundamental types of layout strategies
                                                                          to fix in the visual space and are easy to partition recursively.
for unit visualizations: overlapping and non-overlapping layouts.
                                                                          Because non-overlapping unit visualizations show all the data
     Overlapping layouts allow visual marks to intersect on the
                                                                          without overlap, images can be used as marks. Circles also have
display. This means that the position and shape of the marks are
                                                                          been commonly used for both overlapping and non-overlapping
independent, i.e., they can be arranged on the display without
                                                                          layouts, and are particularly common in scatterplots and dotplots.
considering other marks. A scatterplot, which is one of the most
widely used types of statistical graphics, is an example of an
overlapping layout [50]. While simple and effective, scatterplots         5     ATOM : A U NIT V ISUALIZATION G RAMMAR
suffer from overplotting—where two or more marks partially                Above we explored the design space of existing unit visualizations
or completely overlap—when one of the variables mapped to                 and abstracted the underlying principles, especially the layout
position is categorical or countable. Even when both variables in a       operations that differentiate unit visualizations with aggregated
scatterplot are continuous numbers, large or locally dense datasets       visualizations. The grammar we propose in this paper, ATOM,
can yield overplotting. Previously, jittering—where occluded points       is based on this survey, and enables the specification of various
are translated from their original positions to become visible—           visualizations into succinct orthogonal grammar components. Its
was used for categorical variables [22], [51] to intelligently            name, Atom, is obviously derived from the Greek word atomos,
reduce point occlusion [52], or separated using user-controlled           meaning indivisible, in the sense that a visual mark in unit
attractors [24]. Overplotting defeats much of the potential benefits      visualizations are not separable.
of unit visualizations, in that individual points obscure other points,        Unit visualizations are intended for multidimensional datasets.
thus preventing judgment about overall numbers and individual             We can represent a multidimensional dataset as a set D, where each
interactions. Conceptually, however, overplotting “fits” within a         member o is an data object or a row in a data table with attributes
unit specification. In vector file formats such as SVG, the dots are      a1 , a2 , . . . , am , where m is the number of attributes in the dataset.
still in the file’s contents, even though they are not visible. These     The visual space is a set V , which is composed of all points p
hidden units can be revealed by changing the transparency property        in the theoretical space. It is different from a physical canvas on
of each individual marks in some cases when the overlapping is            the display, where the visualization is drawn. For example, we can
not severe. Even though we allow overlapping layouts such as              map a small portion of visual space on the whole output display to
Mapping (as shown in Figure 4) in unit visualizations, we may             zoom in a specific part of visualization. We define a container C
wish to avoid overlap and non-overlapping or space-filling layouts        as a tuple of (Dc ⊆ D, Vc ⊆ V ). The root container is a container
are very common in existing unit visualizations.                          where the data is the entire dataset, and the canvas is the entire
     Non-overlapping (or space-filling [50]) layouts remove over-         visual space. A cell, on the other hand, is a container whose set Dc
plotting by organizing visual marks disjointly in visual space.           contains only one element.
However, avoid overlapping requires developing methods to                      A unit visualization operation is an operation that generates a set
properly partition and organize the output visual spaces. Usually         of subcontainers {(Do1 , Vo1 ), (Do2 , Vo2 ), . . . , (Don , Von )} as output
the position and shape of marks depend on the input domain and            given container Ci = (Di , Vi ) as an input, where the data Doi and
output range at the same time. For example, given a rectangular           the spatial domain Voi satisfies Doi ⊆ Di and Voi ⊆ Do . Hence, a
unit representation in 2D visual space, the layout algorithm must         unit visualization operation is composed of two suboperators in
calculate four parameters for each visual mark—position (x, y) and        the data domain and spatial domain, respectively. Given the parent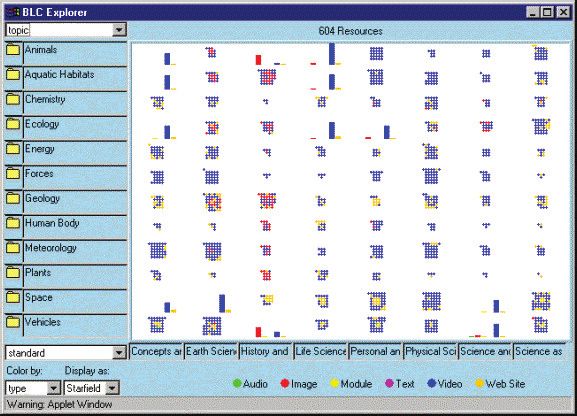
IEEE TRANSACTIONS ON VISUALIZATION AND COMPUTER GRAPHICS 6
TABLE 1
Classification of existing unit visualizations in the literature.
Layout Coordinate System Unit
Geometric shape
Physicalization
Treemap (2D)
Cartographic
Rectangular
Fill (1D)
Map2D
Images
Polar
Pack
Grid
Icon
2D
3D
Name Author Year Fig.
√ √ √ √
Tallies Unknown – √ √ √ √ 3 (a)
Scatterplots Unknown 1600s √ √
Choropleths Dupin 1826 √ √ √ √ √
Stem and leaf Bowley 1900s √ √ √ √ √
Isotypes [12] Neurath 1936 √ √ √ √ √ 3 (b)
Pixel bar charts [18] Keim et al. 1999 √ √ √ √ √
Dotplot [17] Wilkinson 1999 √ √ √ √
Hierarchical axes [25] Shneiderman 2000 √ √ √ √ √ √ 3 (g)
Quant. treemaps [47] Bederson 2001 √ √ √ √
Dust and Magnet [24] Yi et al. 2005 √ √ √ √ 3 (f)
Circle packing [16] Wang 2006 √ √ √ √ 3 (c)
Bubble chart [48] Rosling 2007 √ √ √ √
ScatterDice [19] Elmqvist et al. 2008 √ √ √ √ √ √
PivotViewer MS Livelabs 2009 √ √ √ √ √
Stacker [26] Dang et al. 2010 √ √ √ √ √ √ √ √ √ 3 (h)
SandDance [2] Drucker et al. 2012 √ √ √ √ √ 3 (j)
Histomages [49] Chevalier 2012 √ √ √ √
Kinetica [21] Rzeszotarski 2013 √ √ √ √ √ √ 3 (d)
Constructive vis. [13] Huron et al. 2014 √ √ √ √ √ √ √
Gatherplots [28] Park et al. 2014 √ √ √ √ √ √ 3 (k)
Visual sediment [8] Huron et al. 2014 √ √ √ √ √ √ √ 3 (i)
Phys. token vis. [9] Huron et al. 2014 √ √ √ √ √ √
Beeswarm plots [23] Eklund 2015 √ √ √ √ √
Past Visions [30] Dörk 2016 √ √ √ √ √ 3 (m)
Squares [29] Ren et al. 2016 3 (l)
container, the data domain operation divides a dataset of parent The Atom grammar is formally defined as G = (V, Σ , R, S),
container into a set of datasets for child containers. Based on our where V is a set of variables, Σ is a set of terminals, R is a set of
design space, these are the most common such operations: production rules, and S is a start symbol.
Here are the production rules R in BNF notation [54]:
• BIN: Partitioning of D according to the values of attributes
such that all subsequent child groups will contain the hStarti ::= hRootihLayoutsihMarksi (1)
different values of an attribute; hRooti ::= DATA CANVAS (2)
• DUPLICATE: Duplicate D into subcontainers;
hLayoutsi ::= hLayouti|hLayoutihLayoutsi (3)
• FILTER: Partition according to a given condition such that
one group contains data object that meets the condition and hLayouti ::= hDataOpihVisualPolicyi (4)
the other group contains the remainder; and hDataOpi ::= hBinOpi|DUPLICAT E|hFilterOpi|FLAT T EN
• FLATTEN: Partition so each subcontainer has a single item. (5)
hBinOpi ::= BIN|BIN BINSIZE (6)
The spatial domain operation splits the parent space into child
spaces and assigns them to the output datasets of the data domain hFilterOpi ::= FILT ER CONDIT ION (7)
operation to produce the child containers. We list the most common hVisualPolicyi ::= hVisualOpihSizeihisSharedi (8)
spatial domain operations in Figure 5. hVisualOpi ::= MAP2D|FILLX|FILLY |MAXFILL|PACK
To produce the target visualizations, our grammar builds a root (9)
container and recursively applies unit visualization operations until
hMarksi ::= hSizeihShapeihAlignmentihisSharedi (10)
all containers become cells. In other words, rendering becomes a
tree traversal, where the root container is the root of the tree and hSizei ::= UNIFORM|hSizeFunci (11)
the cell containers are leaves. Once all cells have been generated, hSizeFunci ::= COUNT |SUM VAR (12)
the layout is complete and the visualization can be drawn. hShapei ::= CIRCLE|RECTANGLE (13)
These recursive layout operations are inspired by the layout hisSharedi ::= T RUE|FALSE (14)
process of product plots [41]. Atom can be thought of as closely
related to product plot because space-filling layouts are quite similar A visualization can be defined by specifying the root container
to the composition rule of product plots. However, overlapping hRooti, the layout operations, and how individual marks will be
plots such as scatterplots are not within the scope of product plots, represented, as shown in Rule (1). The root container requires
and Atom adds a cell operation at the end of layout operations, the data and the associated canvas for visualization (Rule (2)).
making all data points unique visual marks. Rule (3) states that there can be one or more layouts. Each layout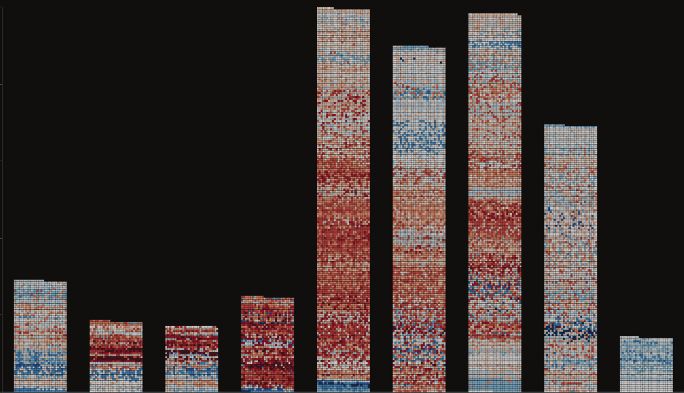
IEEE TRANSACTIONS ON VISUALIZATION AND COMPUTER GRAPHICS                                                                                                                                                  7

            Map2D                                                         FillX                                                  FillY                        MaxFill                         Pack
         Size: Uniform                                               Size: Uniform                                          Size: Uniform                  Size: Uniform                 Size: Uniform

            Map2D                                                      FillX                                                    FillY                          MaxFill                        Pack
       Size: Count, Sum                                         Size: Count, Sum                                         Size: Count, Sum                Size: Count, Sum              Size: Count, Sum

Fig. 4. Visual representations of example operations (VisualOp) and the resulting subcontainers for unit visualizations.

                                                                                                                                    to both data operations and visual operations. This is needed when
                                                Layout
                                                                                                                                    a child container does not have all the information to be properly
                                                                                                                                    laid out, and information from siblings is required.
              Overlapping                                                Space-filling                                                  As a concrete example, in Figure 7 a container containing 1st
                                                                                                                                    Class passengers would like to apply the second layout operation
                                                                                                                                    of (Flatten, PackXY ). However, it does not know what should be
      Map2D                 jittering                  Subdivision                                   Packing
                                                                                                                                    the size of the cell container, because it has only information about
                                                                                                                                    the number of 1st Class passengers. To calculate the size of a cell
                                            1D
                                        fillX, fillY
                                                                    2D                      Grid
                                                                                                               Physicalization      size, it has to know the number of objects in the most crowded
                                                                 Treemap                 pack, maxfill
                                                                                                                                    container, here 3rd Class passengers. Sharing is a mechanism to
                                                                                                                                    synchronize the operation among the sibling containers.
                                                                                                                                        When sharing is enabled, the input domains are shared among
Fig. 5. Common layout operations for unit visualizations.                                                                           siblings. Otherwise, the input domain is limited to the current
                                                                                                                                    container. For example, Figure 7 shows that by changing the sharing
                                                                                                                                    settings of the size variable, we can create absolute and relative
is composed of a data operation and visual policy (Rule (4)).                                                                       versions of the Titanic passengers faceted among class. Sharing
Available data operations are shown in Rule (5). The BIN operation                                                                  settings are hierarchical, meaning that each level can have its own
can be performed according to attribute values in the case of                                                                       sharing configuration on or off, and these affect to what extent the
nominal variables, and can have an optional BINSIZE parameter                                                                       domain is shared as shown in Figure 8. A useful way to understand
that indicates the number of bins in the case of continuous variables,                                                              the sharing flag is thinking of it as a way to specify whether the
as in Rule (6). A visual policy is composed of a visual operation,                                                                  container should be “absolute” or “relative” with sibling containers.
size setting, and the hisSharedi setting (Rule (8)). Size can be
either uniform or a function of the contents (Rule (11)). Figure 4
                                                                                                                                    5.2     View Composition
shows operations in the Atom grammar with the variable size vs.
uniform size. If type is sum, it can have an additional key parameter                                                               Existing grammars, such as Vega-Lite [40] or Grammar of
that will determine the variables to be summed (Rule (12)).                                                                         Graphics [22], use a separate view composition algebra to construct
    Finally, a visual mark is specified using geometric attributes.                                                                 multiple views. In Atom, no such view composition operators are
The available attributes are simple because a single mark is drawn                                                                  needed; we can instead use the existing layout operations to build
on a cell container, where there is only one data object.                                                                           small multiple charts and multiple views.
    As a concrete example, we will use the Titanic dataset to                                                                           More specifically, to generate a faceted chart in Atom, where
explain how our unit grammar can draw the unit column chart in                                                                      data is separated across multiple views, we can use the BIN operator
Figure 6. The root container is the container, where D is a set                                                                     to partition the data into the separate regions. For a repeated chart,
that contains all the people on the Titanic, and V is given as the                                                                  where the same data is replicated across multiple representations,
whole canvas to draw. The pack aspect ratio can lead to wasted                                                                      we can use DUPLICATE to disseminate the data to all views.
space, especially when there is a small number of data points inside
a container. To resolve this, we use maxfill to find an optimal                                                                     5.3     Implementation Details
aspect ratio that is close to pack while removing empty space.
                                                                                                                                    Our implementation of Atom is built in JavaScript using D3 [33]
                                                                                                                                    and Scalable Vector Graphics (SVG) [55]. The core part of the code
5.1    Shared Property                                                                                                              is 1,186 lines. A website with more examples and an interactive
Operations in Atom have a sharing setting to control the input                                                                      editor is available at https://intuinno.github.io/unit, and the software
domains for the visual variable calculation. Sharing can be applied                                                                 is available as open source. Extensibility is an important aspect of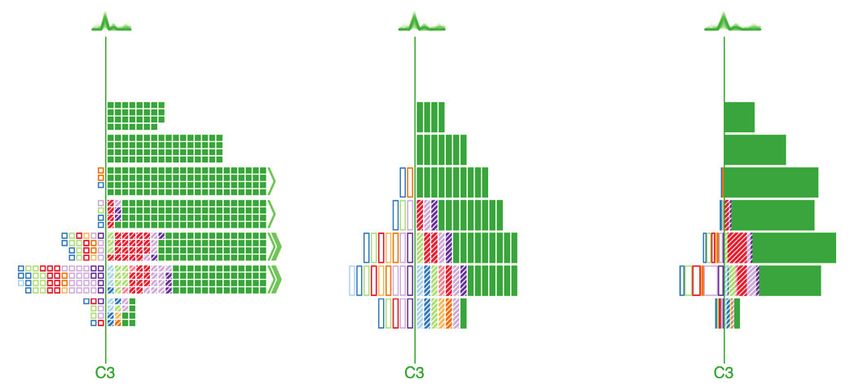
IEEE TRANSACTIONS ON VISUALIZATION AND COMPUTER GRAPHICS                                                                                                                                           8

{
    "data": "data/titanic.csv",
    "width": 320, "height": 240, "padding": {..},                         Root Container
    "layouts": [{
      "name": "layout1",
      "type": "gridxy",
      "subgroup": { "type": "groupby", "key": "Class" },
      "aspect_ratio": "fillX",                                            Layout 1
      "size": { "type": "uniform", "isShared": false },
      "direction": "LRBT", "align": "LB",                                                                                                                                             Male
      "margin": { ... }, "padding": {... }
    }, {
      "type": "gridxy",
      "subgroup": { "type": "groupby", "key": "Gender", "isShared": true },
      "aspect_ratio": "fillY",                                            Layout 2
      "size": { "type": "uniform", "isShared": true },
     }, {
      "subgroup": { "type": "flatten" },
      "aspect_ratio": "square",
      "size": { "type": "uniform", "isShared": true },                    Layout 3
      "sort": { "key": "Survived"}                                                                                                                                                    Female
    }],
    "mark": {
      "shape": "circle",
      "color": { "key": "Survived", "type": "categorical" },
                                                                          Draw Shape
      "size": { "type": "max", "isShared": false },

    }
      "isColorScaleShared": true                                                                 1st                     2nd                     3rd                   Crew
}

Fig. 6. Example grammar to generate a unit column chart for survivors of the Titanic by passenger class.

{ ...,                                                                                                     { ...,
  "layouts": [{                                                                                              "layouts": [{
    "subgroup": { "type": "groupby", "key": "pclass" },                                                        "name": "layout1",
    "aspect_ratio": "fillX",                                                                                   "subgroup": { "type": "groupby", "key": "gender" },
  }, {                                                                                                         "aspect_ratio": "fillY",
    "name": "layout2",                                                                                       },{
    "type": "gridxy",                                                                                          "name": "layout2",
                                                                                                               "subgroup": { "type": "groupby", "key": "pclass" },
    "subgroup": { "type": "flatten" },
                                                                                                               "size": { "type": "uniform", "isShared": ? }
    "aspect_ratio": "maxfill",                                                                                 "aspect_ratio": "fillX",
    "size": { "type": "uniform", "isShared": ? }                                                             }, {
}]                                                                                                             "name": "layout3",
  "mark": {                                                                                                    "subgroup": { "type": "flatten" },
}                                                                                                              "size": { "type": "uniform", "isShared": ? }
                                                                                                           }]
                                                                                                             "mark": {
             isShared: true                                                isShared: false                 }

                                                                                                                                                 Female

                                                                                                                                                  Male

                                                                                                         1st       2nd        3rd       Crew                1st       2nd      3rd       Crew

                                                                                                       (a) Layout 2 : false, Layout 3 : true              (b) Layout 2 : false, Layout 3 : false
                            (a)                                                            (b)
                                                                                                 Fig. 8. Sharing can be applied hierarchically. Here the Titanic dataset
                                                                                                 has been faceted by gender and passenger class. In Figure 6, every
Fig. 7. Unit visualization for the Titanic dataset. By varying the sharing                       facet shares the size by setting the size sharing property of “layout2” and
flag of the size variable for the second packing layout, we can create both                      “layout3” as true. This yielded a unit bar chart where every dot size is
absolute and relative versions. In (a) we can see that the least number of                       same and the size is adjusted such that the most crowded facet can fill
second class passengers survived (absolute count), but (b) shows that                            the assigned space. However, (a) shares size only in layout2 that the
third class passengers had the least (relative) chance of survival.                              unit will be the same size among the class but not across genders. This
                                                                                                 is in contrast to (b), where sizes are independent of gender and class,
                                                                                                 meaning that every unit will be scaled up to fill their subcontainer.

grammars, where users can add various layout functions such as
packing algorithms for polar or three-dimensional coordinates. We                                6.1     Expressive Power
leave for future work refactoring of the code base to better support                             Table 2 shows how existing unit visualizations can be expressed
such extensibility.                                                                              with grammar components. Basically, we have been able to use
                                                                                                 Atom to recreate all of the examples in Table 1, with the exception
                                                                                                 of dotplots [17] since these use a more complex packing algorithm.
6          E VALUATION
Given our terminology of unit vs. aggregated visualization, we                                   6.2     Generative Power
here discuss when unit visualizations are appropriate. We will also                              Figure 9 shows a novel visualization that can be generated using
discuss their limitations and strategies to overcome these.                                      Atom. The passengers in the Titanic dataset were faceted according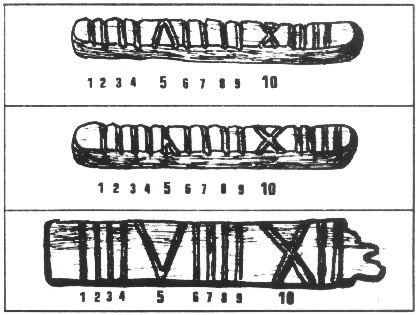
IEEE TRANSACTIONS ON VISUALIZATION AND COMPUTER GRAPHICS                                                                                                    9

                               TABLE 2
                                                                                                                                   Root Container
           Expressing existing unit visualizations using Atom.
                                                                                                                                   FillY, Gender
    Type                     Operation              Note                                                                           Size : Uniform
    Scatterplots             Map2D
                             FillX or FillY                                                                                        FillX, Passenger class
    Bar+column chart
                             MaxFill                                                                                               Size : Uniform
                             FillTheta
    Unit pie chart                                  Polar coords
                             Pack                                                                                                  Pack
                             FillX                                                                                                 Size : Count, Shared
    Isotypes [12]
                             Pack
    Choropleths              Map2D                  GIS data                                                                       Draw
                             FillX
    Dotplot [17]             FillY                  Original dotplot
                             Pack                   not feasible              Fig. 10. Unique visualization generated using Atom. Here the passengers
                             FillX                                            of the Titanic were faceted according to their gender (vertical) and their
    Hierarchical axes [25]   FillY                                            class (horizontal), and then each unit was colored based on survival (blue
                             Pack (center-align)                              passengers survived).
                             MaxFill
    Quantum Treemap [47]                           MaxFill       with
                             Pack
                                                   variable size
    Bubble Chart [48]        Map2D                 Variable size              7.1   Comparison to Existing Declarative Grammars
                             FillX
    PivotViewer              FillY                  Image as mark             As mentioned earlier, classic declarative grammars for visual-
                             Pack
                                                                              izations, such as those that build upon the work of Wilkinson’s
    SandDance [27]           Multiple operations
                             FillX (Duplicates)                               Grammar of Graphics [22], are in wide use. In these systems,
    Histoimages [49]         Left (Image): Map2D    Colored pixel as          layouts are typically specified using a combination of mark type
                             Right (Histo): Pack    mark                      (bars, circles, or points, etc.) and a method for mapping attributes
                             FillY
    Squares [29]                                    Rectangle/square          of those marks using the data. While we could extend such systems
                             Pack or FillX
                             FillX                                            to generate unit visualizations by adding additional layout rules, the
    Past Visions [30]                               Image as mark
                             Square                                           way that Atom specifies visualizations is done in a fundamentally
                                                                              different manner: in Atom, visualizations emerge from the recursive
                                                                              application of a small set of primitive rules and layouts at different
to the passenger class and each passenger is represented with a               levels of aggregation. In this manner, Atom shares more in common
rectangle. The area of the rectangle is proportional to the fare that         with parallel rewriting systems such as L-systems and graftals [46],
each passenger paid and sorted so that people who paid the most               where graphics emerge from the successive application of a series
are located in the top-left. The ratio between the price and the              of substitution rules. The difference is that Atom adds the notion of
area of the rectangle is shared among child containers so that the            data and aggregate measures to those rules. For example, barcharts
comparison between passenger classes is immediately identifiable.             or scatterplots are never specified explicitly, but are specified
The visualization is a combination of unit-based barcharts and a              through grouping and packing relationships.
treemap layout succinctly expressed as an ATOM specification.                     Also, as previously mentioned, product plots [41] are closely
    Similarly, Figure 10 shows another novel visualization where a            related, where a combination of rules produce plots that allow
small variation in the layout specification generates an unit variation       for the visualizations of joint distributions and counts. Since most
of the fluctuation chart.                                                     packing layouts of units are proportional to area, unit visualizations
                                                                              specified in Atom can achieve much of the expressive power of
                                                     Root Container           product plots. Similar patterns are found in prior work for domain-
                                                                              specific grammars such as the one proposed by Schultz et al. for
                                                     FillX, Passenger class   treemaps [56]. Their work defines both a theoretical design space
                                                     Size : Uniform
                                                                              as well as a tool for rapid visualization development.
                                                     FillY, Passenger class
                                                     Size : Sum, Shared
                                                                              7.2   Exploration of the Design Space
                                                     Pack
                                                     Size : Sum, Shared
                                                                              It is intriguing to explore how new types of visualizations might
                                                                              emerge through systematically applying different rules at different
                                                     Draw                     levels of aggregation. Figures 9 and 10 show two different
     1st             2nd         3rd                                          visualizations that come from the successive application of those
                                                                              rules. The space of possible combinations, though, is extremely
Fig. 9. Unique visualization generated using Atom. Here the passengers
                                                                              large, and it is beyond the scope of this paper to figure out effective
of the Titanic were faceted according to their class, and then each unit
was sized by the price of the ticket.                                         ways for narrowing the enumeration of parameters that produce
                                                                              effective visualizations. Instead we have found that there are
                                                                              certain heuristic situations where unit visualizations are particularly
                                                                              effective in contrast to aggregate visualizations; we list them below.
7    D ISCUSSION                                                              This is by no means an exhaustive list, but our work in this
Below we discuss some of the finer points of our work on the Atom             paper lays the foundation for a systematic enumeration of possible
unit visualization grammar.                                                   visualization parameters.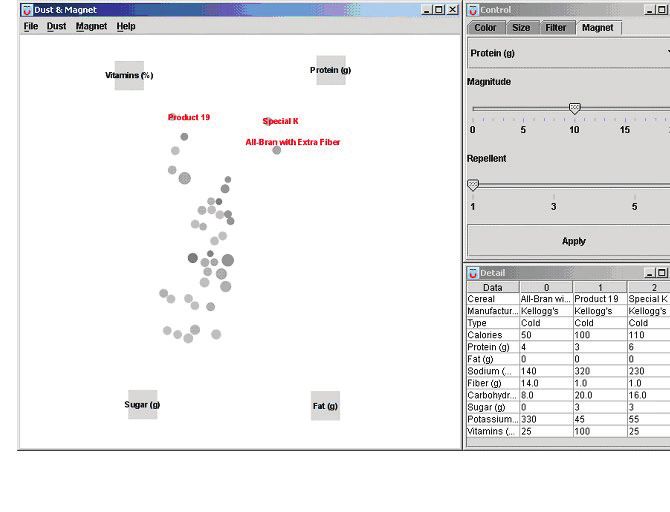
IEEE TRANSACTIONS ON VISUALIZATION AND COMPUTER GRAPHICS                                                                                                   10

      •    To deliver relative percentage or probability: When              vocabulary of visualization techniques—such as dotplots, mosaic
           represented in an aggregated visualization, count or relative    plots, and scatterplots—but our investigation in this paper has
           percentage can be ambiguous in the users’ mental model.          revealed that their design space is actually much larger than was
           A classic example is a Bayesian inference problem. For           previously known. To better capture this new family of techniques,
           example, a small percentage in a large group can mean            we developed ATOM, a grammar for unit visualizations based
           much larger absolute numbers than a large percentage in a        on a declarative specification. Our implementation of the Atom
           small group. This concept is notoriously difficult to deliver    grammar can generate any arbitrary unit visualization in this design
           effectively using text. Garcia-Retamero and Hoffrage found       space. To validate the expressive power of the grammar, we have
           that doctors and patients can make more accurate inferences      presented examples of a large number of existing unit visualizations
           when information was communicated in natural frequencies         expressed as Atom specifications; to validate its generative power,
           rather than probabilities [57]. This is also the underlying      we have also suggested a number of novel ones.
           problem for the so-called Simpson’s paradox [58], where              Our work in this paper is part of a larger trend in the
           aggregate averages can be deceptive in comparison to the         visualization community of abstracting visualizations into high-
           underlying counts.                                               level declarative grammars. These grammars reduce the need for
      •    To show underlying distribution of statistical summary:          in-depth programming knowledge and instead enables specifying
           Wilkinson recommends a tally, stem-and-leaf, or a dotplot        visualizations in terms of marks, layout, and data. The Atom
           as a starting point for analysis instead of commonly             grammar is specialized for unit visualizations, and it can surely
           recommended bar charts or kernel density estimations [22].       be further refined to support additional visual marks, interaction
           For example, in his book he states that histograms do not        techniques, and layouts in the future. However, a longer-term
           reveal granular data, but other unit visualizations do.          research vision should be to find a definitive grammar that can
      •    To show outliers: Outliers are often lost when using an          unify many of these existing grammars, while retaining both the
           aggregate visualization because the individual values are        simplicity and the power of the original ones.
           averaged in with the rest to produce a single summary
           statistic. By showing the units themselves, with appropriate
           attributes such as color and shape applied, outliers and their   ACKNOWLEDGMENTS
           context can be more easily identified.                           We thank the anonymous reviewers for their helpful reviews. Deok
                                                                            Gun Park and Niklas Elmqvist were partially supported by U.S.
7.3       Animation and Interaction                                         National Institutes of Health (NIH) grant R01GM114267. Any
One of the distinct advantages of unit visualizations is that there is      opinions, findings, and conclusions or recommendations expressed
a one-to-one correspondence for units in one layout with units in           in this article are those of the authors and do not necessarily reflect
another layout. This allows for straightforward animated transitions        the views of the funding agencies.
when switching between different unit visualizations for the same
data by linearly interpolating the positions for each element from          R EFERENCES
its initial and final positions. Staggered starting times [7], [59],
staged animations [60], or path clustering [61] can be used to help         [1]    S. K. Card, J. D. Mackinlay, and B. Shneiderman, Eds., Readings in
                                                                                   Information Visualization — Using Vision to Think. Morgan Kaufmann
create more interpretable animated transitions.                                    Publishers, 1999.
     Original declarative grammars focused on the generation of             [2]    S. Drucker and R. Fernandez, “A unifying framework for animated and
static visualizations, as in the case of Grammar of Graphics or gg-                interactive unit visualizations,” Tech. Rep., August 2015.
plot2. However, as interactive visualizations become more common,           [3]    N. Elmqvist and J.-D. Fekete, “Hierarchical aggregation for informa-
                                                                                   tion visualization: Overview, techniques and design guidelines,” IEEE
recent advances allow for describing interactive interactions with                 Transactions on Visualization and Computer Graphics, vol. 16, no. 3, pp.
declarative specifications. Reactive Vega by Satyanarayan et al. [39]              439–454, 2010.
is the first grammar that can specify interactions with declarative         [4]    M. C. F. de Oliveira and H. Levkowitz, “From visual data exploration to
                                                                                   visual data mining: A survey,” IEEE Transactions on Visualization and
specifications. Vega-Lite [40] further simplified the specification                Computer Graphics, vol. 9, no. 3, pp. 378–394, Jul./Sep. 2003.
by using intelligent defaults and showing novel interactions by             [5]    P. Cavanagh and G. A. Alvarez, “Tracking multiple targets with multifocal
enumerating over specifications.                                                   attention,” Trends in Cognitive Sciences, vol. 9, no. 7, pp. 349–354, 2005.
     Our Atom grammar currently does not include support for                [6]    Z. W. Pylyshyn and R. W. Storm, “Tracking multiple independent targets:
                                                                                   Evidence for a parallel tracking mechanism,” Spatial Vision, vol. 3, pp.
interactivity, but is at this point only a visual specification language,          179–197, 1988.
similar to the original Grammar of Graphics [22] or ggplot2 [37].           [7]    P. Dragicevic, A. Bezerianos, W. Javed, N. Elmqvist, and J.-D. Fekete,
On the other hand, by focusing on the specific domain of unit                      “Temporal distortion for animated transitions,” in Proceedings of the
                                                                                   ACM Conference on Human Factors in Computing Systems, 2011, pp.
visualizations, as Atom does, we can still enable interactions that                2009–2018.
are common to all unit visualizations, such as item-level selection,        [8]    S. Huron, R. Vuillemot, and J.-D. Fekete, “Visual sedimentation,” IEEE
details-on-demand, filtering, and cross-highlighting. Further inter-               Transactions on Visualization and Computer Graphics, vol. 19, no. 12, pp.
action, such as focus+context layouts, advanced navigation, and                    2446–2455, 2013.
                                                                            [9]    S. Huron, Y. Jansen, and S. Carpendale, “Constructing visual represen-
query operations, are left as future work.                                         tations: Investigating the use of tangible tokens,” IEEE Transactions on
                                                                                   Visualization and Computer Graphics, vol. 20, no. 12, pp. 2102–2111,
                                                                                   2014.
8         C ONCLUSION AND F UTURE W ORK                                     [10]   B. Shneiderman, “The eyes have it: A task by data type taxonomy for
In this paper, we have defined a new family of visualizations that                 information visualizations,” in Proceedings of the IEEE Symposium on
                                                                                   Visual Languages, 1996, pp. 336–343.
are based on maintaining the unique identity of each visual mark
                                                                            [11]   G. P. Ellis and A. J. Dix, “A taxonomy of clutter reduction for informa-
as well as its direct one-to-one mapping to a data item. Many of                   tion visualisation,” IEEE Transactions on Visualization and Computer
these so-called unit visualizations are already part of the standard               Graphics, vol. 13, no. 6, pp. 1216–1223, 2007.
IEEE TRANSACTIONS ON VISUALIZATION AND COMPUTER GRAPHICS 11
[12] O. Neurath, International Picture Language; the First Rules of Isotype: [39] A. Satyanarayan, R. Russell, J. Hoffswell, and J. Heer, “Reactive Vega: A
With Isotype Pictures. K. Paul, Trench, Trubner & Company, 1936. streaming dataflow architecture for declarative interactive visualization,”
[13] S. Huron, S. Carpendale, A. Thudt, A. Tang, and M. Mauerer, “Construc- IEEE Transactions on Visualization and Computer Graphics, vol. 22,
tive visualization,” in Proceedings of the ACM Conference on Designing no. 1, pp. 659–668, 2016.
Interactive Systems, 2014, pp. 433–442. [40] A. Satyanarayan, D. Moritz, K. Wongsuphasawat, and J. Heer, “Vega-lite:
[14] N. Fitzallen and J. Watson, “Developing statistical reasoning facilitated by A grammar of interactive graphics,” IEEE Transactions on Visualization
TinkerPlots,” in Proceedings of the International Conference on Teaching and Computer Graphics, pp. 1–1, 2017.
Statistics, 2010. [41] H. Wickham and H. Hofmann, “Product plots,” IEEE Transactions on
[15] J. Bertin, Semiology of Graphics. Madison, Wisconsin: University of Visualization and Computer Graphics, vol. 17, no. 12, pp. 2223–2230,
Wisconsin Press, 1983. 2011.
[16] W. Wang, H. Wang, G. Dai, and H. Wang, “Visualization of large hierar- [42] T. Baudel and B. Broeksema, “Capturing the design space of sequential
chical data by circle packing,” in Proceedings of the ACM Conference on space-filling layouts,” IEEE Transactions on Visualization and Computer
Human Factors in Computing Systems, 2006, pp. 517–520. Graphics, vol. 18, no. 12, pp. 2593–2602, 2012.
[17] L. Wilkinson, “Dot plots,” The American Statistician, vol. 53, no. 3, pp. [43] B. Shneiderman and M. Wattenberg, “Ordered treemap layouts,” in
276–281, 1999. Proceedings of the IEEE Symposium on Information Visualization, 2001,
pp. 73–78.
[18] D. A. Keim, M. C. Hao, U. Dayal, and M. Hsu, “Pixel bar charts: a visu-
[44] M. Friendly, “A brief history of the mosaic display,” Journal of Computa-
alization technique for very large multi-attribute data sets,” Information
tional and Graphical Statistics, vol. 11, no. 1, pp. 89–107, 2002.
Visualization, vol. 1, no. 1, pp. 20–34, 2002.
[45] S. MacNeil and N. Elmqvist, “Visualization mosaics for multivariate
[19] N. Elmqvist, P. Dragicevic, and J.-D. Fekete, “Rolling the dice: Multidi-
visual exploration,” Computer Graphics Forum, vol. 32, no. 6, pp. 38–50,
mensional visual exploration using scatterplot matrix navigation,” IEEE
2013.
Transactions on Visualization and Computer Graphics, vol. 14, no. 6, pp.
[46] P. Prusinkiewicz and A. Lindenmayer, The Algorithmic Beauty of Plants.
1539–1148, 2008.
Springer-Verlag, 1990.
[20] J. M. Rzeszotarski and A. Kittur, “TouchViz: (multi)touching multivariate [47] B. B. Bederson, “PhotoMesa: a zoomable image browser using quantum
data,” in Extended Abstracts of the ACM Conference on Human Factors treemaps and bubblemaps,” in Proceedings of the ACM Symposium on
in Computing Systems, 2013, pp. 3119–3122. User Interface Software and Technology, 2001, pp. 71–80.
[21] ——, “Kinetica: naturalistic multi-touch data visualization,” in Proceed- [48] V. Battista and E. Cheng, “Motion charts: Telling stories with statistics,”
ings of the ACM Conference on Human Factors in Computing Systems. in American Statistical Association Joint Statistical Meetings, 2011, pp.
ACM, 2014, pp. 897–906. 4473–4483.
[22] L. Wilkinson, The Grammar of Graphics. Springer Science & Business [49] F. Chevalier, P. Dragicevic, and C. Hurter, “Histomages: fully synchro-
Media, 2006. nized views for image editing,” in Proceedings of the ACM Symposium
[23] A. Eklund, beeswarm: The Bee Swarm Plot, an Alternative to on User Interface Software and Technology, 2012, pp. 281–286.
Stripchart, 2016, R package version 0.2.3. [Online]. Available: [50] J.-D. Fekete and C. Plaisant, “Interactive information visualization of a
https://CRAN.R-project.org/package=beeswarm million items,” in Proceedings of the IEEE Symposium on Information
[24] J. S. Yi, R. Melton, J. T. Stasko, and J. A. Jacko, “Dust & magnet: multi- Visualization, 2002, pp. 117–124.
variate information visualization using a magnet metaphor,” Information [51] J. Tukey and P. Tukey, “Strips displaying empirical distributions: I.
Visualization, vol. 4, no. 3, pp. 239–256, 2005. textured dot strips,” Bellcore Technical Memorandum, Tech. Rep., 1990.
[25] B. Shneiderman, D. Feldman, A. Rose, and X. F. Grau, “Visualizing [52] M. Trutschl, G. Grinstein, and U. Cvek, “Intelligently resolving point
digital library search results with categorical and hierarchical axes,” in occlusion,” in Proceedings of the IEEE Symposium on Information
Proceedings of the ACM Conference on Digital Libraries, 2000, pp. 57–66. Visualization, 2003, pp. 131–136.
[26] D. T. Nhon, L. Wilkinson, and A. Anand, “Stacking graphic elements to [53] K. Stephenson, Introduction to circle packing: The theory of discrete
avoid over-plotting,” IEEE Transactions on Visualization and Computer analytic functions. Cambridge University Press, 2005.
Graphics, vol. 16, no. 6, pp. 1044–1052, 2010. [54] D. E. Knuth, “Backus normal form vs. Backus-Naur Form,” Communica-
[27] “Sanddance,” https://www.microsoft.com/en-us/research/project/ tions of the ACM, vol. 7, no. 12, pp. 735–736, 1964.
sanddance/, accessed: 2017-09-30. [55] J. Ferraiolo, F. Jun, and D. Jackson, Scalable vector graphics (SVG) 1.0
[28] D. G. Park, S.-H. Kim, and N. Elmqvist, “Gatherplots: Extended specification. iuniverse, 2000.
scatterplots for categorical data,” University of Maryland, College Park, [56] H.-J. Schulz, S. Hadlak, and H. Schumann, “The design space of implicit
Tech. Rep. HCIL-2016-10, 2016. hierarchy visualization: A survey,” IEEE Transactions on Visualization
[29] D. Ren, S. Amershi, B. Lee, J. Suh, and J. D. Williams, “Squares: and Computer Graphics, vol. 17, no. 4, pp. 393–411, 2011.
Supporting interactive performance analysis for multiclass classifiers,” [57] R. Garcia-Retamero and U. Hoffrage, “Visual representation of statistical
IEEE Transactions on Visualization and Computer Graphics, no. 1, pp. information improves diagnostic inferences in doctors and their patients,”
61–70, 2017. Social Science & Medicine, vol. 83, pp. 27–33, Apr. 2013.
[30] K. Glinka, C. Pietsch, C. Dilba, and M. Dörk, “Linking structure, texture [58] C. R. Blyth, “On Simpson’s paradox and the sure-thing principle,” Journal
and context in a visualization of historical drawings by Frederick William of the American Statistical Association, vol. 67, no. 338, pp. 364–366,
IV (1795-1861),” International Journal for Digital Art History, no. 2, 1972.
2016. [59] F. Chevalier, P. Dragicevic, and S. Franconeri, “The not-so-staggering
[31] J. Heer, S. K. Card, and J. A. Landay, “prefuse: a toolkit for interactive effect of staggered animated transitions on visual tracking,” IEEE
information visualization,” in Proceedings of the ACM Conference on Transactions on Visualization and Computer Graphics, vol. 20, no. 12, pp.
Human Factors in Computing Systems, 2005, pp. 421–430. 2241–2250, 2014.
[60] J. Heer and G. Robertson, “Animated transitions in statistical data
[32] C. Reas and B. Fry, Processing: a programming handbook for visual
graphics,” IEEE Transactions on Visusalization and Computer Graphics,
designers and artists. MIT Press, 2007, no. 6812.
vol. 13, no. 6, pp. 1240–1247, 2007.
[33] M. Bostock, V. Ogievetsky, and J. Heer, “D3 data-driven documents,” [61] F. Du, N. Cao, J. Zhao, and Y.-R. Lin, “Trajectory bundling for animated
IEEE Transactions on Visualization and Computer Graphics, vol. 17, transitions,” in Proceedings of the ACM Conference on Human Factors in
no. 12, pp. 2301–2309, 2011. Computing Systems, 2015, pp. 259–268.
[34] M. Bostock and J. Heer, “Protovis: A graphical toolkit for visualization,”
IEEE Transactions on Visualization and Computer Graphics, vol. 15,
no. 6, pp. 1121–1128, 2009.
[35] J. Heer and M. Bostock, “Declarative language design for interactive vi-
sualization,” IEEE Transactions on Visualization and Computer Graphics,
vol. 16, no. 6, pp. 1149–1156, 2010.
[36] A. Satyanarayan, K. Wongsuphasawat, and J. Heer, “Declarative interac-
tion design for data visualization,” in Proceedings of the ACM Symposium
on User Interface Software and Technology, 2014, pp. 669–678.
[37] H. Wickham, ggplot2: elegant graphics for data analysis. Springer,
2016.
[38] W. Chang and H. Wickham, “ggvis: Interactive grammar of graphics. R
Package Version 0.4.2,” http:// CRAN.R-project.org/ package=ggvis, 2015.You can also read