VoterFraud2020: a Multi-modal Dataset of Election Fraud Claims on Twitter - export.arXiv.org
←
→
Page content transcription
If your browser does not render page correctly, please read the page content below
VoterFraud2020: a Multi-modal Dataset of Election Fraud Claims on Twitter
                                                         Anton Abilov1,2 , Yiqing Hua1,2 , Hana Matatov3 , Ofra Amir3 , Mor Naaman1,2
                                                                             1
                                                                               Cornell Tech 2 Cornell University 3 Technion
                                            aa2776@cornell.edu, yiqing@cs.cornell.edu, hanama888@gmail.com, oamir@technion.ac.il, mor@jacobs.cornell.edu

                                                                     Abstract                                  et al. 2011; Allcott and Gentzkow 2017), and the 2020 elec-
arXiv:2101.08210v1 [cs.SI] 20 Jan 2021

                                                                                                               tion was no exception (Ferrara et al. 2020). In particular,
                                           The wide spread of unfounded election fraud claims sur-
                                                                                                               Twitter has been the focus of public and media attention as a
                                           rounding the U.S. 2020 election had resulted in undermining
                                           of trust in the election, culminating in violence inside the U.S.   prominent public square where ideas are adopted and claims
                                           capitol. Under these circumstances, it is critical to understand    – false or true – are spread (Vosoughi, Roy, and Aral 2018;
                                           discussions surrounding these claims on Twitter, a major plat-      Grinberg et al. 2019). It is thus important to understand the
                                           form where the claims disseminate. To this end, we col-             participants, discussions, narratives, and allegations around
                                           lected and release the VoterFraud2020 dataset, a multi-modal        voter fraud claims on this specific platform.
                                           dataset with 7.6M tweets and 25.6M retweets from 2.6M                  In this work, we release VoterFraud2020, a multi-modal
                                           users related to voter fraud claims. To make this data immedi-      Twitter dataset of 7.6M tweets and 25.6M retweets that are
                                           ately useful for a wide area of researchers, we further enhance     related to voter fraud claims. Using a manually curated set of
                                           the data with cluster labels computed from the retweet graph,
                                           user suspension status, and perceptual hashes of tweeted im-
                                                                                                               keywords (e.g., “voter fraud” and “#stopthesteal”) that was
                                           ages. We also include in the dataset aggregated information         further expanded using a data-driven approach, we streamed
                                           for all external links and YouTube videos that appear in the        Twitter activities between October 23rd and December 16th,
                                           tweets. Preliminary analyses of the data show that Twitter’s        2020. We performed various validations on the limits of
                                           ban actions mostly affected a specific community of voter           our stream, given Twitter’s API constraints (Morstatter et al.
                                           fraud claim promoters, and exposes the most common URLs,            2013), and estimate that we were able to retrieve around 60%
                                           images and YouTube videos shared in the data.                       of the data containing our crawled keywords.
                                                                                                                  We further enhanced the VoterFraud2020 dataset in order
                                                               1    Introduction                               to make it accessible for a broader set of researchers and fu-
                                                                                                               ture research: (1) We cluster users according to their retweet-
                                         Free and fair elections are the foundation of every democ-            ing dynamics and release the cluster labels; (2) Given Twit-
                                         racy. The 2020 presidential election in the United States was         ter’s widespread post-election suspension action, we crawl
                                         probably one of the most consequential and contentious such           and include the user status as of January 10th, 2021; (3) We
                                         events. Two-thirds of the voting-eligible population voted,           compute and share the perceptual hashes of 168K images
                                         resulting in the highest turnout in the past 120 years (Schaul,       that appeared in the data; (4) We aggregate and share meta-
                                         Rabinowitz, and Mellnik 2020). The Democratic Party can-              data about 138K external links that appeared in the tweets,
                                         didate Joe Biden was elected as the president.                        including 12K unique YouTube videos. Our dataset also al-
                                            Unfortunately, efforts to deligitimize the election pro-           lows researchers to calculate the amount of Twitter inter-
                                         cess and its results were carried out before, throughout              actions with the collected tweets, users, and media items,
                                         and after the election. Mostly unfounded claims of voter              including number of retweets and quotes from various clus-
                                         fraud (Frenkel 2020) were spread both through public state-           ters, or from suspended users.
                                         ments by politicians, and on social media platforms. As a
                                                                                                                  A preliminary analysis finds a significant cluster of users
                                         result, 34% of Americans say that they do not trust the elec-
                                                                                                               who were promoting the election fraud related claims, with
                                         tion results as of December, 2020 (NPR 2020). Voter fraud
                                                                                                               nearly 7.8% of them suspended in January. The suspensions
                                         claims without credible evidence have great ramifications on
                                                                                                               focused on a specific community within the cluster. A sim-
                                         both the integrity of the election and the stability of the U.S.
                                                                                                               ple analysis of the distribution of images, based on visual
                                         democracy. On January 6th, 2021, believing that the election
                                                                                                               similarity, exposes that the most broadly shared (by num-
                                         was ‘stolen’, mobs breached U.S. capitol while the Congress
                                                                                                               ber of tweets) and the most retweeted images are different.
                                         voted to certify Biden as the winner of the election.
                                                                                                               Although recent research has shown that voter fraud claims
                                            Social media platforms like Facebook, Twitter, YouTube
                                                                                                               are pushed mainly by mass media (Benkler et al. 2020), we
                                         and Reddit play a significant role in political events (Vitak
                                                                                                               also find that external links referenced by promoters of the
                                         Copyright © 2021, Association for the Advancement of Artificial       claims point mostly to low-quality news websites, stream-
                                         Intelligence (www.aaai.org). All rights reserved.                     ing services, and YouTube videos. Some of the widespread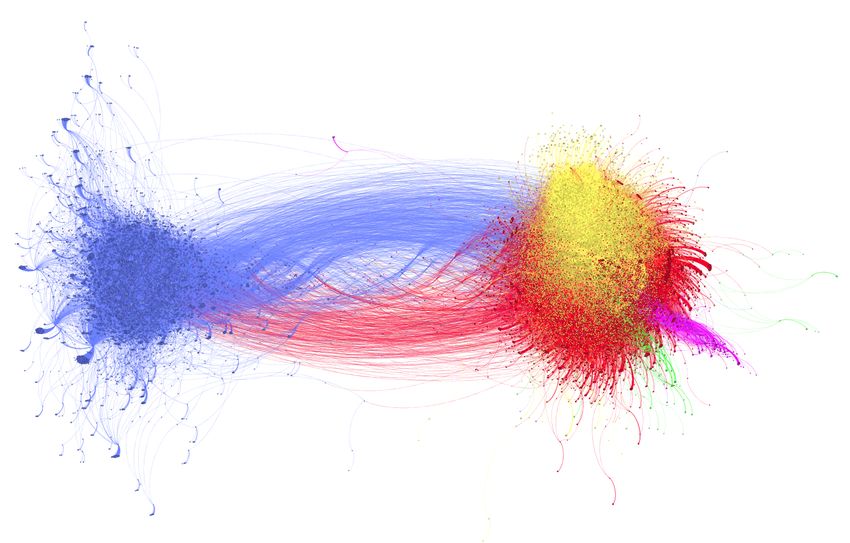
videos claiming ‘evidence’ of voter fraud were published by      In total, we collected 3,781,524 original tweets, 25,566,698
surprisingly small channels. Most strikingly, all of the top     retweets, and 3,821,579 quote tweets (i.e. tweets that in-
ten channels and videos spreading voter fraud claims were        clude a reference to another tweet) discussing election fraud
still available on YouTube as of January 11th, 2021.             claims. Note that quote tweets are included in the Twitter
   We believe that the release of VoterFraud2020, the largest    stream when either the new tweet or the referenced (quoted)
public dataset of Twitter discussions around the voter fraud     tweet include one of the keywords or hashtags on the list. In
claims, with the enhanced labels and data, will help the         total, we collected tweets from 2,559,018 users who posted,
broad research community better understand this important        shared or quoted one or more tweets with these keywords.
topic at a critical time.
                                                                 2.2   Coverage Analysis
                  2    Data Collection                           Since the Twitter streaming API provides only a sample of
Our data collection process involved streaming Twitter data      the tweets, especially for large-volume keywords (Morstat-
using a data-driven manually curated set of keywords and         ter et al. 2013), we performed multiple tests to evaluate and
hashtags. We report on the span and volume of the collected      estimate the coverage of the VoterFraud2020 dataset. This
data, as well as on analyses estimating its coverage.            analysis suggests that the dataset covers over 60% of the
                                                                 content shared on Twitter using the keywords we tracked.
2.1   Streaming Twitter data
We used a data-driven approach to generate a list of key-        Retweet and quote coverage. We evaluated the cover-
words and hashtags related to election fraud claims in an        age of retweet and quote tweets by comparing the counts
iterative manner. We started with a single phrase and two de-    of these objects in the stream to Twitter’s metadata. When
rived keywords: voter fraud and #voterfraud. We                  a new retweet for an original tweet appears in the stream,
first used a convenience sample of 11M political tweets con-     the API returns the tweet’s metadata including the current
sisting of the tweets of 2,262 U.S. political candidates and     retweet count and quote count of the original tweet. In
the replies to those tweets, collected between July 21st and     other words, if an original tweet ti is retweeted, it will ap-
Oct 22nd, 2020 using the Twitter Streaming API (Twitter          pear in the stream as a retweet rtj , and the metadata for
2019). We then identified hashtags that co-occur with our        rtj will include the total number of retweets of ti so far.
meta-seed keywords, voter fraud and voterfraud.                  From this metadata, it is easy to define the retweet cov-
We selected all hashtags that appeared in at least 10 tweets     erage as the ratio of the total number of retweets (rt ob-
and co-occurred with either of the meta-seed keywords at         jects) streamed and stored in our dataset, over the sum of
least 50% of the time. From the resulting set, we man-           all retweet counts of the original t tweets, returned by the
ually filtered out those that were not directly relevant to      API in the latest rt retweet of each original tweet. The quote
voter fraud. To this end, two members of the research team       coverage is defined analogously. According to this analysis,
reviewed the hashtags, including, if needed, searching for       the VoterFraud2020 dataset captured 63.2% of the retweets
them on Twitter to see whether they produce relevant re-         and 62.6% of the quote tweets. These findings compare fa-
sults. Only the hashtags that were agreed on by both evalu-      vorably with previous work that shows a single API client
ators were added, resulting in an initial set of hashtags that   captures only 37.6% of the retweets through the Streaming
was added to the two original keywords.                          API (Morstatter et al. 2013).
   We computed the Jaccard coefficient between each of
our seed hashtags and all other hashtags that appeared in        Comparison with #Election2020. To further evaluate the
the new stream. We added to our set all hashtags that            coverage on the voter fraud tweets, we compared our dataset
had a Jaccard coefficient greater than 0.001 with any of         with a previously published Twitter dataset of the U.S. 2020
the seed hashtags. Three members of the team again re-           election (Chen, Deb, and Ferrara 2020). The creators of the
viewed this list by 1) excluding hashtags that were not re-      #Election2020 dataset used the streaming API to track 168
lated to voter fraud, 2) adding corresponding keywords of        keywords that are broadly related to the election and 57 ac-
the hashtags (e.g. #discardedballots corresponds to              counts that are tied to candidates running for president.
discarded ballots), and 3) adding relevant hashtags                 As in VoterFraud2020, the keyword ‘voter fraud’ was also
or keywords that the researchers observed while searching        used to collect data for #Election2020. We used this over-
for hashtags from the generated list. Both the seed list and     lap to estimate our coverage. First, we can directly compare
the final list of keywords and hashtags we used for streaming    the relative volume and overlap between the ‘voter fraud’
are included in Appendix A (Table 3).                            tweets in both datasets. We expect VoterFraud2020 to have
   We collected data using the Twitter streaming API (Twit-      a higher volume of such tweets because of its more focused
ter 2019). The VoterFraud2020 dataset includes tweets from       set of keywords. Second, if we assume sampling for both
17:00, October 23rd, 2020 to 13:00 December 16th, 2020.          streams is independent and random, we could estimate the
We expanded the keywords list on Oct. 31st with additional       coverage of VoterFraud2020 by looking at the proportion of
keywords, and added #stopthesteal as it started trend-           #Election2020 tweets that also appear in our data.
ing on November 3rd. While streaming, we stored each                To this end, we extracted all tweets and retweets that con-
tweet’s metadata (e.g., user ID, text, timestamp). We also       tain this keyword from both datasets posted on two days
downloaded all image media items included in the tweets.         following the November 3rd election data: November 6th
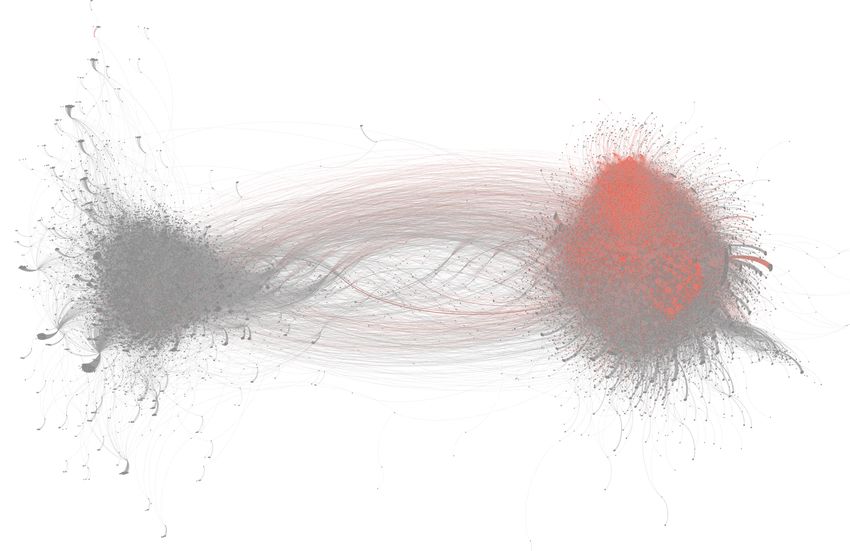
Nov 6th                                                           Retweet Graph Communities. Retweet networks have
                                                                     been frequently analyzed in previous works in order to un-
  Nov 13th                                                           derstand political conversations on Twitter (Arif, Stewart,
             0%       20%   40%     60%        80%     100%          and Starbird 2018; Cherepnalkoski and Mozetič 2016). Us-
     VoterFraud2020         In both datasets         #Election2020   ing community detection algorithms, researchers are able to
Figure 1: Coverage comparison between our dataset and                study key players, sharing patterns and content on different
#Election2020 for tweets containing ‘voter fraud’.                   sides of a discussion surrounding a heated political topic.
                                                                        We first constructed a retweet graph of the Voter-
                                                                     Fraud2020 dataset, where nodes represent users and di-
and November 13th. The analysis, performed on Decem-                 rected edges correspond to retweets between the users. The
ber 17th, was limited to two days as we had to obtain                direction of an edge corresponds to the direction of the infor-
the content of the tweets of the #Election2020 dataset by            mation spreading in the retweet relation. Edges are weighted
“hydrating” them (i.e. using the tweet IDs to get the full           according to the number of times the corresponding source
tweet text using the Twitter API). We were unable to hy-             user has been retweeted. The resulting network consists of
drate the full data, presumably due to inactive accounts and         1,887,736 nodes and 16,718,884 edges.
deleted tweets. The hydration yielded 92.4% of the #Elec-               To detect communities within the graph, we used the In-
tion2020 data on November 6th (a total of 1.4M tweets/3.5M           fomap community detection algorithm (Bohlin et al. 2014),
retweets), and 91.1% of the data on November 13th (1.3M              which captures the flow of information in directed networks.
tweets/3M retweets).                                                 Using the default parameters, the algorithm produces thou-
   In total, our VoterFraud2020 data includes 45,322 ‘voter          sands of clusters. By excluding all clusters that contain fewer
fraud’ related tweets on November 6th, 2.3 times as much             than 1% of the nodes we are left with 90% of all nodes1
as recorded in #Election2020. The ratio is even higher on            which are clustered into five communities (see Figure 2a).
November 13th, when we obtained 47,313 tweets, 3.1 times                In Figure 2b, we visualize the retweet network using the
as much as in #Election2020. Figure 1 breaks down the cov-           Force Atlas 2 layout in Gephi (Bastian, Heymann, and Ja-
erage by dates (separated by rows), in the two datasets (by          comy 2009), using a random sample of 44,474 nodes and
different colors). From left to right, the bars show the per-        456,372 edges. The nodes are colored according to their
centages of tweets that are available only in our dataset (dark      computed community as described in Figure 2a. Edges are
blue), that are available in both datasets (light blue), and that    colored by their source node. The visualization indicates that
are available only in #Election2020 (yellow). On any given           the nodes are split between two distinct clusters - commu-
day, the VoterFraud2020 dataset contains substantially more          nity 0 (blue) on the left and communities 1, 2, 3 and 4 on
tweets related to voter fraud, as compared to #Election2020,         the right. By examining the top users in each community,
especially when the estimated total volume is lower. On              we conclude that community 0 mostly consists of accounts
November 13th (second row), VoterFraud2020 contained                 that detract the voter fraud claims, while the communities
95.7% of the combined data (left two bars) while #Elec-              on the right consist of accounts that promote the voter fraud
tion2020 only collected 30.7% (right two bars) of the tweets.        claims. Most of the tweets from these users are written in
These numbers also indicate that VoterFraud2020’s sample             English, except for users in Community 3 who mainly post
includes 32.1% of the related samples in #Election2020 on            tweets in Japanese and users in Community 4 who write
November 6th and 85.9% on November 13th. We acknowl-                 in Spanish. Community 2 is more deeply embedded in the
edge that these two numbers are not consistent, presumably           promoter cluster compared to Community 1, as we observe
because of November 6th’s much higher volume of activity.            tweets from Community 1 being retweeted by Community 0
If these samples are indeed independent, though, it means            on the left, but not from Community 2. We include the list
that our lower bound of coverage is November 6th’s 32.1%.            of top 5 Twitter accounts in each community by the number
   Based on these coverage analyses, we conclude that Voter-         of community retweets in the Appendix.
Fraud2020 is, at the time of submission, the largest known              For brevity, in the following analyses, we refer to the clus-
public Twitter dataset of voter fraud claims and discussions.        ter on the left as the detractor cluster, and the cluster with
                                                                     community 1,2,3,4 on the right as the promoter cluster. Note
                                                                     that due to the partisan nature of the U.S. politics, most of
                  3    Data Enhancement                              the promoter users are likely aligned with right-leaning pol-
                                                                     itics, and detractor users align with left-leaning politics.
To ensure the reusability of our data, we took the following            To identify users that are prominent within each of these
steps to enhance the dataset. In addition to raw streaming           two cluster, we calculate the closeness centrality of the user
data, we clustered users according to the retweet dynamics           nodes in each cluster. In a retweet network this metric can
and release the cluster labels. We also queried Twitter for          be interpreted as a user’s ability to spread information to
the user status on 10th of January, and share the user sta-          other users in the network (Okamoto, Chen, and Li 2008).
tus as active/not-found/suspended. Furthermore, to enable            We compute the top-k closeness centrality to find the 10,000
research on visual misinformation, we encode all images              most central nodes within the detractor and promoter clus-
shared in the tweets with perceptual hash. Finally, we re-
lease the URLs, and the metadata of the YouTube videos                   1
                                                                           Since the graph only includes retweeting and retweeted users,
that appeared in our dataset.                                        this number corresponds to 73.8% of all users in our dataset.
Community     Users    Relative size   % of users
                                         suspended

   0          860,976          45.6%           1%
   1          437,783          23.2%          4.6%
   2          342,184          18.1%        14.1%
   3           33,857           1.8%          1.5%
   4           23,414           1.2%          1.6%

                        (a)                                      (b)                                           (c)
Figure 2: (a) Community statistics. (b) Retweet graph colored by communities. (c) Suspension status (orange: suspended users).

ters (Bisenius et al. 2017).                                           2016; Paris and Donovan 2019; Moreira et al. 2018; Zan-
   We release the author’s community label of each tweet,              nettou et al. 2020). However, visual information such as im-
the community label of each user, and a user’s closeness               ages or videos is difficult for many researchers to study due
centrality in the detractor and promoter clusters. We also             to computational and storage costs. Here, we make the infor-
include two additional metrics - retweet count by commu-               mation about image content shared in VoterFraud2020 eas-
nity X and quote count by community X. For a tweet ti ,                ier to use by sharing perceptual hash values for these im-
the retweet count by community X is the total number of                ages. With these numeric hash values, researchers can easily
retweets rti it received from each user uX in community X.             find duplicates and near-duplicate images in tweets, without
The metric is computed analogously for quotes.                         working directly with cumbersome image content. To this
                                                                       end, we download all image media items that were posted in
Labeling Suspended and Deleted Users When the elec-                    the tweets in the streaming data, and encode them with three
toral college were set to confirm the election results on Jan-         different types of perceptual hashes.
uary 6th, 2021, the allegations of voter fraud took a dramatic            Common perceptual hashes are binary strings designed
turn, which culminated in the storming of the US Capitol.              such that the Hamming distance (Zauner, Steinebach, and
Subsequently, Twitter took a harder stance on moderating               Hermann 2011) between two hashes is close if and only if
content on their platform and suspended at least 70,000 ac-            the two corresponding images are perceptually similar. In
counts that were engaged in propagating conspiracy theories            other words, an image that is only slightly transformed, for
and sharing QAnon-content (Twitter 2021). This ban has                 example, by re-sizing, cropping, or rotation, will have a sim-
substantial implications for researchers seeking to under-             ilar hash value to the original image. However, as the def-
stand the spread of voter fraud allegations on Twitter, since          inition of perceptual similarity is often subjective and the
the Twitter API does not allow the “hydration” of Tweets               underlying algorithms are often different, various hashing
from suspended users. In order to understand the distribu-             functions have different performance characteristics deal-
tion of suspensions within our dataset, we queried the up-             ing with various types of image transformations. Therefore,
dated user status of all users in our dataset on January 10th,         we encode the images in our dataset with three perceptual
a few days following the ban. The Twitter API returns a user           hash functions: the Perceptive Hash (pHash), the Average
status that indicates if the user is active, suspended or not          Hash (aHash), and the Wavelet Hash (wHash) (Petrov 2017;
found (presumably deleted). In total, 3.9% of the accounts             Zauner, Steinebach, and Hermann 2011).
(99,884 accounts) in our data were suspended.                             In total, our streamed tweets included 201,259 image
   We enhance the VoterFraud2020 dataset by labeling                   URLs, 167,696 of them were retrieved during streaming. We
tweets and users that were suspended. This metadata will en-           provide some more details about the distribution of these im-
able both research and ease hydration by allowing hydraters            ages in Section 5.
to skip content that is no longer available. We also include
two additional metrics for each tweet: retweet count by sus-           External links. Misinformation campaigns are known to
pended users and quote count by suspended users.                       use broad cross-platform information, often via links to
   Due to its immense public interest, we have retained the            other sites (Wilson and Starbird 2020; Golovchenko et al.
full data we retrieved from the 99,884 suspended users in-             2020). Hence, we extracted and publish the set of external
cluding 1,240,405 tweets and 6,246,245 retweets. This de-              (non-Twitter) URLs that were referenced in the tweets. For
tailed data is not part of VoterFraud2020. However, we will            ease of use, we resolved URLs that point to a redirected lo-
distribute an anonymized version of this data to published             cation (e.g. bit.ly URLs) to their final destination URL. Our
academic researchers upon request.                                     streamed tweets included references to a total of 138,411
                                                                       unique URLs, appearing in 609,513 tweets.
Images. Because of their persuasive power and ease of                     Since a large portion (over 12%) of all URLs in the data
spread, there is a growing interest in analyzing how visual            were YouTube links, we further enhanced the data with
misinformation spreads both within a platform or across                YouTube-specific metadata. A key motivation for this spe-
platforms (Zannettou et al. 2018; Highfield and Leaver                 cific focus was the known role YouTube plays generally
in spreading misinformation (Hussein, Juneja, and Mitra                       a       b                          c
2020; Papadamou et al. 2020) and specifically its role in the        600K
2020 election and voter fraud claims (Kaplan 2020; Wak-
abayashi 2020). For each YouTube video that was shared in            400K
the collected tweets, we used YouTube’s Data API (YouTube            200K
2021), to retrieve the video’s title, description, as well as the       0
id and title of the channel that posted it. We retrieved the                10/26    11/03       11/11   11/19       11/27   12/05     12/13
                                                                                    (Election)
YouTube metadata on Jan 1st, 2021. On that data, out of the                               Retweets         Tweets             Quotes
13,611 unique video ids that we have queried, 1,608 were
no longer available resulting in 12,003 YouTube URLs with           Figure 3: Temporal overview of the dataset showing number
full additional metadata.                                           of streamed tweets, quotes and retweets per day. The shaded
                                                                    regions mark the expansions of the keyword set.
            4    Data Sharing and Format
Our VoterFraud2020 dataset is available for download un-            suspended users in Community 2. As the tweet itself and the
der FAIR principles (Wilkinson et al. 2016) in CSV format2 .        ID of the user who tweeted it is not available until hydration,
The data includes “item data” tables for tweets, retweets, and      Twitter’s users’ privacy is preserved.
users keyed by Twitter assigned IDs and augmented with ad-             The Users table is similarly augmented with aggre-
ditional metadata as described below. The data also includes        gate information about the importance of the user in the
the images that appear in the dataset, indexed by randomly          dataset, including the community that they belong to, their
genenerated unique IDs. Finally, the data includes aggre-           centrality in the two meta-clusters, detractor and pro-
gated tables for URLs and for YouTube videos including the          moter (closeness centrality detractor cluster
information described in Section 3. The dataset tables and          and closeness centrality promoter cluster), and
the fields they contain are summarized on Github3 .                 the amount of attention (retweets and quotes) they received
   The VoterFraud2020 dataset conforms with FAIR prin-              from other users in the different communities. We also note
ciples. The dataset is Findable as it is publicly avail-            whether, according to the data we collected, the user had
able on Figshare, with a digital object identifier (DOI):           been suspended. With this data, interested researchers can
10.6084/m9.figshare.13571084. It is also Accessible since it        quickly focus their attention and research on the main actors
can be accessed by anyone in the world through the link.            in each community.
The datset is in csv format, hence it is Interoperable. We             The Images table includes all the image media items re-
release the full dataset with descriptions detailed in this         trieved in the stream, their unique media ID, and the ID of
paper, as well as an online tool to explore the dataset at          the tweet in which the image was shared. We augment this
http://voterfraud2020.io, making the dataset Reusable to the        table with the image hash using three types of perceptual
research community.                                                 hash functions – aHash, pHash and wHash, as detailed in
   The tables for Tweets and Retweets contain the full set          Section 3. This augmentation, together with the link to the
of items that were collected, including from suspended              Tweet ID, will allow researchers to quickly identify and hy-
users. These tables do not include raw tweet data be-               drate popular images using the tweet metadata. They can
yond the ID, according to Twitter’s ToS. However, to                also quickly identify and get information for images that are
support use of the data without being required to down-             similar to any other arbitrary image, by computing and com-
load (“hydrate”) the full set of tweets, we augment the             parting the perceptual hash values.
Tweets table with several key properties. For each tweet               The two aggregate tables, the URLs table and the
we provide the number of total retweets as computed by              YouTube Videos table again provide information about the
Twitter (retweet/quote count metadata), as well                     popularity of the object in the dataset: aggregate retweet and
as the number of retweets and quotes we streamed for                quote counts, both using the Twitter metadata and the count
this tweet from users in each of the five main communi-             of objects in our stream from the various communities. In
ties (retweet/quote count community X, X rang-                      addition, these tables are augmented with metadata about the
ing from 0 to 4). Note that the latter do not add up to             item (URL or YouTube video) as noted in Section 3.
the Twitter metadata due to the coverage issues listed in
Section 2.2. The Tweet table properties also include the                                    5     Data Analysis
user community (0–4) for the user who posted the tweet,             We performed a preliminary analysis of our dataset and its
computed using methods listed in Section 3. Some of the             different modalities – tweets and users, images, external
Twitter accounts were not clustered into one of the five            links – to demonstrate its potential interest and provide some
main communities. In this case, the user community la-              initial guiding insights about the data.
bel is null. With this augmentation, researchers using this
dataset could very quickly, for example, select and then
hydrate a subset of the most retweeted tweets from non-             Tweets and users. Figure 3 shows the amount of
                                                                    retweets (green), original tweets (blue) and quote
   2                                                                tweets (yellow) in the VoterFraud2020 dataset over
     https://figshare.com/account/projects/96518/articles/
13571084                                                            the time (X-axis) of the data collection. Three shaded
   3
     https://github.com/sTechLab/VoterFraud2020                     regions, from left to right, mark the expansion of our set
(a)                                                 (b)                                                  (c)

    Tweets   Retweets (total)    Retweets (in cluster)   Tweets   Retweets (total)    Retweets (in cluster)   Tweets   Retweets (total)   Retweets (in cluster)
      15         24,399                 18,020            11          20,104                 10,424            34          28,833                10,250

Figure 4: Top three most retweeted images in the promoter cluster: (a)–(c), with the number of tweets, retweets as in metadata,
and retweets by users in the cluster. Image (c) was cropped to fit the figure.

of keywords on October 31st (light blue, region b) and                               Images. We conducted a preliminary examination of
November 3rd (light green, region c). The Y-axis specifies                           matching and repeated images in VoterFraud2020 to ana-
the daily count. In general, except for the large increase                           lyze the distribution of images related to voter fraud claims.
after the election date (November 3rd, dotted vertical line),                        Our data, using the perceptual hash functions described in
the volume of the stream remains roughly the same. On                                Section 3, allows tracking of duplicate and near-duplicate
average, there are 170,938 tweets, 576,136 retweets, and                             images that were posted in multiple tweets. In this analysis,
85,488 quote tweets per day after the election.                                      we experimented with three perceptual hash functions and
   Our manual inspection shows that top tweets retweeted                             refer to two images as matching if they have an identical
by the detractor cluster often condemn the alleged voter                             perceptual hash value.
fraud claims, while top tweets on the promoter cluster in-                              In Figure 5a, we show the cumulative distribution of the
deed make voter fraud claims. Not surprisingly, among the                            number of unique perceptual hashes in VoterFraud2020 (Y-
top ten most retweeted tweets in the promoter cluster, nine                          axis), with hash values sorted based on the number of unique
were tweeted by President Trump. We refer readers to our                             tweets in which they appear, from the highest to the lowest
project website for more details about popular tweets.                               (X-axis). For example, according to pHash, the 1,000 im-
   While the promoter clusters seems rather homogeneous                              ages shared in the largest number of unique tweets appeared
(Figure 2b), users in Community 2 (yellow) stand out in both                         together in 25,019 different tweets (not including retweets).
their level of activity and the rate in which they were sus-                         Although in general the results are similar when using dif-
pended. Community 2 was highly active in our dataset. For                            ferent hash functions, pHash is the most “conservative” in
example, Community 2 comprises 18.1% of the users, but                               terms of assigning matches.
contributed 68% of the VoterFraud2020 tweets, and 74% of                                Overall, our results are similar when using different hash
the retweets. Moreover, 14% of Community 2’s users were                              functions. For example, there are 109,312 (out of 167,696)
suspended by Twitter by the time we collected the account                            images with the same pHash value. Of these, 17,831 were
status data as described above, a much higher rate than the                          shared in more than one tweet, an average of 4.27 times.
other communities, as shown in Figure 2a. In total, Commu-                           In other words, 34% of the images instances in Voter-
nity 2 was responsible for 46.1% of all suspensions amongst                          Fraud2020 tweets appear in more than one tweet. Figure 5b
the users we associated with the top five communities. The                           presents the image that appeared in most number of unique
suspension effect, and its focus on Community 2, can also                            tweets: the same perceptual hash value appeared in over
be observed in Figure 2c.                                                            1,000 tweets, according to all three hash functions.
   A full analysis of the suspended accounts and their net-                             We further investigate the popularity of images, de-
work communities, and the potential impact of the suspen-                            fined by number of retweets, in particular, within the pro-
sion is out of scope for this dataset paper, but can be easily                       moter and detractor clusters. After grouping images by the
performed using the data we share in VoterFraud2020. For                             same pHash value, we present in Figure 4 the top three im-
example, the data shows that 35% of the promoter cluster                             ages that have been retweeted in the promoter cluster. Also
users that were retweeted more than 1,000 times (1,596 in                            note that despite the high values of metadata retweets and
total) were suspended.                                                               cluster retweets, all these “popular” images appeared in only
   To conclude, our preliminary analysis shows that alleged                          a few original tweets in our data. For example, image (a) ap-
election fraud claims mostly circulate in the promoter clus-                         peared in 15 tweets, whose metadata retweet (as returned
ter, and in particular in Community 2 within the cluster. The                        from the API) counts add up to 24,399 in total, and was
most popular tweets (by retweet counts) supporting such                              retweeted (as recorded in our dataset) from users in the pro-
claims often come from prominent accounts. The recent                                moter cluster 18,020 times. We note that images (a) and (b)
moderation efforts from Twitter seem to have effected the                            were also the top two images retweeted by users in the sus-
most active community that engaged in fraud related misin-                           pended users set, with 5,547 and 3,122 retweets in that set,
formation, and did not broadly target all accounts involved                          respectively (recall that as almost all suspended users belong
in promoting such claims.                                                            to the promoter cluster). As expected, the most retweeted
.
&XPXODWLYHRIPDWFKHV
.
7RWDOQXPEHURILPDJHV
claims (Frenkel 2020). The majority of the top 10 most
. retweeted videos by the promoter users falsely claim ev-
. idence of widespread election fraud. The users spreading
. these videos had significant overlap with the January (or ear-
. D+DVK
. Z+DVK lier) suspension action by Twitter. For eight of these videos,
S+DVK around 30% of the retweets of tweets sharing those videos
. . . . .
5DQNRILPDJH
LHXQLTXHKDVKwere by accounts later suspended by Twitter.
A scan of the top 10 YouTube channels retweeted in the
(a) (b) promoter cluster shows that they were relatively large (mil-
Figure 5: (a) The cumulative number of repeated images by lions of subscribers), though there are also several smaller
hash matches. (b) The most tweeted image. channels. For example, the most retweeted channel, Precinct
13, has only 3.67K subscribers, has a video that appeared in
88 tweets and have been retweeted over 9K times.
promoter cluster detractor cluster
Domain Retweets Domain Retweets
Despite YouTube’s announcement that it will take actions
against content creators who falsely claim the existence of
pscp.tv 51,822 washingtonpost.com 11,220 widespread voter fraud4 , as of Jan 11th, the top 10 channels
youtube.com 44,031 rawstory.com 9,267 and videos listed in our tables are still available on YouTube.
thegatewaypundit.com 35,967 cnn.com 4,139
davidharrisjr.com 18,793 independent.co.uk 3,882
foxnews.com 17,332 nytimes.com 3,746 6 Related Work and Datasets
theepochtimes.com 15,297 newsweek.com 3,496 We review prior work using Twitter data analysing politi-
thedcpatriot.com 14,958 news.yahoo.com 2,899 cally related events, with an emphasis on those that have re-
thefederalist.com 13,288 deadstate.org 2,409 leased a public dataset.
djhjmedia.com 11,816 theguardian.com 2,232
In particular, previous works had used and published
justthenews.com 11,149 politicususa.com 2,032
Twitter data to study U.S. elections. Using tweets col-
Table 1: Top 10 domains being retweeted in the pro- lected during the 2016 U.S. election, researchers have anal-
moter and the detractor clusters respectively, as well as the ysed information operations run by social bots (Rizoiu
number of retweets by users in these clusters. et al. 2018), characterized the dissemination of misinfor-
mation (Vosoughi, Roy, and Aral 2018) and its exposure to
American voters (Grinberg et al. 2019). Work in Hua, Naa-
images in the two clusters are quite different. The three most man, and Ristenpart (2020); Hua, Ristenpart, and Naaman
retweeted images in the detractor cluster (not included for (2020) characterized adversarial interaction against political
lack of space) have somewhat lower spread, appearing in candidates during the 2018 U.S. general election and shared
tweets that were retweeted 10743, 6425, 3411 times (based 1.7M tweets interacting with political candidates.
on metadata). The top image is a screenshot of the NY Times Focusing on the U.S. 2020 election, research studied false
front page of Nov 11th, 2020 reporting that top election of- claims regarding mail-in ballots (Benkler et al. 2020) be-
ficials across the country have not identified any fraud. fore the election as the COVID-19 pandemic made it hard
The analysis presented above can be easily extended to vote in person. Closest to our work is the #Election2020
with less-strict image similarity matching by calculating the dataset (Chen, Deb, and Ferrara 2020), which streamed a
Hamming distance between a pair of perceptual hash values. broad set of Twitter data for both political candidates’ tweets
In this initial analysis, we used a strict sense of similarity, and related keywords. As discussed above, although some
treating images as similar only when they share the same of the voter fraud related keywords were included in their
perceptual hash values. data collection process, our VoterFraud2020 dataset con-
tains more than 2.3 times as much of the related data in
#Election2020, for overlapping streaming keywords, pre-
URLs. We conduct preliminary analyses of the external sumably because of our more focused stream. Our stream
links that have been included in the VoterFraud2020 tweets. also included a broader set of fraud-claim related keywords.
Table 1 lists the top 10 domains that have been shared in- In order to help understand the dissemination of misinfor-
side the detractor and promoter clusters respectively. Most mation cross platforms, Brena et al. (2019); Hui et al. (2018)
of the links shared by users in the detractor clusters are to used news articles as queries and released the tweets point-
mainstream news media, such as the Washington Post, CNN, ing to these articles. In 2018, Twitter published a list of ac-
and the New York Times. The rest are other news-related counts that the platform suspects to be related with Russia’s
websites. The links shared by users in the promoter cluster government controlled Internet Research Agency (Twitter
mostly point to low-quality news-related websites. 2018). This release enabled a number of studies that deep-
The most shared domain in the promoter cluster is pscp.tv, ened our understanding of foreign information manipulation
a live video streaming app that’s owned by Twitter. YouTube in the U.S. (Arif, Stewart, and Starbird 2018; Im et al. 2020;
stands out as the second most retweeted domain among Badawy, Ferrara, and Lerman 2018).
the promoter users. This trend is reflected in multiple
news reports, warning of the significant role that YouTube 4
see: https://twitter.com/YouTubeInsider/status/
plays in spreading false information related to voter fraud 1347231471212371970Most of the previous works that released Twitter datasets visual misinformation spread cross platforms (e.g., (Zannet-
only included the tweet IDs, in accordance with Twitter’s tou et al. 2018; Moreira et al. 2018)).
Terms of Service. We keep to that practice, and augment the A third potential area of investigation is Twitter’s response
data without sharing tweet content, as detailed above, mak- to the voter fraud claims. A specific question is the char-
ing our multi-modal dataset more accessible and useful to acterization of the suspended users, who are primarily part
the research community. of a specific community even within the the group promot-
ing voter fraud claims as shown above. Researchers can use
7 Discussion and Conclusions the data to both understand Twitter’s non-public response,
The voter fraud allegations to discredit the U.S. 2020 pres- and its potential effectiveness, or even simulate the effec-
idential elections are likely to form one of the most con- tiveness of hypothetical earlier bans of the same population.
sequential misinformation campaigns in modern history. It As noted above, while Twitter’s terms forbid us from pub-
is critical to allow a diverse set of researchers to provide a licly sharing full data for these suspended users – the Voter-
deeper understanding of this effort, which will continue to Fraud2020 tweets for these users are no longer available on
have national and global impact for years to come. To en- Twitter by their ID – we will make these tweets available
able that contribution, it is important to provide a public and privately to published academic researchers, as we believe
accessible archive of this campaign on various social media these tweets are of immense and justified public interest.
platforms, including Twitter as we do in VoterFraud2020. The publicly released VoterFraud2020 data was collected
The VoterFraud2020 dataset has the potential to benefit and made available according to Twitter’s Terms of Service
the research community, and to further inform the public re- for academic researchers, following established guidelines
garding both Twitter activities around the voter fraud claims, for ethical Twitter data use (Rivers and Lewis 2014). By lim-
as well as Twitter’s response. Yet, the data has some lim- iting to the Tweet IDs as the main data element, the dataset
itations. We could not possibly capture the full extent of does not expose information about users whose data had
the voter fraud claims on Twitter, as our dataset was con- been removed from the service. The only content in our data
structed by using matching keywords. Further, as discussed that is directly tied to a Tweet ID is the hash of the images
above, we do not have full coverage even for the keywords for tweets that included them. Even though that hash, theo-
we tracked, though we estimate that we have a majority of retically, can be tied to an image from another source, in ab-
the tweets with those keywords. Nevertheless, the breadth of sence of the original tweet the image will not be associated
the data enables various types of investigation using both the with any user account. We believe that this minor disclosure
tweet data, as well as the aggregated data of URLs, videos risk is justified given the potential benefits of this data.
and images used in the campaign. We propose three major
categories of such investigation. References
First, researchers can use the dataset to study the spread, Allcott, H.; and Gentzkow, M. 2017. Social media and fake news in
reach, and dynamics of the voter fraud campaign on Twitter. the 2016 election. Journal of economic perspectives 31(2): 211–36.
Researchers can describe and analyze the participants, in- Arif, A.; Stewart, L. G.; and Starbird, K. 2018. Acting the part:
cluding the activities of political candidates using informa- Examining information operations within# BlackLivesMatter dis-
tion from orthogonal data sets of candidate accounts 5 , and course. Proceedings of the ACM on Human-Computer Interaction
the interaction between public figures and other accounts 2(CSCW): 1–27.
spreading claims and promoting certain narratives. Further, Badawy, A.; Ferrara, E.; and Lerman, K. 2018. Analyzing the dig-
the data can help expose how different public figures spread ital traces of political manipulation: The 2016 russian interference
different claims, for example the claims regarding the Do- twitter campaign. In 2018 IEEE/ACM International Conference
minion voting machines, what kind of engagement such nar- on Advances in Social Networks Analysis and Mining (ASONAM),
258–265. IEEE.
ratives received. The data can also be used to understand
the role of bots and other coordinated activities and cam- Bastian, M.; Heymann, S.; and Jacomy, M. 2009. Gephi: an open
paigns in spreading this information. In general, the dataset source software for exploring and manipulating networks. In Pro-
can provide for analysis of the distribution of attention to ceedings of the International AAAI Conference on Web and Social
Media, volume 3.
these claims and how it spreads – via images, tweets, URLs
– including comparison among different pre-computed com- Benkler, Y.; Tilton, C.; Etling, B.; Roberts, H.; Clark, J.; Faris, R.;
munities and clusters. Kaiser, J.; and Schmitt, C. 2020. Mail-In Voter Fraud: Anatomy of
Second, we include auxiliary data – URLs including a Disinformation Campaign. Available at SSRN .
YouTube links, and image hashes – that can help researchers Bisenius, P.; Bergamini, E.; Angriman, E.; Meyerhenke, H.; and
examine other sources of information and their roles in Oct, D. S. 2017. Computing Top- k Closeness Centrality in Fully-
spreading these claims. For example, using the image hash dynamic Graphs 1–26.
values that were encoded using publicly available algo- Bohlin, L.; Edler, D.; Lancichinetti, A.; and Rosvall, M. 2014.
rithms, researchers can easily map images not just within Community Detection and Visualization of Networks with the Map
the Twitter data, but also within the larger web ecosystem. Equation Framework, 3–34. Cham: Springer International Publish-
Researchers may combine our dataset with datasets that are ing. ISBN 978-3-319-10377-8. doi:10.1007/978-3-319-10377-
collected from other social media platforms to examine how 8 1.
Brena, G.; Brambilla, M.; Ceri, S.; Di Giovanni, M.; Pierri, F.; and
5
https://github.com/vegetable68/Midterm-2020-candidates Ramponi, G. 2019. News sharing user behaviour on twitter: A com-prehensive data collection of news articles and social interactions. Morstatter, F.; Pfeffer, J.; Liu, H.; and Carley, K. M. 2013. Is
In Proceedings of the International AAAI Conference on Web and the sample good enough? Comparing data from twitter’s streaming
Social Media, volume 13, 592–597. API with Twitter’s firehose. Proceedings of the 7th International
Conference on Weblogs and Social Media, ICWSM 2013 400–408.
Chen, E.; Deb, A.; and Ferrara, E. 2020. # Election2020: The first
public Twitter dataset on the 2020 US presidential election. arXiv NPR. 2020. Poll: Just A Quarter Of Republicans Accept Elec-
preprint arXiv:2010.00600 . tion Outcome. https://www.npr.org/2020/12/09/944385798/poll-
just-a-quarter-of-republicans-accept-election-outcome. [Online;
Cherepnalkoski, D.; and Mozetič, I. 2016. Retweet networks of
accessed 5-Jan-2021].
the European Parliament: evaluation of the community structure.
Applied Network Science 1(1): 1–20. ISSN 23648228. doi:10. Okamoto, K.; Chen, W.; and Li, X.-y. 2008. Ranking of Closeness
1007/s41109-016-0001-4. URL http://dx.doi.org/10.1007/s41109- Centrality for Large-Scale Social Networks Ranking of Closeness
016-0001-4. Centrality for Large-Scale Social Networks (June). doi:10.1007/
Ferrara, E.; Chang, H.; Chen, E.; Muric, G.; and Patel, J. 2020. 978-3-540-69311-6.
Characterizing social media manipulation in the 2020 US presi- Papadamou, K.; Zannettou, S.; Blackburn, J.; De Cristofaro, E.;
dential election. First Monday . Stringhini, G.; and Sirivianos, M. 2020. ” It is just a flu”: Assessing
Frenkel, S. 2020. How Misinformation ‘Superspreaders’ Seed the Effect of Watch History on YouTube’s Pseudoscientific Video
False Election Theories. https://www.nytimes.com/2020/11/23/ Recommendations. arXiv preprint arXiv:2010.11638 .
technology/election-misinformation-facebook-twitter.html. [On- Paris, B.; and Donovan, J. 2019. Deepfakes and Cheap Fakes.
line; accessed 4-Jan-2021]. United States of America: Data & Society .
Golovchenko, Y.; Buntain, C.; Eady, G.; Brown, M. A.; and Tucker, Petrov, D. 2017. Wavelet image hash in Python. https://fullstackml.
J. A. 2020. Cross-Platform State Propaganda: Russian Trolls on com/wavelet-image-hash-in-python-3504fdd282b5. [Online; ac-
Twitter and YouTube During the 2016 US Presidential Election. cessed 15-Jan-2021].
The International Journal of Press/Politics 1940161220912682.
Rivers, C. M.; and Lewis, B. L. 2014. Ethical research standards in
Grinberg, N.; Joseph, K.; Friedland, L.; Swire-Thompson, B.; and a world of big data. F1000Research 3.
Lazer, D. 2019. Fake news on Twitter during the 2016 US presi-
dential election. Science 363(6425): 374–378. Rizoiu, M.-A.; Graham, T.; Zhang, R.; Zhang, Y.; Ackland, R.; and
Xie, L. 2018. # debatenight: The role and influence of socialbots on
Highfield, T.; and Leaver, T. 2016. Instagrammatics and digital twitter during the 1st 2016 us presidential debate. In Proceedings
methods: Studying visual social media, from selfies and GIFs to of the International AAAI Conference on Web and Social Media,
memes and emoji. Communication Research and Practice 2(1): volume 12.
47–62.
Schaul, K.; Rabinowitz, K.; and Mellnik, T. 2020. 2020 turnout is
Hua, Y.; Naaman, M.; and Ristenpart, T. 2020. Characterizing twit- the highest in over a century. https://www.washingtonpost.com/
ter users who engage in adversarial interactions against political graphics/2020/elections/voter-turnout/. [Online; accessed 5-Jan-
candidates. In Proceedings of the 2020 CHI Conference on Human 2021].
Factors in Computing Systems, 1–13.
Twitter. 2018. Update on Twitter’s review of the 2016 US elec-
Hua, Y.; Ristenpart, T.; and Naaman, M. 2020. Towards Measur- tion. https://blog.twitter.com/official/en us/topics/company/2018/
ing Adversarial Twitter Interactions against Candidates in the US 2016-election-update.html. [Online; accessed 7-Jan-2021].
Midterm Elections. In Proceedings of the International AAAI Con-
ference on Web and Social Media, volume 14, 272–282. Twitter. 2019. Twitter Standard API. https://developer.twitter.com/
en/docs/tweets/filter-realtime/overview. [Online; accessed 15-Jan-
Hui, P.-M.; Shao, C.; Flammini, A.; Menczer, F.; and Ciampaglia, 2019].
G. L. 2018. The Hoaxy misinformation and fact-checking diffusion
network. In Proceedings of the International AAAI Conference on Twitter. 2021. An update, following the riots in Washington, DC.
Web and Social Media, volume 12. https://blog.twitter.com/en us/topics/company/2021/protecting--
the-conversation-following-the-riots-in-washington--.html.
Hussein, E.; Juneja, P.; and Mitra, T. 2020. Measuring Misinforma- [Online; accessed 12-Jan-2021].
tion in Video Search Platforms: An Audit Study on YouTube. Pro-
ceedings of the ACM on Human-Computer Interaction 4(CSCW1): Vitak, J.; Zube, P.; Smock, A.; Carr, C. T.; Ellison, N.; and Lampe,
1–27. C. 2011. It’s complicated: Facebook users’ political participation
in the 2008 election. CyberPsychology, behavior, and social net-
Im, J.; Chandrasekharan, E.; Sargent, J.; Lighthammer, P.; Denby, working 14(3): 107–114.
T.; Bhargava, A.; Hemphill, L.; Jurgens, D.; and Gilbert, E. 2020.
Still out there: Modeling and identifying russian troll accounts on Vosoughi, S.; Roy, D.; and Aral, S. 2018. The spread of true and
twitter. In 12th ACM Conference on Web Science, 1–10. false news online. Science 359(6380): 1146–1151.
Kaplan, A. 2020. YouTube has allowed conspiracy theo- Wakabayashi, D. 2020. Election misinformation continues staying
ries about interference with voting machines to go viral. up on YouTube. https://www.nytimes.com/2020/11/10/technology/
https://www.mediamatters.org/google/youtube-has-allowed- election-misinformation-continues-staying-up-on-youtube.html.
conspiracy-theories-about-interference-voting-machines-go-viral. [Online; accessed 5-Jan-2021].
[Online; accessed 5-Jan-2021].
Wilkinson, M. D.; Dumontier, M.; Aalbersberg, I. J.; Appleton, G.;
Moreira, D.; Bharati, A.; Brogan, J.; Pinto, A.; Parowski, M.; Axton, M.; Baak, A.; Blomberg, N.; Boiten, J.-W.; da Silva Santos,
Bowyer, K. W.; Flynn, P. J.; Rocha, A.; and Scheirer, W. J. 2018. L. B.; Bourne, P. E.; et al. 2016. The FAIR Guiding Principles for
Image provenance analysis at scale. IEEE Transactions on Image scientific data management and stewardship. Scientific data 3(1):
Processing 27(12): 6109–6123. 1–9.Community 0
ID Handle Active Status Retweets
32871086 kylegriffin1 active 76,302
1640929196 mmpadellan active 74,393
255812611 donwinslow active 69,796
216776631 BernieSanders active 60,961
15952856 AriBerman active 58,222
a) Community 1
25073877 realDonaldTrump suspended 1,560,373
187680645 LLinWood suspended 1,057,805
586707638 SidneyPowell1 suspended 633,273
240454812 GenFlynn suspended 334,197 Seed list #abolishdemocratparty #ballotharvasting
1812055789 CodeMonkeyZ suspended 274,210 #ballotvoterfraud #cheatingdemocrats
#democratvoterfraud #gopvoterfraud
#ilhanballotharvesting
b) Community 2
#ilhanomarballotharvesting #ilhanomarvoterfraud
#mailinvoterfraud #stopvoterfraud #voterfraud
2922345639 DonnaWR8 suspended 38,388 #voterfraudbymail #voterfraudisreal
259260816 zeusFanHouse suspended 36,347
Filtered #abolishdemocratparty
393190233 LeahR77 suspended 33,352
Generated #ballotharvesting #voterid #ilhanomarforprison
951302891708583936 TheRISEofROD suspended 32,992 #stopgopvoterfraud #ilhanomar
from the
32804484 Bubblebathgirl active 27,787 #nancypelosiabusingpower #nancypelosimustresign
seed list #junkmailballots #traresforcongress
c) Commmunity 3 #immigrationfraud #votebymailfraud
#ballotfraud #exposed #votersuppression
835040085573689346 ganaha masako active 12,480 #ilhanresign #voteinperson #votebymail
1128981340848656384 KadotaRyusho active 6,890 #video #lockherup #nomailinvoting
#ilhanomarelectionfraud #taxfraud
796450109986902016 yamatogokorous active 5,716 #ballotharvesting #massivemailinballots
1166577240601239552 mei98862477 active 5,347 #arrestilhanomar #obamagate #ilhanomarlockherup
109458204 kohyu1952 active 5,244 #buyingvotes #2020election #campaignfraud
#homewrecker #voteinperson #minneapolis
#absenteeballots #trump2020 #arrestilhanomar
d) Community 4 #absenteeballot #darktolight #wwg1wga
3393186119 FernandoAmandi active 4,217 #terrorist #daveygravyspirualsavage #trump
1126414392080232449 POTUS Trump ESP active 2,981 #fraud #liar #pizzagate #republicans
#qproof #theawakening #voteatthepolls
1195348350620622850 TDN NOTICIAS active 2,459 #marriedherbrother #glasshouses #sheepnomore
98294131 1VAFI active 1,802 #voteyouout #cheater #georgesoros #georgia
#vote #walkaway #thegreatawakening #qanon #evil
1068238181282267137 Gamusina77 active 1,638 #savethechildren
Keywords #ballotfraud #ballotharvesting
Table 2: Top 5 Users in each community sorted by retweets list 10/24 #ballotvoterfraud #cheatingdemocrats
#democratvoterfraud #ilhanomarballotharvesting
from other users. #ilhanomarvoterfraud #mailinvoterfraud
#nomailinvoting #stopgopvoterfraud
#stopvoterfraud #votebymailfraud #voterfraud
#voterfraudisreal
Wilson, T.; and Starbird, K. 2020. Cross-platform disinforma- Added on #discardedballots #electionfraud
10/31 #electioninterference #electiontampering
tion campaigns: lessons learned and next steps. Harvard Kennedy #gopvoterfraud #hackedvotingmachines ‘destroyed
School Misinformation Review 1(1). ballots’ ‘discarded ballots’ ‘election fraud’
‘election interference’ ‘election tampering’
YouTube. 2021. YouTube Data API — Google Developers. ‘hacked voting machine’ ‘pre-filled ballot’
https://developers.google.com/youtube/v3. [Online; accessed 8- ‘stolen ballots’ ‘ballot fraud’ ‘ballot
harvesting’ ‘cheating democrats’ ‘democrats
Jan-2021]. cheat’ ‘harvest ballot’ ‘vote by mail fraud’
‘voter fraud’
Zannettou, S.; Caulfield, T.; Blackburn, J.; De Cristofaro, E.; Siri-
vianos, M.; Stringhini, G.; and Suarez-Tangil, G. 2018. On the Added on #stopthesteal
origins of memes by means of fringe web communities. In Pro- 11/03
ceedings of the Internet Measurement Conference 2018, 188–202.
Table 3: Hashtags and keywords related to election fraud.
Zannettou, S.; Caulfield, T.; Bradlyn, B.; De Cristofaro, E.;
Stringhini, G.; and Blackburn, J. 2020. Characterizing the Use
of Images in State-Sponsored Information Warfare Operations by
Russian Trolls on Twitter. In Proceedings of the International AAAI
Conference on Web and Social Media, volume 14, 774–785.
Zauner, C.; Steinebach, M.; and Hermann, E. 2011. Rihamark: per-
ceptual image hash benchmarking. In Media watermarking, secu-
rity, and forensics III, volume 7880, 78800X. International Society
for Optics and Photonics.
A AppendixYou can also read