STUDENT SURVEY.IE The Irish Survey of Student Engagement (ISSE) - Results from 2018
←
→
Page content transcription
If your browser does not render page correctly, please read the page content below
STUDENT
SURVEY.IE

  The Irish Survey
  of Student
  Engagement (ISSE)
  Results from 2018
ACKNOWLEDGEMENTS
                             Once again, project co-sponsors wish to
                           record their continuing appreciation for the
                         support of the national collaborative partnership.
                        The ongoing commitment of students’ union officers
                       and institutions’ staff to support and promote the
                       survey, and of students who participate, means that
                       response rates continue to increase. Project working
                        groups continue to provide strategic direction and
                          appropriate action. The significant activity signalled
                            by the national report takes place only because
                              of the contribution of all partners.

www.studentsurvey.ie

ISSE 2018/01

November 2018
CONTENTS

                     INTRODUCTION AND OVERVIEW                                                 3

Chapter 1            Context for the Irish Survey of Student Engagement (ISSE)                 5
                     1.1 What is student engagement?                                           5
                     1.2 Using ISSE to support enhancement                                     7
                     1.3 Structure of the survey                                               7

Chapter 2            Results and findings of the 2018 ISSE                                    11
                     2.1 Introduction                                                         11
                     2.2 Response rates and demographics                                      11
                     2.3 Responses to individual questions                                    14
		                       2.3.1    Questions relating to Higher Order Learning                 14
		                       2.3.2    Questions relating to Reflective and Integrative Learning   15
		                       2.3.3    Questions relating to Quantitative Reasoning                16
		                       2.3.4    Questions relating to Learning Strategies                   17
		                       2.3.5    Questions relating to Collaborative Learning                18
		                       2.3.6    Questions relating to Student-Faculty Interaction           19
		                       2.3.7    Questions relating to Effective Teaching Practices          20
		                       2.3.8    Questions relating to Quality of Interactions               21
		                       2.3.9    Questions relating to Supportive Environment                22
		                       2.3.10   Questions not relating to indicators                        24

Chapter 3            Engagement indicators at national level                                  27
                     3.1 Introduction                                                         27
                     3.2 Year/cohort                                                          28
                     3.3 Institution-Type                                                     29
                     3.4 Mode of Study                                                        30
                     3.5 Programme Type                                                       31
                     3.6 Field of Study                                                       32
                     3.7 Student characteristics                                              34
		                       3.7.1 Gender                                                         35
		                       3.7.2 Age group                                                      36
		                       3.7.3 Country of domicile                                            37

RESULTS FROM 2 018                                                                                 1
Chapter 4    National results in a wider context                                                       38
             4.1 Introduction                                                                          38
             4.2 National results from 2016 to 2018                                                    41

Chapter 5    Looking deeper: What does ISSE data tell us about postgraduate
             taught (PGT) students?                                                                    46
             5.1 Engagement of postgraduate taught (PGT) students                                      46
             Key points from analysis of PGT data                                                      47
             5.2 Characteristics of postgraduate taught (PGT) students                                 48
             5.3 Overview of Workplace Readiness for PGT students                                      50
		               5.3.1 Detailed results (Workplace Readiness for PGT students)                         50
			                   Improved knowledge and skills that contribute to your employability              50
			                   Explored how to apply your learning in the workplace                             52
			                   Blended academic learning with workplace experience                              54
			 Contribution to your knowledge, skills and personal development
			                   in acquiring job- or work-related knowledge and skills                           56
             5.4 Overview of PGT students’ relationship with academic staff                            58
		               5.4.1 Detailed results (PGT students’ relationship with academic staff)               60
			                   Worked with academic staff on activities other than coursework
			                   (committees, student groups, etc.)                                               60
			                   Discussed course topics, ideas or concepts with academic staff
			                   outside of class                                                                 62
			                   Discussed your performance with academic staff                                   64
             5.5 A note about postgraduate research (PGR) students                                     66

Chapter 6    Next steps		                                                                              67
             6.1 Continuing to promote the potential of ISSE data                                      67
             6.2 Closing the loop for postgraduate research students                                   68

Appendix 1   Project rationale and governance                                                          69

Appendix 2   Questions relating to specific engagement indicators                                      71

Appendix 3   Participation in ISSE 2018                                                                73

2                                                                    THE IRISH SURVEY OF STUDENT ENGAGEMENT (ISSE)
INTRODUCTION
AND OVERVIEW
A
This report presents results lmost 60,000 students responded to
the original ISSE questions from 2013
from the latest fieldwork of to 2015 and more than 103,000 have
the Irish Survey of Student responded to the current questions in
2016, 2017 and 2018. 38,371 students
Engagement (ISSE). from twenty seven higher education institutions
participated in the survey in 2018. This represents
The same set of questions another year-on-year increase in the number of
was used in 2018 (for the respondents, adding to the comprehensive data
set on how students engage with their learning
third time). This current and learning environments. The Irish Survey of
question set will be used Student Engagement explores the amount of time
and effort that students put into their studies and
for the foreseeable future, other educationally purposeful activities, and, also,
although there will be how effectively institutions facilitate, encourage
and promote student engagement in activities that
periodic reviews to ensure are linked to learning. The results of the survey
that it continues to meet are intended to add value at institutional level (for
students and for staff) and to inform national policy.
the needs of partners and
remains broadly aligned to
Overview of the report
international engagement CHAPTER 1 of the report outlines the focus on
surveys. Many of the current student engagement with learning and provides an
overview of the structure of the survey. This chapter
questions relate closely to highlights some strategic uses of ISSE data by
questions used since 2013 institutions and national initiatives and offers some
guidance on interpreting the data.
and responses to these
can contribute to further CHAPTER 2 of the report provides details of student
responses to each of the questions asked. These are
longitudinal analyses. presented as percentages of students selecting each
response. Results are provided for all participating
students and for each of the year groups / cohorts i.e.
first year undergraduate, final year undergraduate and
taught postgraduate. Questions are grouped together
according to the indicator to which they contribute.
Questions that do not contribute to specific indicators
are included in the final section.
RESULTS FROM 2 018 3INTRODUCTION AND OVERVIEW CHAPTER 3 presents an analysis of indicator scores The analysis in this chapter exemplifies the detail that at national level relating to student engagement. can be explored to inform discussion of identified Indicators present an additional way to explore the local, sectoral or national objectives and priorities. data by signalling differences in results of different groups of students or of similar groups over multiple CHAPTER 6 provides an outline of continuing actions survey iterations. Scores for any given indicator act being taken to support and encourage institutions as ‘signposts’ to areas of potential further interest. to realise the potential of this increasingly valuable The chapter includes charts illustrating 2018 indicator source of data. It gives examples of sharing and scores for various student groupings, i.e. indicator publicising ISSE developments through conferences scores presented by each year group / cohort, by and events and outlines plans to prompt further institution-type, by mode of study (full-time or part- analysis of data to inform learning at national level. It time) and by field of study. Some key observations also refers to the new pilot survey for postgraduate follow each chart. Fuller understanding of what the research students. data may tell us requires consideration of influencing factors, including the local context. CHAPTER 4 considers the results from ISSE 2018 in a wider context. This chapter presents an overview of indicator scores from 2016 to 2018, noting that a majority of indicator scores have increased at national level over these three years. Although not all differences are statistically significant, the data provides some evidence to support the statement from the report of the pilot ISSE in 2013 which noted that “Increased awareness of good practices and clarity on actual performance in relation to such practice tends to lead to enhancement of practice.” CHAPTER 5 provides a deeper insight into particular subsets of the data. Each year, this chapter illustrates the potential offered by further analysis of the rich dataset generated by the ISSE. It explores responses of different student groups to question items not considered in previous years’ national reports. To date, much of the focus on interpreting ISSE data has been on the responses of undergraduate students (first year and final year). This year, we explore the data for postgraduate students pursuing taught programmes. More than 16,000 postgraduate taught students have responded to the current question set from 2016 to 2018 and 20.9% of the target cohort took part in 2018 which amounts to 6,534 responses. Many of the question items in the survey have remained the same or very similar since the national pilot in 2013. This chapter explores a number of such questions using aggregated responses from postgraduate taught students from 2014 to 2018 i.e. all fieldwork to date, other than the pilot. 4 THE IRISH SURVEY OF STUDENT ENGAGEMENT (ISSE)
CHAPTER 1
CONTEXT FOR THE IRISH
SURVEY OF STUDENT
ENGAGEMENT (ISSE)
1.1
WHAT IS STUDENT ENGAGEMENT?
The term ‘student engagement’ is increasingly used         Accordingly, for the purposes of the ISSE, student
in educational contexts to refer to a range of related,    engagement reflects two key elements:
but distinct, understandings of the interaction between
students and the higher education institutions they        The first is the amount of time and effort that students
attend. Most, if not all, interpretations of student       put into their studies and other educationally purposeful
engagement are based on the extent to which students       activities. The second is how institutions deploy
actively avail of opportunities to involve themselves in   resources and organise curriculum and other learning
“educationally beneficial” activities and the extent to    opportunities to encourage students to participate in
which institutions enable, facilitate and encourage such   meaningful activities that are linked to learning.
involvement. The ISSE focuses on students’ engagement
with their learning and their learning environments.
It does not directly explore, for example, students’
involvement in quality assurance or in institutional
decision-making.

                            What
                          students
                            do...

                                                                                    What
                                                                                 institutions
                                                                                     do...

RESULTS FROM 2 018                                                                                                 5
CHAPTER 1 CONTEXT FOR THE IRISH SURVEY OF STUDENT ENGAGEMENT (ISSE)
THE ROLE OF STUDENTS
IN QUALITY
ENHANCEMENT
- USES OF ISSE DATA
In the 2017 Irish Survey of Student Engagement are less valuable to the students in their institutions if
national report, the Union of Students in Ireland (USI) they have not sought to involve those very students
highlighted the need to increase the use of ISSE data in a meaningful and collaborative way.
by students. We believe that a core mission of our
higher education institutions should be to foster an A thorough examination and review of the relationship
ethos of students as partners, but that requires real and between the student and ISSE data is therefore
meaningful culture change and an investment of effort required in order to ensure that each institution is
into initiatives that can place the student at the heart of genuinely gaining the most from the data. In this work,
the quality agenda. it is important that Students’ Unions and institutional
staff collaborate to find the best possible mechanisms
ISSE has built up an invaluable data set of student and initiatives to make student review of ISSE data a
opinion over the past 6 years which allows us not only reality across faculties, departments, and programmes.
to examine the issues facing students in the previous
academic year to inform improvements, but also to Quality assurance structures in Ireland have long been
discover and interrogate previously undiscovered held in high regard, providing a strong grounding for
trends. In order to gain a real insight into the data and improvement of the student voice. Often that voice
what students are telling us, that evidence base must has been more informal than formal, but that ground
be explored and interpreted by the widest possible is now shifting. Without a formal seat at the table for
audience within the higher education community. all academic representatives (Class Reps, Course Reps,
Faculty Reps, etc.) it is much more difficult to create
And therein lies the golden rule: Students create the informal spaces at peak times of the year to discuss
data in the first instance, therefore students must be the data. Indeed the capacity of our students to
involved in translating that data so that we can truly meaningfully contribute when they have not received
understand it. any formal QA or engagement training should be
considered.
This rule is based on the oft-cited foundation for
student engagement and partnership: that students Students’ Unions and institutions across the country
are experts in their own learning. The feedback loop are pondering the ways and means of formally
is a constant, but much current practice means that partnering with students and their representatives, not
the student cannot be seen at all stages of that loop. to diminish informal collaboration, but to strengthen
So, it is imperative that the interpretation of ISSE data it. ISSE should be considered a key driver of this
visibly includes students. A quality team, committee, or work, and invariably with more students at the table,
working group examining ISSE data are highly likely to more student-centred actions can be taken, ultimately
produce less informed interpretations and actions that improving engagement and response rates overall.
6 THE IRISH SURVEY OF STUDENT ENGAGEMENT (ISSE)CHAPTER 1 CONTEXT FOR THE IRISH SURVEY OF STUDENT ENGAGEMENT
1.2 Higher Education Authority. The National Forum for
the Enhancement of Teaching and Learning has made
USING ISSE TO SUPPORT significant use of ISSE data to inform activities for
its enhancement theme based on assessment1. The
ENHANCEMENT National Student Engagement Programme2 (NStEP) is
a national initiative addressing student involvement in
Development and implementation of the ISSE is driven decision-making processes and has a wider remit than
by the intention to inform, support and encourage the ISSE. Nevertheless, ISSE data and reports on follow
enhancement discussions and activities – primarily, up activities are used at many institutional analysis
but not exclusively, at institutional level - and to inform workshops with students and staff to support NStEP
national policy discussions. There is greater variation activities.
in results within institutions than between institutions. The ultimate aim of the ISSE is to encourage and support
This may be as expected given the range of curriculum institutions (and / or units within institutions) to progress
requirements and learning experiences across different through the stages of
fields of study. The survey is comprehensive and it n collecting data,
seeks to explore many different aspects of students’
experiences of higher education. Prioritisation of specific n analysing and understanding data,
uses of the data is a decision for individual institutions to n making decisions based on analysis of the data,
make. To date, it is most common for institutions to focus leading to impact at local level.
on uses of the data for enhancement of teaching and
learning or for quality assurance. Potential users of the These stages can be illustrated as follows:
data include teaching and learning units, quality offices,
student experience or support offices, Registrar’s offices
as well as disciplinary teams. These uses of data are not
mutually exclusive but the focus of interpretation of the
data can vary according to the particular ‘lens’ chosen.
Greatest benefit is realised when those exploring the
data have a deep understanding of the local context.
The capacity to interpret the data in a timely manner
remains variable between institutions but, nevertheless, Higher education institutions have multiple sources of
there is an increasing number of examples of effective data about their students. These data sources are used
uses of ISSE data. A series of video commentaries in increasingly sophisticated ways to identify good
are published at http://studentsurvey.ie/videos/ to practice and to plan for enhancement activities.
demonstrate some of the uses of data by institutions The ISSE dataset has become a valuable addition to
and national partners. In addition to institutional use of existing sources of information. The key benefit is the
survey data, the ISSE frequently features in institutions’ ability to review data in the context of similar institution-
self-evaluation reports prepared in advance of external types, all participating institutions nationally, and some
quality review and / or strategic dialogue with the international comparators, in addition to internal units.
1.3 It is worth noting that there are also questions that do
not directly contribute to an engagement indicator but
STRUCTURE OF which are included because of their value.
THE SURVEY Higher Reflective Quantitative Learning
Order and Integrative Reasoning Strategies
There are 67 question items in the survey. These Learning Learning
questions are grouped under certain engagement Student- Effective
indicators to simplify working with certain themes. Collaborative Quality of
Learning Faculty Teaching Interactions
Questions are grouped according to the indicator to Interaction Practices
which they have been proven to contribute. (Details of
statistical testing of ISSE data are provided on www. Supportive Other (non-indicator)
Environment question items
studentsurvey.ie). Indicators can be regarded as an
additional navigation tool to explore the data and
offer one approach to disaggregating data into more The full set of questions and the indicators to which they
accessible subsets, e.g. there may be a particular focus contribute are provided in appendix 2.
on Student-Faculty Interaction (interaction with academic
staff), or on Collaborative Learning. The following
indicators are used, and responses to contributing
questions are presented for each indicator in Chapter 2.
1. https://www.teachingandlearning.ie/enhancement-themes/assessment-resource-portal/
2. www.studentengagement.ie 7CHAPTER 1 CONTEXT FOR THE IRISH SURVEY OF STUDENT ENGAGEMENT
NOTES
NOTES FOR INTERPRETING THE DATA
Q: How is the score for each indicator calculated?
Indicator scores are indicators of relative performance and are not percentages. They are calculated scores to
enable interpretation of the data at a higher level than individual questions, i.e. to act as signposts to help the
reader to navigate large data sets. With the revised survey in use from 2016, responses to individual question
items are converted to a 60 point scale (rather than the 100 point scale used in the original survey) with the
lowest response placed at 0 and the highest response placed at 60. To illustrate, if response 3 is chosen from 4
possible responses to this question, this response converts to a score of 40 as in the example below:
Question Responses
(During the current year, how much has your
coursework emphasised...) Evaluating a point of Very little Some Quite a bit Very much
view, decision, or information source
Responses transformed to 60-point scale 0 20 40 60
Indicator scores are calculated for an individual student when he/ she provides responses to all or almost all
contributing questions. The exact number of responses required varies according to the indicator, based on
psychometric testing undertaken for the NSSE. All responses are required for Higher Order Learning, Quantitative
Reasoning, Learning Strategies, Collaborative Learning and Student-Faculty Interaction. All but one response are
required for Reflective and Integrative Learning, Effective Teaching Practices, Quality of Interactions, and Supportive
Environment. The indicator score is calculated from the mean of (non-blank) responses given. Indicator scores for
any particular student group, for example first years, are calculated as the mean of individual indicator scores.
Other than demographic data presented in table 2.1, all data in this report are weighted as outlined in section 2.2
Q: How can I make best use of indicator scores?
Indicator scores provide greatest benefit when used as signposts to explore the experiences of
different groups of students - for example, final year full-time students and final year part-time
students. In particular, indicator scores provide an insight into the experiences of comparable cohorts
over multiple datasets e.g. the experiences of 2017 first year students relative to 2016 first year students.
If a particular indicator score prompts interest, it is most appropriate to investigate further by considering the
number of respondents (to check if responses may be regarded as representative of that group) and by reviewing
responses to contributing questions.
STEPS TO CONSIDER WHEN INTERPRETING INDICATOR SCORES
Indicator score Review number Review Potentially,
appears higher of respondents to responses explore further
form view on how
/ lower than for representative to related with student
other groups the data may be questions groups
8 THE IRISH SURVEY OF STUDENT ENGAGEMENT (ISSE)CHAPTER 1 CONTEXT FOR THE IRISH SURVEY OF STUDENT ENGAGEMENT
Q: Should I compare scores for different indicators?
Different indicators should not be compared to each other. For example, there is no
simple direct link between scores for Collaborative Learning and scores for Student-Faculty
Interaction. The following chart is used to illustrate this point. No useful interpretation can
be drawn from the fact that scores for Collaborative Learning are generally higher than scores
for Student-Faculty Interaction. However, the following differences may usefully be explored:
Collaborative Learning scores for final year students are higher than Collaborative Learning scores
for other cohorts; Student-Faculty Interaction scores appear notably lower for first years than
Student-Faculty Interaction scores for other cohorts.
50
■ First Year
■ Final Year
■ PG Taught
40
37.0
34.7
33.4
32.5
30
29.8
29.1
20
16.3
16.2
10
11.7
0
Collaborative Student-Faculty Effective Teaching
Learning Interaction Practices
RESULTS FROM 2 018 9Analysis of ISSE data to date demonstrates that, in
common with other countries that have implemented
comparable surveys, greatest variation is evident
within institutions rather than between institutions.
This reinforces the view that
staff and students within
individual institutions are best
placed to own and interrogate
institution-level data.
They best understand the local
context and are well-placed to
plan appropriate enhancement
actions.
10 THE IRISH SURVEY OF STUDENT ENGAGEMENT (ISSE)CHAPTER 2
RESULTS AND FINDINGS
OF THE 2018 ISSE
2.1 rate for Universities, overall, increased from 23.7% in
2017 to 26.1% in 2018. The response rate for Institutes
INTRODUCTION of Technology, overall, decreased slightly from 31.1%
in 2017 to 30.8% in 2018. The response rate for ‘‘Other
This chapter presents results from 2018 fieldwork for the Institutions’’ decreased from 31.0% in 2017 to 26.5% in
Irish Survey of Student Engagement (ISSE). It provides 2018. As noted in previous reports, response rates for
an overview of response rates for different groups of any one year should not be taken as a direct indication
the student population and of the demographic profile of the effort expended to promote participation within
of respondents. This is followed by national-level individual institutions as experience demonstrates that a
percentage responses for individual questions. Questions range of factors can influence the number of responses
are grouped according to the related engagement achieved in any given year. Nevertheless, any institution
indicator. Questions that do not directly relate to an that experiences decreasing response rates repeatedly
indicator are presented in section 2.3.10. should reflect on the nature, tone and visibility of
feedback activities.
2.2 The ISSE continues to contribute to a substantial dataset
RESPONSE RATES to inform discussion of the experiences of students in Irish
higher education institutions. Almost 60,000 students
AND DEMOGRAPHICS responded to the original ISSE questions from 2013 to
2015 and more than 103,000 have responded to the
A total of 38,371 students responded to the 2018 current questions in 2016, 2017 and 2018.
survey. This produced an overall national response rate
of 28.0%, which is the highest response rate since the All partners acknowledge the importance of increasing
ISSE began and demonstrates a small increase on the response rates to support reliable analysis of the
comparable figure of 27.2% in 2017. The sample includes experiences of sub-groups of the student population
18,554 first year undergraduate students, 13,283 final within institutions. The value of the survey as a tool for
year undergraduate students and 6,534 postgraduate the enhancement of teaching and learning within each
students. Table 2.1 presents the demographic profile of institution is greatest when the data enable reliable
respondents. analysis for sub-groups such as for faculty / department
/ learning support unit. It is accepted, however, that with
As in previous years, the profile of respondents in 2018 twenty one of the twenty seven participating institutions
closely matches the national student population profile. achieving response rates greater than 25% (seventeen
All results presented in this report, other than the achieved this in 2017), and with ten response rates
demographic data presented in tables 2.1 and 5.1, have greater than 30% (twelve in 2017), some institutions will
been weighted by sex, mode of study and year / cohort. find it challenging to continue to increase response rates
The use of weighting improves the extent to which on an annual basis. Indeed, it may prove more beneficial
respondents match the target student population and is in some cases to increase the emphasis on interpretation
regarded as standard practice with survey data. of the data and decision-making based on this analysis
rather than focussing primarily on increasing response
It is positive to note that the total number of responses rates. This is a judgement to be made at institutional
nationally has increased again this year. The response level. A realistic aim in the medium term may be to
RESULTS FROM 2 018 11CHAPTER 2 RESULTS AND FINDINGS OF THE 2018 ISSE
ensure that the number of responses is sufficient to
enable reliable analysis of the subsets of the data that
correspond to the organisational structures that are
likely to make greatest use of this analysis. At any
particular time, in some institutions this may equate to
faculty / school / department / programme or other units.
It is important that all institutions continue to act (in an
appropriate manner) on the data they have available
rather than “wait” for some target response rate.
Students will respond to the survey when it is
clear to them that the staff they encounter on
a regular basis value the resulting data.
This is the factor that will have greatest impact
on the number of responses and, accordingly,
enable reliable analysis of increasingly
disaggregated data.
Communication of analysis and follow-up
are essential: Why should students take part
in the survey if they feel that they have heard
nothing since the previous occasion they were
asked to take part?
12 THE IRISH SURVEY OF STUDENT ENGAGEMENT (ISSE)CHAPTER 2 RESULTS AND FINDINGS OF THE 2018 ISSE
Table 2.1 Demographic characteristics of respondents
Response
Characteristic Population Responses
Rate (%)
National 137,025 38,371 28.0%
Age
23 and Under 76,855 56.1% 25,027 65.2% 32.6%
24 and Over 60,116 43.9% 13,344 34.8% 22.2%
Gender
Female 71,430 52.1% 22,743 59.3% 31.8%
Male 65,595 47.9% 15,628 40.7% 23.8%
Institution-type
Universities 71,848 52.4% 18,740 48.8% 26.1%
Institutes of Technology 55,550 40.5% 17,083 44.5% 30.8%
Other institutions 9,627 7.0% 2,548 6.6% 26.5%
Mode of Study
Full-time 106,800 77.9% 33,750 88.0% 31.6%
Part-time / remote 30,225 22.1% 4,621 12.0% 15.3%
Field of Study
Generic Programmes & Qualifications 463 0.3% 71 0.2% 15.3%
Education 9,682 7.1% 2,507 6.5% 25.9%
Arts & Humanities 20,130 14.7% 6,187 16.1% 30.7%
Social Sciences, Journalism & Information 7,990 5.8% 2,111 5.5% 26.4%
Business, Administration & Law 30,641 22.4% 8,438 22.0% 27.5%
Natural Sciences, Mathematics & Statistics 11,514 8.4% 3,824 10.0% 33.2%
Information & Communication Technologies 11,154 8.1% 3,036 7.9% 27.2%
Engineering, Manufacturing & Construction 14,763 10.8% 4,026 10.5% 27.3%
Agriculture, Forestry, Fisheries & Veterinary 2,106 1.5% 555 1.4% 26.4%
Health & Welfare 22,338 16.3% 5,788 15.1% 25.9%
Services 6,244 4.6% 1,828 4.8% 29.3%
Year/Cohort
Undergraduate – First Year 56,533 41.3% 18,554 48.4% 32.8%
Undergraduate – Final Year 49,189 35.9% 13,283 34.6% 27.0%
Postgraduate (taught) 31,303 22.8% 6,534 17.0% 20.9%
RESULTS FROM 2 018 13CHAPTER 2 RESULTS AND FINDINGS OF THE 2018 ISSE
2.3
RESPONSES TO INDIVIDUAL QUESTIONS
Most individual questions relate to a specific engagement indicator. The scores for each indicator are calculated
from responses to multiple questions that contribute to that indicator. Percentage responses to each question are
presented in the following section and are grouped under the relevant indicator title. These responses represent all
respondents nationally, regardless of institution-type. This report also includes responses to questions that do not
contribute to specific indicators but are included in the survey because of their value. These are presented in
section 2.3.10
2.3.1
QUESTIONS RELATING TO
HIGHER ORDER LEARNING
These questions explore the extent to which students' work emphasises challenging cognitive tasks such as
application, analysis, judgement, and synthesis.
Question and percentage response
Undergraduate -
Undergraduate -
During the current academic year, All Students
PG Taught
Final Year
how much has your coursework
First Year
emphasised...
Applying facts, theories, or methods to practical problems Very little 6.0% 6.6% 6.5% 3.7%
or new situations Some 25.5% 27.6% 26.0% 18.9%
Quite a bit 42.4% 42.1% 41.7% 44.3%
Very much 26.1% 23.7% 25.8% 33.0%
Analysing an idea, experience, or line of reasoning in Very little 7.5% 8.8% 7.5% 3.8%
depth by examining its parts Some 29.6% 32.7% 30.3% 19.8%
Quite a bit 39.6% 38.9% 39.1% 42.3%
Very much 23.4% 19.6% 23.1% 34.1%
Evaluating a point of view, decision, or information source Very little 7.8% 8.8% 8.3% 4.2%
Some 29.1% 32.6% 28.7% 20.4%
Quite a bit 40.3% 39.7% 40.1% 42.5%
Very much 22.8% 18.9% 22.9% 33.0%
Forming an understanding or new idea from various pieces Very little 5.5% 6.1% 5.9% 3.2%
of information Some 26.5% 29.3% 27.0% 18.0%
Quite a bit 42.0% 42.0% 41.8% 42.3%
Very much 26.0% 22.6% 25.4% 36.4%
14 THE IRISH SURVEY OF STUDENT ENGAGEMENT (ISSE)CHAPTER 2 RESULTS AND FINDINGS OF THE 2018 ISSE
2.3.2
QUESTIONS RELATING TO
REFLECTIVE AND INTEGRATIVE LEARNING
These questions explore the extent to which students relate their own understanding and experiences to the learning
content being used.
Question and percentage response
Undergraduate -
Undergraduate -
During the current academic year,
All Students
PG Taught
Final Year
about how often have you...
First Year
Combined ideas from different subjects / modules when Never 5.8% 7.6% 4.5% 3.2%
completing assignments Sometimes 37.6% 41.7% 35.7% 29.7%
Often 39.2% 37.1% 40.2% 43.0%
Very often 17.5% 13.6% 19.7% 24.1%
Connected your learning to problems or issues in society Never 17.8% 21.4% 16.7% 9.7%
Sometimes 40.6% 43.2% 40.6% 33.0%
Often 28.8% 25.8% 29.6% 35.4%
Very often 12.9% 9.6% 13.0% 21.9%
Included diverse perspectives (political, religious, racial/ Never 33.8% 37.0% 33.4% 25.9%
ethnic, gender, etc.) in discussions or assignments Sometimes 37.1% 38.0% 36.8% 35.3%
Often 20.2% 18.3% 20.5% 25.1%
Very often 8.8% 6.7% 9.3% 13.7%
Examined the strengths and weaknesses of your own views Never 11.1% 13.4% 10.9% 4.9%
on a topic or issue Sometimes 41.3% 43.7% 41.7% 33.8%
Often 35.8% 33.4% 35.5% 43.5%
Very often 11.8% 9.5% 11.9% 17.8%
Tried to better understand someone else's views by Never 7.9% 9.4% 7.2% 4.7%
imagining how an issue looks from their perspective Sometimes 39.6% 41.4% 39.5% 34.8%
Often 37.3% 35.7% 37.3% 41.5%
Very often 15.2% 13.4% 15.9% 19.0%
Learned something that changed the way you understand Never 3.5% 4.1% 3.5% 1.8%
an issue or concept? Sometimes 35.4% 36.9% 37.0% 28.0%
Often 43.8% 43.3% 43.1% 46.6%
Very often 17.3% 15.7% 16.4% 23.6%
Connected ideas from your subjects / modules to your Never 3.3% 4.1% 3.3% 1.4%
prior experiences and knowledge Sometimes 31.4% 35.1% 31.9% 19.5%
Often 42.7% 41.7% 43.6% 43.5%
Very often 22.6% 19.0% 21.2% 35.6%
RESULTS FROM 2 018 15CHAPTER 2 RESULTS AND FINDINGS OF THE 2018 ISSE
2.3.3
QUESTIONS RELATING TO
QUANTITATIVE REASONING
These questions explore students’ opportunities to develop their skills to reason quantitatively – to evaluate, support
or critique arguments using numerical and statistical information.
Question and percentage response
Undergraduate -
Undergraduate -
During the current academic year,
All Students
PG Taught
Final Year
about how often have you...
First Year
Reached conclusions based on your analysis of numerical Never 26.1% 29.0% 23.8% 22.8%
information (numbers, graphs, statistics, etc.) Sometimes 40.8% 41.6% 39.2% 41.6%
Often 24.1% 22.3% 26.0% 24.9%
Very often 9.1% 7.1% 11.0% 10.8%
Used numerical information to examine a real-world Never 37.9% 41.6% 35.6% 32.4%
problem or issue (unemployment, climate change, public Sometimes 38.1% 37.6% 38.6% 38.6%
health, etc.)
Often 17.7% 15.9% 18.9% 20.6%
Very often 6.2% 4.9% 6.9% 8.4%
Evaluated what others have concluded from numerical Never 37.1% 39.9% 35.0% 33.3%
information Sometimes 42.6% 43.0% 42.3% 42.4%
Often 16.5% 14.3% 18.0% 19.4%
Very often 3.8% 2.8% 4.7% 4.9%
16 THE IRISH SURVEY OF STUDENT ENGAGEMENT (ISSE)CHAPTER 2 RESULTS AND FINDINGS OF THE 2018 ISSE
2.3.4
QUESTIONS RELATING TO
LEARNING STRATEGIES
These questions explore the extent to which students actively engage with, and analyse, course material rather than
approaching learning passively.
Question and percentage response
Undergraduate -
Undergraduate -
During the current academic year,
All Students
PG Taught
Final Year
about how often have you...
First Year
Identified key information from recommended reading Never 9.6% 12.5% 8.8% 3.1%
materials Sometimes 39.9% 43.8% 40.3% 28.4%
Often 36.8% 33.2% 37.3% 45.6%
Very often 13.7% 10.5% 13.5% 23.0%
Reviewed your notes after class Never 8.3% 7.4% 10.6% 6.4%
Sometimes 41.6% 42.0% 43.3% 37.0%
Often 34.8% 34.8% 32.7% 39.2%
Very often 15.3% 15.8% 13.4% 17.3%
Summarised what you learned in class or from course Never 9.2% 9.3% 9.9% 7.3%
materials Sometimes 42.4% 43.1% 42.6% 39.9%
Often 35.7% 35.0% 35.3% 38.4%
Very often 12.8% 12.6% 12.2% 14.4%
RESULTS FROM 2 018 17CHAPTER 2 RESULTS AND FINDINGS OF THE 2018 ISSE
2.3.5
QUESTIONS RELATING TO
COLLABORATIVE LEARNING
These questions explore the extent to which students collaborate with peers to solve problems or to master difficult
material, thereby deepening their understanding.
Question and percentage response
Undergraduate -
Undergraduate -
During the current academic year,
All Students
PG Taught
Final Year
about how often have you...
First Year
Asked another student to help you understand course Never 10.9% 10.6% 9.6% 14.6%
material Sometimes 47.1% 46.7% 45.3% 52.1%
Often 29.5% 30.6% 30.6% 24.1%
Very often 12.5% 12.1% 14.5% 9.3%
Explained course material to one or more students Never 6.9% 7.2% 6.4% 7.4%
Sometimes 45.5% 47.2% 41.9% 48.0%
Often 33.4% 33.3% 34.6% 31.1%
Very often 14.3% 12.4% 17.2% 13.6%
Prepared for exams by discussing or working through Never 16.2% 17.6% 12.6% 19.8%
course material with other students Sometimes 36.2% 38.8% 33.4% 34.2%
Often 30.4% 29.8% 31.7% 29.7%
Very often 17.2% 13.9% 22.3% 16.3%
Worked with other students on projects or assignments Never 9.9% 9.7% 8.7% 12.7%
Sometimes 33.2% 36.9% 29.5% 30.2%
Often 33.2% 34.7% 33.2% 28.7%
Very often 23.8% 18.7% 28.6% 28.4%
18 THE IRISH SURVEY OF STUDENT ENGAGEMENT (ISSE)CHAPTER 2 RESULTS AND FINDINGS OF THE 2018 ISSE
2.3.6
QUESTIONS RELATING TO
STUDENT-FACULTY INTERACTION
These questions explore the extent to which students interact with academic staff. Interactions with academic staff can
positively influence cognitive growth, development and persistence of students.
Question and percentage response
Undergraduate -
Undergraduate -
During the current academic year,
All Students
PG Taught
Final Year
about how often have you...
First Year
Talked about career plans with academic staff Never 50.4% 59.3% 40.9% 44.6%
Sometimes 33.3% 28.4% 38.4% 36.7%
Often 12.2% 9.4% 15.5% 13.4%
Very often 4.1% 2.8% 5.3% 5.3%
Worked with academic staff on activities other than Never 67.1% 71.0% 63.0% 64.4%
coursework (committees, student groups, etc.) Sometimes 22.4% 20.3% 24.6% 23.7%
Often 8.2% 6.8% 9.5% 9.1%
Very often 2.4% 2.0% 2.8% 2.7%
Discussed course topics, ideas, or concepts with academic Never 42.5% 50.8% 37.0% 30.5%
staff outside of class Sometimes 38.4% 34.2% 41.2% 44.8%
Often 14.6% 11.6% 16.7% 18.7%
Very often 4.4% 3.3% 5.1% 6.1%
Discussed your performance with academic staff Never 38.4% 45.2% 32.5% 31.4%
Sometimes 43.1% 39.8% 45.7% 47.2%
Often 14.7% 12.0% 17.3% 17.0%
Very often 3.8% 3.0% 4.5% 4.4%
RESULTS FROM 2 018 19CHAPTER 2 RESULTS AND FINDINGS OF THE 2018 ISSE
2.3.7
QUESTIONS RELATING TO
EFFECTIVE TEACHING PRACTICES
These questions explore the extent to which students experience teaching practices that contribute to promoting
comprehension and learning.
Question and percentage response
Undergraduate -
Undergraduate -
During the current academic year,
All Students
PG Taught
Final Year
to what extent have
First Year
lecturers / teaching staff...
Clearly explained course goals and requirements Very little 5.6% 5.6% 6.1% 4.6%
Some 25.1% 25.3% 27.3% 20.4%
Quite a bit 42.4% 42.8% 42.7% 40.8%
Very much 26.9% 26.3% 24.0% 34.2%
Taught in an organised way Very little 4.5% 3.6% 5.9% 4.2%
Some 26.3% 25.5% 29.1% 23.1%
Quite a bit 43.4% 44.6% 43.5% 40.0%
Very much 25.7% 26.3% 21.5% 32.8%
Used examples or illustrations to explain difficult points Very little 4.0% 3.5% 5.0% 3.4%
Some 22.8% 22.4% 25.0% 19.3%
Quite a bit 41.2% 41.1% 42.0% 39.8%
Very much 32.0% 33.0% 28.0% 37.4%
Provided feedback on a draft or work in progress Very little 20.9% 21.6% 20.6% 19.3%
Some 33.0% 34.1% 33.1% 29.8%
Quite a bit 28.6% 28.2% 29.4% 28.2%
Very much 17.5% 16.1% 16.9% 22.7%
Provided prompt and detailed feedback on tests or Very little 21.0% 20.2% 23.0% 19.0%
completed assignments Some 33.2% 33.7% 33.9% 30.2%
Quite a bit 28.4% 28.8% 28.0% 28.3%
Very much 17.5% 17.3% 15.2% 22.4%
20 THE IRISH SURVEY OF STUDENT ENGAGEMENT (ISSE)CHAPTER 2 RESULTS AND FINDINGS OF THE 2018 ISSE
2.3.8
QUESTIONS RELATING TO
QUALITY OF INTERACTIONS
These questions explore student experiences of supportive relationships with a range of other people and roles on
campus, thereby contributing to students’ ability to find assistance when needed and to learn from and with those
around them. Not applicable is available as a response option. ‘Not applicable’ responses have been removed from
these results.
Question and percentage response
Undergraduate -
Undergraduate -
At your institution, please indicate
All Students
PG Taught
Final Year
the quality of interactions with...
First Year
Students Poor 2.0% 1.7% 2.5% 1.8%
2 2.2% 1.9% 2.6% 2.2%
3 5.3% 5.0% 5.9% 4.8%
4 11.6% 11.5% 12.2% 10.9%
5 20.0% 20.9% 19.6% 17.9%
6 22.8% 23.2% 21.9% 23.4%
Excellent 36.1% 35.7% 35.3% 38.9%
Academic advisors Poor 5.7% 5.1% 7.1% 4.3%
2 6.8% 7.0% 7.4% 4.8%
3 11.9% 13.2% 12.3% 7.8%
4 17.8% 19.0% 18.0% 13.9%
5 21.4% 21.7% 21.8% 19.9%
6 17.6% 16.8% 16.8% 21.6%
Excellent 18.8% 17.2% 16.6% 27.9%
Academic staff Poor 3.3% 3.1% 3.9% 2.8%
2 4.8% 4.9% 5.4% 3.1%
3 9.8% 10.7% 10.3% 6.5%
4 16.1% 17.4% 16.3% 12.5%
5 22.5% 22.8% 22.9% 20.9%
6 20.9% 20.2% 20.6% 23.4%
Excellent 22.6% 20.9% 20.7% 30.8%
RESULTS FROM 2 018 21CHAPTER 2 RESULTS AND FINDINGS OF THE 2018 ISSE
Question and percentage response
Undergraduate -
Undergraduate -
At your institution, please indicate
All Students
PG Taught
Final Year
the quality of interactions with...
First Year
Support services staff (career services, student activities, Poor 7.5% 6.2% 9.1% 7.2%
accommodation, etc.) 2 7.6% 6.9% 8.8% 6.6%
3 11.5% 10.9% 13.0% 9.6%
4 17.1% 16.9% 18.1% 15.7%
5 19.5% 20.3% 18.9% 18.5%
6 17.7% 18.5% 15.9% 19.6%
Excellent 19.2% 20.2% 16.2% 22.8%
Other administrative staff and offices (registry, finance, etc.) Poor 7.2% 6.1% 9.1% 6.0%
2 8.0% 7.6% 9.4% 6.3%
3 11.4% 11.2% 12.5% 9.7%
4 17.2% 17.9% 17.4% 14.8%
5 19.9% 20.6% 19.7% 18.6%
6 17.2% 17.4% 15.4% 20.3%
Excellent 19.1% 19.1% 16.6% 24.3%
2.3.9
QUESTIONS RELATING TO
SUPPORTIVE ENVIRONMENT
These questions explore students’ perceptions of how much an institution emphasises services and activities that
support their learning and development.
Question and percentage response
Undergraduate -
Undergraduate -
How much does your institution
All Students
PG Taught
Final Year
emphasise...
First Year
Providing support to help students succeed academically Very little 8.6% 6.8% 10.7% 9.1%
Some 32.4% 29.1% 36.9% 32.3%
Quite a bit 38.5% 40.0% 36.7% 38.3%
Very much 20.5% 24.2% 15.7% 20.3%
22 THE IRISH SURVEY OF STUDENT ENGAGEMENT (ISSE)CHAPTER 2 RESULTS AND FINDINGS OF THE 2018 ISSE
Question and percentage response
Undergraduate -
Undergraduate -
How much does your institution
All Students
PG Taught
Final Year
emphasise...
First Year
Using learning support services (learning centre, computer Very little 14.6% 12.2% 17.3% 15.8%
centre, maths support, writing support etc.) Some 28.7% 25.3% 32.1% 31.0%
Quite a bit 34.3% 35.1% 33.4% 34.2%
Very much 22.3% 27.4% 17.2% 18.9%
Contact among students from different backgrounds Very little 22.8% 19.5% 27.1% 23.3%
(social, racial/ethnic, religious, etc.) Some 34.2% 34.0% 35.4% 32.6%
Quite a bit 27.8% 29.3% 25.7% 28.1%
Very much 15.1% 17.2% 11.8% 16.0%
Providing opportunities to be involved socially Very little 14.9% 11.4% 17.2% 19.9%
Some 31.1% 28.0% 33.5% 34.4%
Quite a bit 34.4% 36.4% 33.6% 30.7%
Very much 19.6% 24.2% 15.7% 15.1%
Providing support for your overall well-being (recreation, Very little 14.7% 11.2% 17.3% 19.1%
health care, counselling, etc.) Some 31.6% 28.6% 33.9% 34.8%
Quite a bit 33.6% 35.3% 32.9% 30.5%
Very much 20.1% 24.8% 15.9% 15.6%
Helping you manage your non-academic responsibilities Very little 37.7% 32.4% 43.6% 40.5%
(work, family, etc.) Some 34.5% 36.1% 32.5% 34.1%
Quite a bit 19.8% 22.2% 17.8% 17.3%
Very much 8.0% 9.3% 6.2% 8.1%
Attending campus activities and events (special speakers, Very little 18.5% 16.2% 20.6% 20.5%
cultural performances, sporting events, etc.) Some 34.4% 32.0% 36.9% 36.2%
Quite a bit 31.9% 33.7% 30.7% 29.3%
Very much 15.2% 18.1% 11.8% 14.0%
Attending events that address important social, economic, Very little 25.9% 22.6% 29.7% 27.1%
or political issues Some 36.5% 35.3% 38.1% 36.6%
Quite a bit 25.9% 28.4% 23.1% 25.0%
Very much 11.6% 13.7% 9.0% 11.3%
RESULTS FROM 2 018 23CHAPTER 2 RESULTS AND FINDINGS OF THE 2018 ISSE
2.3.10
QUESTIONS NOT RELATING TO INDICATORS
These questions do not contribute to specific indicators but are included in the survey because of the value of student
responses to each individual item.
Question and percentage response
Undergraduate -
Undergraduate -
(Different question stems are used
All Students
PG Taught
Final Year
to prefix these items)
First Year
During the current academic year, about how often Never 8.3% 10.4% 7.9% 3.0%
have you... Sometimes 42.1% 46.7% 41.9% 29.2%
Often 30.5% 28.4% 30.4% 36.6%
Asked questions or contributed to discussions in class,
tutorials, labs or online Very often 19.2% 14.6% 19.7% 31.2%
During the current academic year, about how often Never 30.4% 31.3% 27.3% 34.4%
have you... Sometimes 49.1% 48.7% 48.9% 50.8%
Often 14.4% 14.0% 16.7% 10.7%
Come to class without completing readings
or assignments Very often 6.0% 5.9% 7.1% 4.1%
During the current academic year, about how often Never 18.5% 23.3% 13.3% 15.5%
have you... Sometimes 45.1% 48.6% 42.5% 40.5%
Often 24.3% 20.6% 28.1% 27.1%
Made a presentation in class or online
Very often 12.0% 7.4% 16.1% 16.9%
During the current academic year, about how often Never 5.8% 7.4% 4.8% 3.3%
have you... Sometimes 30.3% 33.4% 30.2% 21.5%
Often 41.5% 39.9% 42.6% 44.0%
Improved knowledge and skills that will contribute to your
employability Very often 22.4% 19.3% 22.4% 31.2%
During the current academic year, about how often Never 19.3% 25.3% 15.8% 9.6%
have you... Sometimes 35.8% 37.0% 37.1% 29.8%
Often 29.8% 25.9% 31.3% 37.5%
Explored how to apply your learning in the workplace
Very often 15.1% 11.7% 15.7% 23.1%
During the current academic year, about how often Never 30.1% 29.4% 29.4% 33.3%
have you... Sometimes 29.6% 28.9% 30.5% 29.8%
Often 20.2% 20.6% 20.0% 19.7%
Exercised or participated in physical fitness activities
Very often 20.1% 21.1% 20.1% 17.2%
During the current academic year, about how often Never 27.8% 36.9% 21.4% 15.3%
have you... Sometimes 31.7% 32.1% 33.2% 27.6%
Often 25.3% 20.5% 28.8% 31.8%
Blended academic learning with workplace experience
Very often 15.2% 10.5% 16.6% 25.3%
24 THE IRISH SURVEY OF STUDENT ENGAGEMENT (ISSE)CHAPTER 2 RESULTS AND FINDINGS OF THE 2018 ISSE
Question and percentage response
Undergraduate -
Undergraduate -
(Different question stems are used
All Students
PG Taught
Final Year
to prefix these items)
First Year
During the current academic year, about how often Never 22.2% 21.4% 25.8% 17.3%
have you... Sometimes 43.1% 44.4% 42.9% 39.9%
Often 27.2% 26.9% 25.0% 32.3%
Worked on assessments that informed you how well you
are learning Very often 7.5% 7.3% 6.3% 10.6%
During the current academic year, how much has your Very little 15.0% 11.5% 11.8% 30.6%
coursework emphasised... Some 34.0% 35.6% 30.5% 36.5%
Quite a bit 34.5% 36.9% 36.8% 23.4%
Memorising course material
Very much 16.5% 15.9% 20.9% 9.5%
Which of the following have you done or do you plan Have not decided 32.8% 44.5% 23.1% 20.7%
to do before you graduate from your institution... Do not plan to do 24.0% 18.0% 32.6% 23.1%
Plan to do 27.2% 34.3% 15.7% 31.3%
Work with academic staff on a research project
Done or in progress 16.0% 3.3% 28.7% 25.0%
Which of the following have you done or do you plan Have not decided 26.7% 28.7% 24.9% 24.7%
to do before you graduate from your institution... Do not plan to do 26.1% 16.1% 34.5% 36.2%
Plan to do 29.2% 40.4% 18.5% 20.7%
Community service or volunteer work
Done or in progress 18.0% 14.9% 22.1% 18.4%
How much does your institution emphasise... Very little 4.4% 5.3% 4.0% 2.9%
Some 25.6% 28.9% 23.5% 20.7%
Spending significant amounts of time studying and on
Quite a bit 46.3% 46.3% 45.8% 47.7%
academic work
Very much 23.7% 19.5% 26.7% 28.8%
How much has your experience at this institution Very little 12.9% 16.0% 10.7% 8.9%
contributed to your knowledge, skills and personal Some 31.0% 35.3% 27.4% 26.4%
development in the following areas...
Quite a bit 37.1% 34.6% 39.3% 39.5%
Writing clearly and effectively Very much 19.1% 14.1% 22.6% 25.2%
How much has your experience at this institution Very little 14.1% 16.3% 11.9% 12.9%
contributed to your knowledge, skills and personal Some 30.8% 34.0% 27.6% 28.6%
development in the following areas...
Quite a bit 36.6% 34.5% 39.3% 36.5%
Speaking clearly and effectively Very much 18.5% 15.1% 21.3% 22.0%
How much has your experience at this institution Very little 4.2% 4.9% 3.6% 3.8%
contributed to your knowledge, skills and personal Some 21.7% 25.3% 18.7% 18.1%
development in the following areas...
Quite a bit 42.2% 43.3% 42.1% 39.6%
Thinking critically and analytically Very much 31.9% 26.6% 35.6% 38.6%
RESULTS FROM 2 018 25CHAPTER 2 RESULTS AND FINDINGS OF THE 2018 ISSE
Question and percentage response
Undergraduate -
Undergraduate -
(Different question stems are used
All Students
PG Taught
Final Year
to prefix these items)
First Year
How much has your experience at this institution Very little 21.2% 22.4% 19.4% 21.4%
contributed to your knowledge, skills and personal Some 31.2% 32.8% 29.0% 31.5%
development in the following areas...
Quite a bit 29.5% 29.1% 30.8% 28.0%
Analysing numerical and statistical information Very much 18.1% 15.6% 20.8% 19.2%
How much has your experience at this institution Very little 12.3% 14.6% 10.9% 8.9%
contributed to your knowledge, skills and personal Some 29.1% 31.6% 27.9% 24.8%
development in the following areas...
Quite a bit 34.7% 33.2% 36.0% 35.9%
Acquiring job- or work-related knowledge and skills Very much 23.9% 20.6% 25.2% 30.4%
How much has your experience at this institution Very little 6.9% 6.9% 5.9% 9.0%
contributed to your knowledge, skills and personal Some 24.5% 25.9% 22.7% 24.4%
development in the following areas...
Quite a bit 40.3% 40.3% 41.6% 37.5%
Working effectively with others Very much 28.3% 26.9% 29.8% 29.1%
How much has your experience at this institution Very little 16.4% 18.6% 15.2% 13.0%
contributed to your knowledge, skills and personal Some 33.5% 35.3% 32.4% 30.8%
development in the following areas...
Quite a bit 32.5% 30.7% 34.0% 34.2%
Solving complex real-world problems Very much 17.6% 15.4% 18.4% 22.0%
How much has your experience at this institution Very little 22.9% 23.4% 23.1% 20.9%
contributed to your knowledge, skills and personal Some 34.5% 36.4% 33.4% 31.7%
development in the following areas...
Quite a bit 27.2% 26.0% 27.8% 29.3%
Being an informed and active citizen Very much 15.4% 14.1% 15.7% 18.0%
(societal / political / community)
How would you evaluate your entire educational Poor 3.1% 2.2% 4.3% 3.3%
experience at this institution? Fair 15.2% 13.5% 18.1% 13.9%
Good 50.7% 52.1% 50.4% 47.5%
Excellent 31.0% 32.2% 27.2% 35.3%
If you could start over again, would you go to the same Definitely no 3.5% 2.0% 5.5% 3.5%
institution you are now attending? Probably no 11.5% 9.9% 14.6% 9.7%
Probably yes 42.5% 42.1% 43.7% 41.3%
Definitely yes 42.4% 46.0% 36.2% 45.5%
26 THE IRISH SURVEY OF STUDENT ENGAGEMENT (ISSE)CHAPTER 3
ENGAGEMENT
INDICATORS AT
NATIONAL LEVEL
3.1
INTRODUCTION
Having provided detail of responses to individual n Gender
questions in the previous chapter, this chapter presents
an analysis of indicators from a variety of perspectives, n Age group
including by: n Country of domicile
n Year/cohort
Data generated by the original and revised ISSE surveys
n Institution-type have been tested for reliability and validity. Results of
this testing are published on www.studentsurvey.ie. In
n Mode of study
addition, 2018 results presented in this and the following
n Programme-type chapters have been tested for statistical significance
and the commentary that accompanies each chart refers
n Field of study only to those differences that can be proven with 95%
confidence or greater i.e. statistically significant (p0.05)
RESULTS FROM 2 018 27CHAPTER 3 ENGAGEMENT INDICATORS AT NATIONAL LEVEL
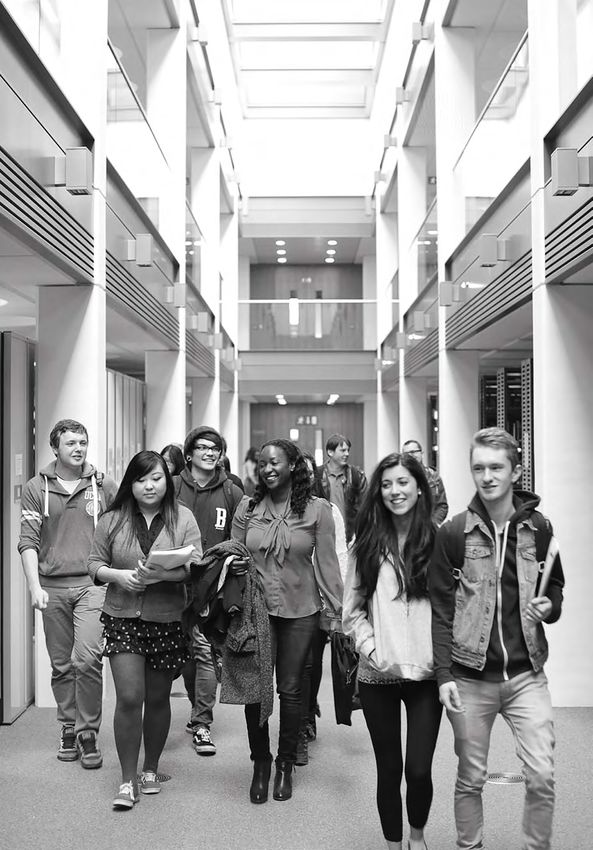
3.2
YEAR/COHORT
Indicator scores
provide signposts
to the experiences
50 of students.
■ First Year These are NOT
■ Final Year percentages.
■ PG Taught
41.9
41.5
40
39.3
37.7
37.0
36.5
35.1
35.4
34.8
34.4
33.4
32.9
Indicator scores
31.1
30
31.0
30.3
29.9
29.7
30.1
29.0
27.4
26.4
21.6
20
20.9
18.1
16.2
16.0
11.7
10
0
Higher Reflective Quantitative Learning Collaborative Student- Effective Quality of Supportive
Order and Reasoning Strategies* Learning* Faculty Teaching Interactions Environment
Learning Integrative Interaction* Practices
Learning
Figure 3.2 presents indicator scores for all participating Environment. Further exploration may be warranted
students from each year of study. It illustrates that to investigate the extent to which these results reflect
students’ reported experiences of Higher Order Learning, a particular focus for these students mid-way through
Reflective and Integrative Learning, and Quantitative the final year of their studies, or whether this cohort has
Reasoning are lowest for first year and highest for been relatively unaffected by intensive efforts to enhance
postgraduate taught students. The scores for Learning the experiences of targeted groups, such as first year
Strategies are significantly higher for students on students.
postgraduate taught programmes compared to both
undergraduate cohorts, whereas the Collaborative The differences in indicator scores are not statistically
Learning score is highest for final year students. significant between First Year and Final Year scores for
Learning Strategies; First Year and PG Taught scores for
Indicator scores for final year students are lower than Collaborative Learning; or between Final Year and PG
for other cohorts for each of the indicators, Effective Taught scores for Student-Faculty Interaction.
Teaching Practices, Quality of Interactions and Supportive
28 THE IRISH SURVEY OF STUDENT ENGAGEMENT (ISSE)CHAPTER 3 ENGAGEMENT INDICATORS AT NATIONAL LEVEL
3.3
INSTITUTION-TYPE
Compare
scores WITHIN
each Indicator
50 and NOT
between
Indicators
■ Universities
■ Institutes of Technology
40 ■ Other Institutions
39.8
39.2
■ All Institutions
38.7
38.1
38.0
36.7
36.7
35.5
35.4
34.7
34.1
33.1
Indicator scores
31.8
31.8
32.1
31.4
30
30.9
31.7
30.9
30.8
30.3
30.3
30.2
29.9
29.2
28.8
27.6
26.9
20
20.1
19.7
19.6
17.6
15.2
14.0
12.9
13.0
10
0
Higher Reflective Quantitative Learning Collaborative Student- Effective Quality of Supportive
Order and Reasoning Strategies* Learning* Faculty Teaching Interactions Environment
Learning Integrative Interaction* Practices
Learning*
Figure 3.3 presents indicator scores by institution-type disciplines is one of a number of influencing factors on
nationally. The institution-types are: Universities, Institutes the results presented here.
of Technology and ‘Other Institutions’. Participating
institutions are listed under these groupings in appendix Indicator scores for Higher Order Learning, Quantitative
3. The results are presented for the full cohort of Reasoning and Supportive Environment are higher for
respondents. Universities than for other institution-types. Scores for
Collaborative Learning, Effective Teaching Practices and
Overall indicator scores for each institution-type are for Quality of Interactions are higher for Institutes of
broadly similar and it is worth reiterating the fact that Technology than for other institution-types.
student engagement surveys tend to find greater
variation within institutions than between institutions The differences in indicator scores between Universities
(in Ireland and internationally). Some of the differences and ‘Other Institutions’ for Reflective and Integrative
presented in this chart may reflect the mission, culture Learning, Learning Strategies, Collaborative Learning and
or student population profile for different institutions. Student-Faculty Interaction are not statistically significant.
For example, the later chart 3.6 illustrates the different
experiences of students pursuing different fields of study
nationally. The proportion of students pursuing particular
RESULTS FROM 2 018 29CHAPTER 3 ENGAGEMENT INDICATORS AT NATIONAL LEVEL
3.4
MODE OF STUDY Compare
scores WITHIN
50 each Indicator
and NOT
between
Indicators
■ Full Time
40
40.7
■ Part Time or remote
39.0
38.8
36.2
37.2
34.1
33.6
32.1
Indicator scores
32.2
30
30.4
30.2
30.3
25.8
23.1
20
20.1
17.8
14.6
11.4
10
0
Higher Reflective Quantitative Learning Collaborative Student- Effective Quality of Supportive
Order and Reasoning Strategies Learning Faculty Teaching Interactions Environment
Learning Integrative Interaction Practices
Learning
Figure 3.4 presents indicator scores for full-time and full-time students and that a smaller proportion of this
part-time / remote students. The chart illustrates that population responded to the survey (15.3% compared to
full-time students report more frequent experiences 31.6% full-time). It is also acknowledged that the extent
of activities relating to Quantitative Reasoning, to which part-time students are studying particular fields
Collaborative Learning, Student-Faculty Interaction and of study may impact on these results.
Supportive Environment whereas part-time students
report more frequent experiences relating to Higher
Order Learning, Reflective and Integrative Learning,
Learning Strategies, Effective Teaching Practices and
Quality of Interactions. It is worth noting that there
are significantly fewer part-time-remote students than
30 THE IRISH SURVEY OF STUDENT ENGAGEMENT (ISSE)You can also read