Earthquake Shakes Twitter Users: Real-time Event Detection by Social Sensors
←
→
Page content transcription
If your browser does not render page correctly, please read the page content below
Earthquake Shakes Twitter Users:
                Real-time Event Detection by Social Sensors

                 Takeshi Sakaki                          Makoto Okazaki                      Yutaka Matsuo
              The University of Tokyo                   The University of Tokyo           The University of Tokyo
             Yayoi 2-11-16, Bunkyo-ku                  Yayoi 2-11-16, Bunkyo-ku          Yayoi 2-11-16, Bunkyo-ku
                   Tokyo, Japan                              Tokyo, Japan                      Tokyo, Japan
            sakaki@biz-model.t.u-                       m okazaki@biz-                 matsuo@biz-model.t.u-
                 tokyo.ac.jp                           model.t.u-tokyo.ac.jp                tokyo.ac.jp

ABSTRACT                                                             currently estimated as 44.5 million worldwide1 . Monthly
Twitter, a popular microblogging service, has received much          growth of users has been 1382% year-on-year, which makes
attention recently. An important characteristic of Twitter           Twitter one of the fastest-growing sites in the world2 .
is its real-time nature. For example, when an earthquake                Some studies have investigated Twitter: Java et al. an-
occurs, people make many Twitter posts (tweets) related              alyzed Twitter as early as 2007. They described the social
to the earthquake, which enables detection of earthquake             network of Twitter users and investigated the motivation
occurrence promptly, simply by observing the tweets. As              of Twitter users [13]. B. Huberman et al. analyzed more
described in this paper, we investigate the real-time inter-         than 300 thousand users. They discovered that the relation
action of events such as earthquakes, in Twitter, and pro-           between friends (defined as a person to whom a user has
pose an algorithm to monitor tweets and to detect a target           directed posts using an ”@” symbol) is the key to under-
event. To detect a target event, we devise a classifier of            standing interaction in Twitter [11]. Recently, boyd et al.
tweets based on features such as the keywords in a tweet,            investigated retweet activity, which is the Twitter-equivalent
the number of words, and their context. Subsequently, we             of e-mail forwarding, where users post messages originally
produce a probabilistic spatiotemporal model for the tar-            posted by others [5].
get event that can find the center and the trajectory of the             Twitter is categorized as a micro-blogging service. Mi-
event location. We consider each Twitter user as a sensor            croblogging is a form of blogging that allows users to send
and apply Kalman filtering and particle filtering, which are           brief text updates or micromedia such as photographs or au-
widely used for location estimation in ubiquitous/pervasive          dio clips. Microblogging services other than Twitter include
computing. The particle filter works better than other com-           Tumblr, Plurk, Emote.in, Squeelr, Jaiku, identi.ca, and so
pared methods in estimating the centers of earthquakes and           on3 . They have their own characteristics. Some examples
the trajectories of typhoons. As an application, we con-             are the following: Squeelr adds geolocation and pictures to
struct an earthquake reporting system in Japan. Because              microblogging, and Plurk has a timeline view integrating
of the numerous earthquakes and the large number of Twit-            video and picture sharing. Although our study is applicable
ter users throughout the country, we can detect an earth-            to other microblogging services, in this study, we specifically
quake by monitoring tweets with high probability (96% of             examine Twitter because of its popularity and data volume.
earthquakes of Japan Meteorological Agency (JMA) seis-                  An important common characteristic among microblog-
mic intensity scale 3 or more are detected). Our system              ging services is its real-time nature. Although blog users
detects earthquakes promptly and sends e-mails to regis-             typically update their blogs once every several days, Twit-
tered users. Notification is delivered much faster than the           ter users write tweets several times in a single day. Users
announcements that are broadcast by the JMA.                         can know how other users are doing and often what they are
                                                                     thinking about now, users repeatedly return to the site and
                                                                     check to see what other people are doing. The large num-
1. INTRODUCTION                                                      ber of updates results in numerous reports related to events.
                                                                     They include social events such as parties, baseball games,
   Twitter, a popular microblogging service, has received
                                                                     and presidential campaigns. They also include disastrous
much attention recently. It is an online social network used
                                                                     events such as storm, fire, traffic jam, riots, heavy rainfall,
by millions of people around the world to stay connected to
                                                                     and earthquakes. Actually, Twitter is used for various real-
their friends, family members and co-workers through their
                                                                     time notification such as that necessary for help during a
computers and mobile phones [18]. Twitter asks one ques-
                                                                     large-scale fire emergency and live traffic updates. Adam
tion, ”What are you doing?” Answers must be fewer than
                                                                     Ostrow, an Editor in Chief at Mashable, a social media news
140 characters. A status update message, called a tweet, is
                                                                     blog, wrote in his blog about the interesting phenomenon of
often used as a message to friends and colleagues. A user
                                                                     the real-time media as follows4 :
can follow other users; and her followers can read her tweets.
A user who is being followed by another user need not nec-
essarily have to reciprocate by following them back, which           1
                                                                       http://www.techcrunch.com/2009/08/03/twitter-reaches-
renders the links of the network as directed. After its launch       44.5-million-people-worldwide-in-june-comscore/
on July 2006, Twitter users have increased rapidly. They are         2
                                                                       According to a report from Nielsen.com.
                                                                     3
Copyright is held by the author/owner(s).                              www.tumblr.com,        www.plurk.com,       www.emote.in,
WWW2010, April 26-30, 2010, Raleigh, North Carolina.                 www.squeelr.com, www.jaiku.com, identi.ca
                                                                     4
.                                                                      http://mashable.com/2009/08/12/japan-earthquake/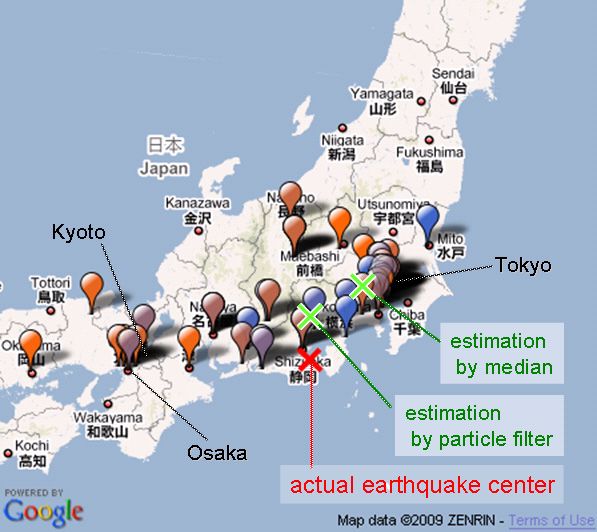
Japan Earthquake Shakes Twitter Users ...               in Japan.) Our system detects an earthquake occurrence
     And Beyonce: Earthquakes are one thing you can              and sends an e-mail, possibly before an earthquake actually
     bet on being covered on Twitter (Twitter) first,            arrives at a certain location: An earthquake propagates at
     because, quite frankly, if the ground is shaking,           about 3–7 km/s. For that reason, a person who is 100 km
     you’re going to tweet about it before it even reg-          distant from an earthquake has about 20 s before the arrival
     isters with the USGS and long before it gets re-            of an earthquake wave.
     ported by the media. That seems to be the case                 We present a brief overview of Twitter in Japan: The
     again today, as the third earthquake in a week has          Japanese version of Twitter was launched on April 2008. In
     hit Japan and its surrounding islands, about an             February 2008, Japan was the No. 2 country with respect to
     hour ago. The first user we can find that tweeted           Twitter traffic5 . At the time of this writing, Japan has the
     about it was Ricardo Duran of Scottsdale, AZ,               11th largest number of users (more than half a million users)
     who, judging from his Twitter feed, has been trav-          in the world. Although event detection (particularly the
     eling the world, arriving in Japan yesterday.               earthquake detection) is currently possible because of the
                                                                 high density of Twitter users and earthquakes in Japan, our
This post well represents the motivation of our study. The       study is useful to detect events of various types throughout
research question of our study is, ”can we detect such event     the world.
occurrence in real-time by monitoring tweets?”                      The contributions of the paper are summarized as follows:
   This paper presents an investigation of the real-time na-
ture of Twitter and proposes an event notification system              • The paper provides an example of integration of se-
that monitors tweets and delivers notification promptly. To              mantic analysis and real-time nature of Twitter, and
obtain tweets on the target event precisely, we apply se-               presents potential uses for Twitter data.
mantic analysis of a tweet: For example, users might make
tweets such as ”Earthquake!” or ”Now it is shaking” thus              • For earthquake prediction and early warning, many
earthquake or shaking could be keywords, but users might                studies have been made in the seismology field. This
also make tweets such as ”I am attending an Earthquake                  paper presents an innovative social approach, which
Conference”, or ”Someone is shaking hands with my boss”.                has not been reported before in the literature.
We prepare the training data and devise a classifier using a
                                                                   This paper is organized as follows: In the next section, we
support vector machine based on features such as keywords
                                                                 explain semantic analysis and sensory information, followed
in a tweet, the number of words, and the context of target-
                                                                 by the spatiotemporal model in Section 3. In Section 4, we
event words.
                                                                 describe the experiments and evaluation of event detection.
   Subsequently, we make a probabilistic spatiotemporal model
                                                                 The earthquake reporting system is introduced into Section
of an event. We make a crucial assumption: each Twitter
                                                                 5. Section 6 is devoted to related works and discussion.
user is regarded as a sensor and each tweet as sensory infor-
                                                                 Finally, we conclude the paper.
mation. These virtual sensors, which we call social sensors,
are of a huge variety and have various characteristics: some
sensors are very active; others are not. A sensor could be       2.    EVENT DETECTION
inoperable or malfunctioning sometimes (e.g., a user is sleep-      In this paper, we target event detection. An event is an ar-
ing, or busy doing something). Consequently, social sensors      bitrary classification of a space/time region. An event might
are very noisy compared to ordinal physical sensors. Regard-     have actively participating agents, passive factors, products,
ing a Twitter user as a sensor, the event detection problem      and a location in space/time [21]. We target events such as
can be reduced into the object detection and location es-        earthquakes, typhoons, and traffic jams, which are visible
timation problem in a ubiquitous/pervasive computing en-         through tweets. These events have several properties: i)
vironment in which we have numerous location sensors: a          they are of large scale (many users experience the event),
user has a mobile device or an active badge in an environ-       ii) they particularly influence people’s daily life (for that
ment where sensors are placed. Through infrared commu-           reason, they are induced to tweet about it), and iii) they
nication or a WiFi signal, the user location is estimated        have both spatial and temporal regions (so that real-time
as providing location-based services such as navigation and      location estimation would be possible). Such events include
museum guides [9, 25]. We apply Kalman filters and parti-         social events such as large parties, sports events, exhibi-
cle filters, which are widely used for location estimation in     tions, accidents, and political campaigns. They also include
ubiquitous/pervasive computing.                                  natural events such as storms, heavy rainfall, tornadoes,
   As an application, we develop an earthquake reporting         typhoons/hurricanes/cyclones, and earthquakes. We des-
system using Japanese tweets. Because of the numerous            ignate an event we would like to detect using Twitter as a
earthquakes in Japan and the numerous and geographically         target event.
dispersed Twitter users throughout the country, it is some-
times possible to detect an earthquake by monitoring tweets.     2.1     Semantic Analysis on Tweet
In other words, many earthquake events occur in Japan.              To detect a target event from Twitter, we search from
Many sensors are allocated throughout the country. Fig-          Twitter and find useful tweets. Tweets might include men-
ure 1 portrays a map of Twitter users worldwide (obtained        tions of the target event. For example, users might make
from UMBC eBiquity Research Group); Fig. 2 depicts a             tweets such as ”Earthquake!” or ”Now it is shaking”. Con-
map of earthquake occurrences worldwide (using data from         sequently, earthquake or shaking could be keywords (which
Japan Meteorological Agency (JMA)). It is apparent that          we call query words). but users might also make tweets such
the only intersection of the two maps, which means regions       as ”I am attending an Earthquake Conference”, or ”Some-
with many earthquakes and large Twitter users, is Japan.         one is shaking hands with my boss”. Moreover, even if a
(Other regions such as Indonesia, Turkey, Iran, Italy, and
Pacific US cities such as Los Angeles and San Francisco also      5
                                                                   http://blog.twitter.com/2008/02/twitter-web-traffic-around-
roughly intersect, although the density is much lower than       world.html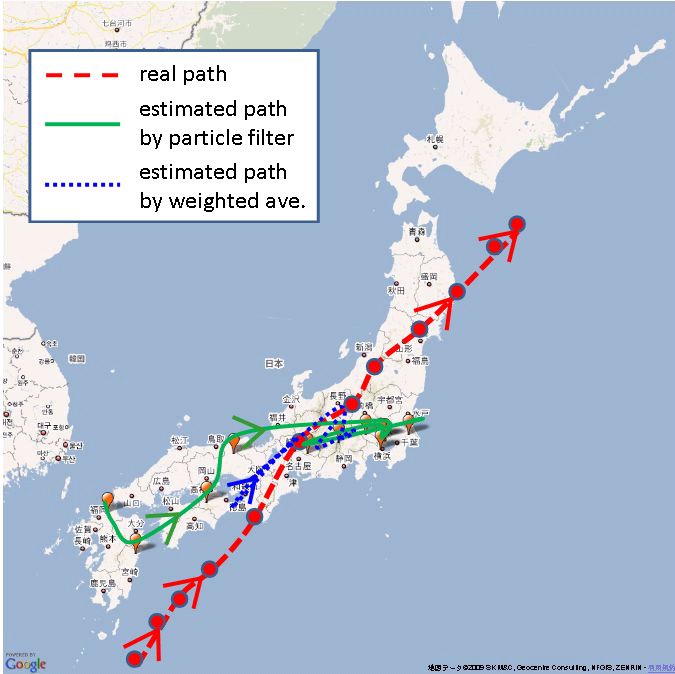
2.2    Tweet as a Sensory Value
                                                                       We can search the tweet and classify it into a positive class
                                                                    if a user makes a tweet on a target event. In other words, the
                                                                    user functions as a sensor of the event. If she makes a tweet
                                                                    about an earthquake occurrence, then it can be considered
                                                                    that she, as an ”earthquake sensor”, returns a positive value.
                                                                    A tweet can therefore be considered as a sensor reading.
                                                                    This is a crucial assumption, but it enables application of
                                                                    various methods related to sensory information.

                                                                    Assumption 2.1 Each Twitter user is regarded as a sen-
              Figure 1: Twitter user map.                           sor. A sensor detects a target event and makes a report
                                                                    probabilistically.
                                                                       The virtual sensors (or social sensors) have various char-
                                                                    acteristics: some sensors are activated (i.e. make tweets)
                                                                    only about specific events, although others are activated to
                                                                    a wider range of events. The number of sensors is large;
                                                                    there are more than 40 million sensors worldwide. A sen-
                                                                    sor might be inoperable or operating incorrectly sometimes
                                                                    (which means a user is not online, sleeping, or is busy do-
                                                                    ing something). Therefore, this social sensor is noisier than
                                                                    ordinal physical sensors such as location sensors, thermal
                                                                    sensors, and motion sensors.
                                                                       A tweet can be associated with a time and location: each
                                                                    tweet has its post time, which is obtainable using a search
                                                                    API. In fact, GPS data are attached to a tweet sometimes,
               Figure 2: Earthquake map.                            e.g. when a user is using an iPhone. Alternatively, each
                                                                    Twitter user makes a registration on their location in the
tweet is referring to the target event, it might not be appro-      user profile. The registered location might not be the current
priate as an event report; for example a user makes tweets          location of a tweet; however, we think it is probable that a
such as ”The earthquake yesterday was scaring”, or ”Three           person is near the registered location. In this study, we
earthquakes in four days. Japan scares me.” These tweets            use GPS data and the registered location of a user. We
are truly the mentions of the target event, but they are not        do not use the tweet for spatial analysis if the location is
real-time reports of the events. Therefore, it is necessary to      not available (We use the tweet information for temporal
clarify that a tweet is actually referring to an actual earth-      analyses.).
quake occurrence, which is denoted as a positive class.
   To classify a tweet into a positive class or a negative class,   Assumption 2.2 Each tweet is associated with a time and
we use a support vector machine (SVM) [14], which is a              location, which is a set of latitude and longitude.
widely used machine-learning algorithm. By preparing pos-
itive and negative examples as a training set, we can pro-             By regarding a tweet as a sensory value associated with
duce a model to classify tweets automatically into positive         a location information, the event detection problem is re-
and negative categories.                                            duced to detecting an object and its location from sensor
   We prepare three groups of features for each tweet as fol-       readings. Estimating an object’s location is arguably the
lows:                                                               most fundamental sensing task in many ubiquitous and per-
                                                                    vasive computing scenarios [7].
Features A (statistical features) the number of words                  Figure 3 presents an illustration of the correspondence
    in a tweet message, and the position of the query word          between sensory data detection and tweet processing. The
    within a tweet.                                                 motivations are the same for both cases: to detect a target
                                                                    event. Observation by sensors corresponds to an observa-
                                                                    tion by Twitter users. They are converted into values by a
Features B (keyword features) the words in a tweet6 .
                                                                    classifier. A probabilistic model is used to detect an event,
                                                                    as described in the next section.
Features C (word context features) the words before and
    after the query word.
                                                                    3.    MODEL
To handle Japanese texts, morphological analysis is con-              In order for event detection and location estimation, we
ducted using Mecab7 , which separates sentences into a set          use probabilistic models. In this section, we first describe
of words. In the case of English, we apply a standard stop-         event detection from time-series data. Then, we describe
word elimination and stemming. We compare the usefulness            the location estimation of a target event.
of the features in Section 4. Using the obtained model, we
can classify whether a new tweet corresponds to a positive          3.1    Temporal Model
class or a negative class.                                            Each tweet has its post time. When a target event oc-
                                                                    curs, how can the sensors detect the event? We describe the
6                                                                   temporal model of event detection.
  Because a tweet is usually short, we use every word in a
tweet by converting it into a word ID.                                First, we examine the actual data. Figures 4 and 5 re-
7
  http://mecab.sourceforge.net/                                     spectively present the numbers tweets for two target events: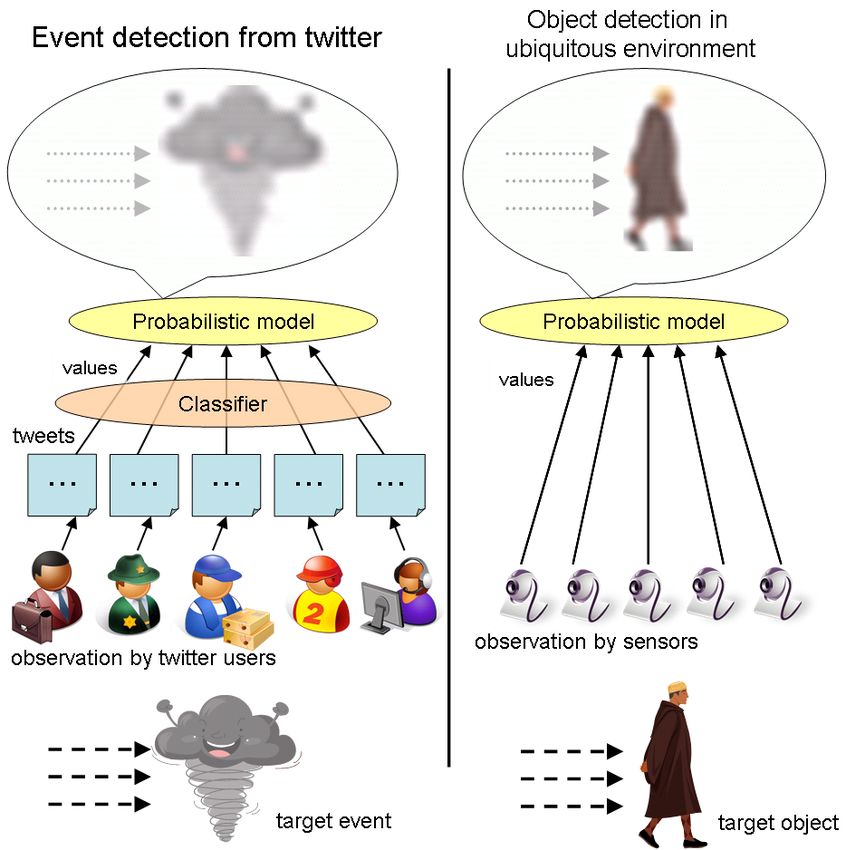
Figure 4: Number of tweets related to earthquakes.

Figure 3: Correspondence between event detection
from Twitter and object detection in a ubiquitous
environment.

an earthquake and a typhoon. It is apparent that spikes
occur on the number of tweets. Each corresponds to an             Figure 5: Number of tweets related to typhoons.
event occurrence. In the case of an earthquake, more than
10 earthquakes occur during the period. In the case of ty-       alarm is pn
                                                                           f . Therefore, the probability of event occurrence
phoon, Japan’s main population centers were hit by a large       can be estimated as 1 − pn  f . Given n0 sensors at time 0
typhoon (designated as Melor) in October 2009.                   and n0 e−λt sensors at time t. Therefore, the number of
   The distribution is apparently an exponential distribu-       sensors we expect at time t is n0 (1 − e−λ(t+1) )/(1 − e−λ ).
tion. The probability density function of the exponential        Consequently, the probability of an event occurrence at time
distribution is f (t; λ) = λe−λt where t > 0 and λ > 0.          t is
The exponential distribution occurs naturally when describ-                                  n (1−e−λ(t+1) )/(1−e−λ )
                                                                           poccur (t) = 1 − pf 0                        .
ing the lengths of the inter-arrival times in a homogeneous
Poisson process.                                                 We can calculate the probability of event occurrence if we
   In the Twitter case, we can infer that if a user detects an   set λ = 0.34 and pf = 0.35. For example, if we receive n0
event at time 0, assume that the probability of his posting      positive tweets and would like to make an alarm with a false-
a tweet from t to Δt is fixed as λ. Then, the time to make        positive ratio less than 1%, we can calculate the expected
a tweet can be considered as an exponential distribution.        wait time twait to deliver the notification as
Even if a user detects an event, therefore, she might not
                                                                            twait = (1 − (0.1264/n0 ))/0.7117 − 1.
make a tweet right away if she is not online or doing some-
thing. She might make a post only after such problems are          Although many works describing event detection have been
resolved. Therefore, it is reasonable that the distribution      reported in the data mining field, we use this simple ap-
of the number of tweets follows an exponential distribution.     proach utilizing the characteristics of the classifier and the
Actually the data fits very well to an exponential distribu-      distribution.
tion; we get λ = 0.34 with R2 = 0.87onaverage.
   To assess an alarm, we must calculate the reliability of      3.2   Spatial Model
multiple sensor values. For example, a user might make a           Each tweet is associated with a location. We describe how
false alarm by writing a tweet. It is also possible that the     to estimate the location of an event from sensor readings.
classifier misclassifies a tweet into a positive class. We can       To define the problem of location estimation, we consider
design the alarm probabilistically using the following two       the evolution of the state sequence {xt , t ∈ N} of a target,
facts:                                                           given xt = ft (xt−1 , vt−1 ), where ft : Rn     n      n
                                                                                                           t × Rt → Rt is a
                                                                 possibly nonlinear function of the state xt−1 . Furthermore,
   • The false-positive ratio pf of a sensor is approximately    vt−1 is an i.i.d process noise sequence. The objective of
     0.35, as we show in Section 4.1.                            tracking is to estimate xt recursively from measurements
   • Sensors are assumed to be independent and identically       zt = ht (xt , nt ), where ht : Rn      n      n
                                                                                                  t × Rt → Rt is a possibly
     distributed (i.i.d.), as we explain in Section 3.3.         nonlinear function, and where nt is an i.i.d measurement
                                                                 noise sequence. From a Bayesian perspective, the tracking
Assuming that we have n sensors, which produce positive          problem is to calculate recursively some degree of belief in
signals, the probability of all n sensors returning a false-     the state xt at time t, given data zt up to time t.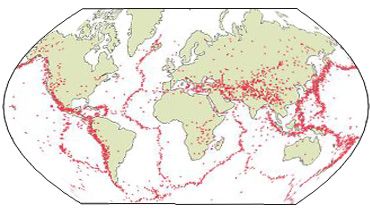
Presuming that p(xt−1 |zt−1 ) is available, theR prediction        Algorithm 1 Particle filter algorithm
stage uses the following equation: p(xt |zt−1 ) = p(xt |xt−1 )           1. Initialization: Calculate the weight distribution Dw (x, y)
p(xt−1 |zt−1 ) dxt−1 . Here we use a Markov process of order                from twitter users geographic distribution in Japan.
one. Therefore, we can assume p(xt |xt−1 , zt−1 ) = p(xt |xt−1 ).        2. Generation: Generate and weight a particle set, which
In update stage, the Bayes’ rule is applied as p(xt |zt ) =                 means N discrete hypothesis.
p(zt |xt )p(xt |zt−1
                   R )/p(zt |zt−1 ), where the normalizing constant
is p(zt |zt−1 ) = p(zt |xt )p(xt |zt−1 )dxt .                                (1) Generate           a           particle     set      S0       =
                                                                                 (s0,0 , s0,1 , s0,2 , . . . , s0,N −1 ) and allocate them on the
   To solve the problem, several methods of Bayesian filters                      map evenly: particle s0,k = (x0,k , y0,k , weight0,k ),
are proposed such as Kalman filters, multi-hypothesis track-                      where x corresponds to the longitude and y corre-
ing, grid-based and topological approaches, and particle fil-                     sponds to the latitude.
ters [7]. For this study, we use Kalman filters and particle                  (2) Weight them based on weight distribution Dw (x, y).
filters, both of which are widely used in location estimation.
                                                                         3. Re-sampling
3.2.1     Kalman Filters                                                     (1) Re-sample N particles from a particle set St using
  The Kalman filter assumes that the posterior density at                         weights of each particles and allocate them on the
every time step is Gaussian and that it is therefore param-                      map. (We allow to re-sample same particles more than
                                                                                 one.)
eterized by a mean and covariance. We can write it as
xt = Ft xt−1 + vt−1 and zt = Ht xt + nt . Therein, Fk and                    (2) Generate a new particle set St+1 and weight them
Hk are known matrices defining the linear functions. The                          based on weight distribution Dw (x, y).
covariants of vk−1 and nk are, respectively, Qt−1 and Rk .               4. Prediction: Predict the next state of a particle set St from
  The Kalman filter algorithm can consequently be viewed                     the Newton’s motion equation.
as the following recursive relation:                                                                                         ax,t−1 2
                                                                                (xt,k , yt,k )   =   (xt−1,k + vx,t−1 Δt +           Δt ,
        p(xt−1 |zt−1 )   =   N (xt−1 ; mt−1|t−1 , Pt−1|t−1 )                                                                     2
                                                                                                                            ay,t−1 2
          p(xt |zt−1 )   =   N (xt ; mt|t−1 , Pt|t−1 )                                               yt−1,k + vy,t−1 Δt +           Δt )
                                                                                                                               2
            p(xt |zt )   =   N (xt ; mt|t , Pt|t )                              (vx,t , vy,t )   =   (vx,t−1 + ax,t−1 , vy,t−1 , ay,t−1 )

where mt|t−1 = Ft mt−1|t−1 , Pt|t−1 = Qt−1 + Ft Pt−1|t−1 FtT ,                             ax,t = N (0; σ 2 ), ay,t = N (0; σ 2 ).
mt|t = mt|t−1 + Kt (zt − Ht mt|t−1 ), and Pt|t = Pt|t−1 −                5. Weighing: Re-calculate the weight of St by measurement
Kt Ht Pt|t−1 , and where N (x; m, P ) is a Gaussian density                 m(mx , my ) as follows.
with argument x, mean m, covariance P , and for which the
following are true: Kt = Pt|t−1 HtT St−1 , and St = Ht Pt|t−1 HtT +          dxk    =    mx − xt,k ,    dyk = my − yt,k
                                                                                                                                                  !
Rt . This is the optimal solution to the tracking problem if                                                   1                 (dx2k + dyk2 )
the assumptions hold. A Kalman filter works better in a                      wt,k    =    Dw (xt,k , yt,k ) · √     · exp     −
                                                                                                            ( 2πσ)                   2σ 2
linear Gaussian environment.
   When utilizing Kalman filters, it is important to construct            6. Measurement: Calculate the current object location
a good model and parameters. In this paper, we implement                    o(xt , yt ) by the average of s(xt , yt ) ∈ St .
models for two cases as follows.
                                                                         7. Iteration: Iterate Step 3, 4, 5 and 6 until convergence.

Case 1: Location estimation of an earthquake center.
In this case, we need not take into consideration the time-
transition property, thus we use only location information            implementing a Bayes filter, and a member of the family
x(dx , dy ). We set xt = (dxt , dyt )t where dxt is the longitude     of sequential Monte Carlo methods. For location estima-
and dyt is the latitude; zt = (dxt , dyt ), F = I2 , H = I2 , and     tion, it maintains a probability distribution for the loca-
ut = 0. We assume that errors of temporal transition do not           tion estimation at time t, designated as the belief Bel(xt ) =
occur, and errors in observation are Gaussian for simplicity:         {xit , wti }, i = 1 . . . n. Each xit is a discrete hypothesis about
Qt = 0, Rt = [σ 2 ], and nt = N (0; Rt ).                             the location of the object. The wti are non-negative weights,
                                                                      called importance factors, which sum to one.
Case 2: Trajectory estimation of a typhoon. We need                      The Sequential Importance Sampling (SIS) algorithm is a
to consider both the location and the velocity of an event.           Monte Carlo method that forms the basis for particle filters.
We apply the Newton’s motion equation as follows: xt =                The SIS algorithm consists of recursive propagation of the
(dxt , dyt , vxt , vyt )t where vxt is the velocity on longitude,     weights and support points as each measurement is received
and vyt is the velocity on latitude. We set zt = (dxt , dyt )t ,      sequentially. We use a more advanced algorithm with re-
        0                      1                                      sampling [1]. We employ weight distribution Dw (x, y) which
             1 0 Δt 0                    „              «
        B 0 1 0 Δt C                        1 0 0 0                   is obtained from twitter user distribution to take into con-
F = @                          A , H =                    , ut =      sideration the biases of user locations8 The alogorithm is
             0 0 1          0               0 1 0 0
             0 0 0          1                                         shown in Algo. 1.
 a           a
( x2t Δt2 , 2yt Δt2 , axt Δt, ayt Δt)t where axt is the accelera-
tion on longitude, and ayt is the acceleration on latitude.           3.3    Information Diffusion related to a Real-
   Similarly as in Case 1, we assume that errors of temporal                 time Event
transition do not occurr, and errors in observation are Gaus-          Some information related to an event diffuses through
sian for simplicity: Qt = 0, Rt = [σ 2 ], and nt = N (0; Rt ).        Twitter. For example, if a user detects an earthquake and
                                                                      8
                                                                        We sample tweets associated with locations and get user
3.2.2     Particle Filters                                            distribution proportional to the number of tweets in each
  A particle filter is a probabilistic approximation algorithm         region.
Figure 6: Earthquake informa- Figure 7: Typhoon information Figure 8: A new Nintendo game
tion diffusion network. diffusion network. information diffusion network.
makes a tweet about the earthquake, a follower of that user Algorithm 2 Event detection and location estimation al-
might make tweets about that. This characteristic is impor- gorithm.
tant because, in our model, sensors might not be indepen- 1. Given a set of queries Q for a target event.
dent each other, which would cause an undesirable effect on
2. Put a query Q using search API every s seconds and obtain
event detection. tweets T .
Figures 6, 7, and 8 respectively portray the information
flow network on earthquake, typhoon, and a new Nintendo 3. For each tweet t ∈ T , obtain features A, B, and C. Apply
the classification to obtain value vt = {0, 1}.
DS game9 . We infer the network as follows: Assume that
user A follows user B. If user B makes a tweet about an 4. Calculate event occurrence probability poccur using vt , t ∈
T ; if it is above the threshold pthre
occur , then proceed to step
event, and soon after that if user A makes a tweet about an
5.
event, then we consider the information flows from B to A10 .
This is the similar definition to other studies of information 5. For each tweet t ∈ T , we obtain the latitude and the lon-
gitude lt by i) utilizing the associated GPS location, ii)
diffusion (e.g., [15, 16]). making a query to Google Map the registered location for
We can understand that, in the case of earthquakes and user ut . Set lt = null if both do not work.
typhoons, very little information diffusion takes place on
6. Calculate the estimated location of the event from lt , t ∈ T
Twitter. On the other hand, the release of a new game using Kalman filtering or particle filtering.
illustrates the scale and rapidity of information diffusion.
Therefore, we can assume that the sensors are i.i.d. when 7. (optionally) Send alert e-mails to registered users.
considering real-time event detection such as typhoons and
earthquakes.
For classification of tweets, we prepared 597 positive ex-
4. EXPERIMENTS AND EVALUATION amples which report earthquake occurrence as a training set.
The classification performance is presented in Table 112 . We
In this section, we describe the experimental results and use two query words—earthquake and shaking; performances
evaluation of tweet classification and location estimation. using either query are shown. We used a linear kernel for
The whole algorithm is shown in Algo. 2. We prepare a SVM. We obtain the highest F -value when we use feature
set of queries Q for an target event. We first search for tweets A and all features. Surprisingly, feature B and feature C
T including the query set Q from Twitter every s seconds. do not contribute much to the classification performance.
We use a search API11 to search tweets. In the earthquake When an earthquake occurs, a user becomes surprised and
case, we set Q = {”earthquake” and ”shaking”} and in the might produce a very short tweet. It is apparent that the
typhoon case, we set Q = {”typhoon”}. We set s as 3 s. recall is not so high as precision. It is attributable to the
After determining a classification and obtaining a positive usage of query words in a different context than we intend.
example, the system makes a calculation of a temporal and Sometimes it is difficult even for humans to judge whether
spatial probabilistic model. We consider that an event is a tweet is reporting an actual earthquake or not. Some ex-
detected if the probability is higher than a certain threshold amples are that a user might write ”Is this an earthquake or
(poccur (t) > 0.95 in our case). The location information of a truck passing?” Overall, the classification performance is
each tweet is obtained and used for location estimation of good considering that we can use multiple sensor readings
the event. In the earthquake reporting system explained in as evidence for event detection.
the next section, the system quickly sends an e-mail (usually
mobile e-mail) to registered users. 4.2 Evaluation of Spatial Estimation
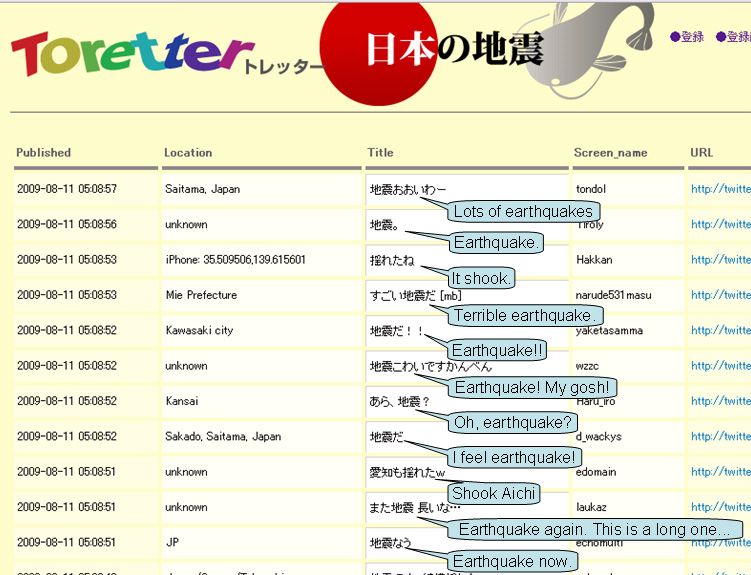
Figure 9 presents the location estimation of an earthquake
4.1 Evaluation by Semantic Analysis on August 11. We can find that many tweets originate from
a wide region in Japan. The estimated location of the earth-
9
Love Plus, a game that offers a virtual girlfriend experience, quake (shown as estimation by particle filter) is close to the
which was recently released in September 3, 2009. actual center of the earthquake, which shows the efficiency
10
Because of this definition, the diffusion includes retweet, of the location estimation algorithm. Table 2 presents re-
which is a type of message that repeats some information
that was previously tweeted by another user. 12
We do not show the result for the typhoon case because of
11
search.twitter.com space limitations.Table 1: Performance of classification.
(i) earthquake query:
Features Recall Precision F -value
A 87.50% 63.64% 73.69%
B 87.50% 38.89% 53.85%
C 50.00% 66.67% 57.14%
All 87.50 % 63.64% 73.69%
(ii) shaking query:
Features Recall Precision F -value
A 66.67% 68.57% 67.61%
B 86.11% 57.41% 68.89%
C 52.78% 86.36% 68.20%
All 80.56 % 65.91% 72.50%
Figure 10: Typhoon trajectory estimation based on
tweets.
more valuable if given in real time. We can turn off a stove
or heater in our house and hide ourselves under a desk or
table if we have several seconds before an earthquake actu-
ally hits. Several Twitter accounts report earthquake occur-
rence. Some examples are that the United States Geological
Survey (USGS) feeds tweets on world earthquake informa-
tion, but it is not useful for prediction or early warning.
Vast amounts of work have been done on intermediate-
term earthquake prediction in the seismology field (e.g. [23]).
Various attempts have also been made to produce short-
term forecasts to realize an earthquake warning system by
observing electromagnetic emissions from ground-based sen-
Figure 9: Earthquake location estimation based on sors and satellites [3]. Other precursor signals such as iono-
tweets. Balloons show the tweets on the earthquake. spheric changes, infrared luminescence, and air-conductivity
The cross shows the earthquake center. Red repre- change, along with traditional monitoring of movements of
sents early tweets; blue represents later tweets. the earth’s crust, are investigated.
In Japan, the government has allocated a considerable
sults of location estimation for 25 earthquakes in August, amount of its budget to mitigating earthquake damage. An
September, and October 2009. We compare Kalman filter- earthquake early warning service has been operated by JMA
ing and particle filtering, with the weighted average and the since 2007. It provides advance announcements of the es-
median as a baseline. The weighted average simply takes the timated seismic intensities and expected arrival times. It
average of latitudes and longitude on all the positive tweets, detects P-waves (primary waves) and makes an alert imme-
and median simply takes the median of them. Particle filters diately so that earthquake damage can be mitigated through
perform well compared to other methods. The poor perfor- countermeasures such as slowing trains and controlling el-
mance of Kalman filtering implies that the linear Gaussian evators. In fact, P-waves are a type of elastic wave that
assumption does not hold for this problem. We can find can travel faster than the S-waves (secondary waves), which
that if the center of the earthquake is in the sea area, it is cause shear effects and engender much more damage.
more difficult to locate it precisely from tweets. Similarly, The proposed system, called Toretter13 , has been operated
it becomes more difficult to make good estimations in less- since August 8 of this year. A system screenshot is depicted
populated areas. That is reasonable: all other things being in Fig. 11. Users can see the detection of past earthquakes.
equal, the greater the number of sensors, the more precise They can register their e-mails to receive notices of future
the estimation will be. earthquake detection reports. A sample e-mail is presented
Figure 10 is the trajectory estimation of typhoon Melor in Fig. 12. It alerts users and urges them to prepare for
based on tweets. In the case of an earthquake, the center the earthquake. It is hoped that the e-mail is received by
is one location. However, in the case of a typhoon, the a user shortly before the earthquake actually arrives. An
center moves and makes a trajectory. The comparison of earthquake is transmitted through the earth’s crust at about
the performance is shown in Table 3. The particle filter 3–7 km/s. Therefore, a person has about 20 s before its
works well and outputs a similar trajectory to the actual arrival at a point that is 100 km distant.
trajectory. Table 4 presents some facts about earthquake detection
and notification using our system. This table shows that we
investigated 10 earthquakes during 18 August – 2 Septem-
5. EARTHQUAKE REPORTING SYSTEM ber, all of which our system detected. The first tweet of
We developed an earthquake reporting system using the
13
event detection algorithm. Earthquake information is much It means ”we have taken it” in Japanese.Table 2: Location estimation accuracy of earthquakes from tweets. For each method, we show the difference
of the estimated latitude and the longitude to the actual ones, and the Euclid distance of them. Smaller
distance means better performance.
Date Actual center Median (baseline) Weighted ave. (baseline) Kalman filters Particle filters
lat. long. lat. long. dist. lat. long. dist. lat. long. dist. lat. long. dist.
Aug. 10 01:00 33.10 138.50 3.40 -0.80 3.49 2.70 -0.10 2.70 2.67 -0.50 2.72 2.60 0.50 2.65
Aug. 11 05:00 34.80 138.50 0.90 -0.90 1.27 0.70 -0.30 0.76 0.60 -0.20 0.63 0.30 -0.90 0.95
Aug. 13 07:50 33.00 140.80 1.30 -9.60 9.69 2.30 -2.30 3.25 1.63 -3.75 4.09 2.70 -2.70 3.82
Aug. 17 20:40 33.70 130.20 4.60 6.00 7.56 0.90 3.20 3.32 1.63 4.35 4.65 0.10 -0.80 0.81
Aug. 18 22:17 23.30 123.50 7.80 9.90 12.60 8.70 10.90 13.95 8.32 10.13 13.11 5.60 8.10 9.85
Aug. 21 08.51 35.70 140.00 0.50 -4.40 4.43 0.10 -1.00 1.00 0.00 -0.60 0.60 -0.80 0.48 0.93
Aug. 24 13:30 37.50 138.60 -0.40 0.00 0.40 -0.50 0.40 0.64 -0.50 0.30 0.58 2.40 0.70 2.50
Aug. 24 14:40 41.10 140.30 -1.90 1.10 2.20 -1.30 0.50 1.39 -1.50 0.50 1.58 3.10 2.00 3.69
Aug. 25 02:22 42.10 142.80 -2.90 -3.90 4.86 -6.10 -3.80 7.19 -5.20 -3.70 6.38 -1.80 -1.90 2.62
Aug. 25 20:19 35.40 140.40 1.60 -1.80 2.41 2.20 -0.70 2.31 0.70 -1.60 1.75 1.40 0.10 1.40
Aug. 31 00:46 37.20 141.50 -0.40 -3.60 3.62 -1.10 -2.30 2.55 -1.30 -2.20 2.56 -0.30 -0.30 0.42
Aug. 31 21:11 33.40 130.90 -4.50 -3.60 5.76 0.50 2.10 2.16 0.70 1.90 2.02 -0.20 -1.70 1.71
Sep. 3 22:26 31.10 130.30 6.20 -0.10 6.20 4.00 5.00 6.40 4.90 7.20 8.71 2.40 2.10 3.19
Sep. 4 11:30 35.80 140.10 3.10 -1.70 3.54 0.20 -0.90 0.92 0.00 -1.00 1.00 0.80 1.40 1.61
Sep. 05 10:59 37.00 140.20 -2.70 -8.30 8.73 -1.40 -3.10 3.40 -1.30 -3.30 3.55 -2.10 -5.80 6.17
Sep. 08 01:24 42.20 143.00 -3.60 -8.90 9.60 -2.50 -3.90 4.63 -4.50 -6.00 7.50 1.30 -3.60 3.83
Sep. 10 18:29 43.20 146.20 -5.90 -10.20 11.78 -4.90 -7.10 8.63 -4.50 -7.20 8.49 -0.90 -7.00 7.06
Sep. 16 21:38 33.40 130.90 1.10 -0.20 1.12 0.90 2.10 2.28 0.50 1.40 1.49 -0.20 -2.50 2.51
Sep. 22 20:40 47.60 141.70 -11.10 -7.50 13.40 -10.80 -3.10 11.24 -11.30 -3.80 11.92 -7.80 -3.00 8.36
Oct. 1 19:43 36.40 140.70 0.70 -3.80 3.86 -0.60 -1.80 1.90 -0.30 -1.50 1.53 -0.70 0.30 0.76
Oct. 5 09:35 42.40 141.60 -3.70 -3.10 4.83 -2.70 -2.00 3.36 -2.60 -1.60 3.05 1.10 -1.70 2.02
Oct. 6 07:49 35.90 137.60 0.50 1.20 1.30 -0.20 0.80 0.82 -0.10 0.90 0.91 0.30 0.50 0.58
Oct. 10 17:43 41.80 142.20 -3.50 -5.40 6.44 -1.40 -2.10 2.52 -2.20 -2.60 3.41 2.40 -1.30 2.73
Oct. 12 16:10 35.90 137.60 2.80 0.50 2.84 0.80 1.20 1.44 0.80 1.60 1.79 3.60 1.40 3.86
Oct. 12 18:42 37.40 139.70 -2.00 -4.40 4.83 -1.50 -0.90 1.75 -1.70 -1.40 2.20 -1.00 -0.60 1.17
Average distance 5.47 3.62 3.85 3.01
Table 3: Trajectory estimation accuracy of typhoon Melor from tweets.
Date Location Median (baseline) Weighted ave. (baseline) Kalman filters Particle filters
lat. long. lat. long. dist. lat. long. dist. lat. long. dist. lat. long. dist.
Oct. 7 12:00 29.00 131.80 -1.90 -1.90 2.69 -5.20 -3.60 6.32 -3.90 -1.10 4.05 -4.70 1.10 4.83
Oct. 7 15:00 29.90 132.50 -3.70 -2.60 4.52 -3.80 -2.40 4.49 3.20 3.10 4.46 -2.70 0.90 2.85
Oct. 7 18:00 30.80 133.20 -4.10 -1.90 4.52 -4.40 -3.50 5.62 -6.40 5.40 8.37 -3.20 -0.70 3.28
Oct. 7 21:00 31.60 134.30 -3.90 -3.50 5.24 -3.60 -3.30 4.88 -10.90 -1.60 11.02 -3.70 -0.50 3.73
Oct. 8 0:00 32.90 135.60 -2.30 -0.10 2.30 -2.30 -0.90 2.47 -12.60 -20.40 23.98 -2.90 -3.50 4.55
Oct. 8 6:00 35.10 137.20 1.60 3.00 3.40 0.80 1.70 1.88 4.20 16.00 16.54 -0.60 -2.50 2.57
Oct. 8 9:00 36.10 138.80 -0.60 3.60 3.65 0.00 0.50 0.50 0.50 2.60 2.65 0.70 -0.80 1.06
Oct. 8 12:00 37.10 139.70 1.70 3.90 4.25 1.50 1.20 1.92 2.10 1.60 2.64 1.40 0.10 1.40
Oct. 8 15:00 38.00 140.90 2.30 3.20 3.94 2.40 2.20 3.26 1.70 7.60 7.79 2.40 2.70 3.61
Oct. 8 18:00 39.00 142.30 3.20 7.30 7.97 3.50 5.10 6.19 2.10 -18.80 18.92 3.70 5.10 6.30
Oct. 8 21:00 40.00 143.60 4.30 3.90 5.81 4.00 5.30 6.64 1.60 4.50 4.78 4.20 3.10 5.22
Average distance 4.39 4.02 9.56 3.58
occurs. Statistically, we detected 96% of earthquakes larger
Table 5: Earthquake detection performance for two than JMA seismic intensity scale15 3 or more as shown in
months from August 2009. Table 5.
JMA intensity scale 2 or more 3 or more 4 or more
Num. of earthquakes 78 25 3
Detected 70(89.7%) 24 (96.0%) 3 (100.0%) 6. RELATED WORK
Promptly detected14 53 (67.9%) 20 (80.0%) 3 (100.0%) Twitter is an interesting example of the most recent social
media: numerous studies have investigated Twitter. Aside
from the studies introduced in Section 1, several others have
been done. Grosseck et al. investigated indicators such
an earthquake is usually made within a minute or so. The as the influence and trust related to Twitter [8]. Krish-
delay can result from the time for posting a tweet by a user, namurthy et al. crawled nearly 100,000 Twitter users and
the time to index the post in Twitter servers, and the time examined the number of users each user follows, in addi-
to make queries by our system. We apply classification for tion to the number of users following them. Naaman et al.
49,314 tweets retrieved by query words in one month; re- analyzed contents of messages from more than 350 Twitter
sults show 6,291 positive tweets posted by 4,218 users. Ev-
15
ery earthquake elicited more than 10 tweets within 10 min, The JMA seismic intensity scale is a measure used in Japan
except one in Bungo-suido, which is the sea between two and Taiwan to indicate earthquake strength. Unlike the
large islands: Kyushu and Shikoku. Our system sent e-mails Richter magnitude scale, the JMA scale describes the degree
mostly within a minute, sometimes within 20 s. The delivery of shaking at a point on the earth’s surface. For example,
the JMA scale 3 is, by definition, one which is ”felt by most
time is far faster than the rapid broadcast of announcement people in the building. Some people are frightened”. It is
of JMA, which are widely broadcast on TV; on average, a similar to the Modified Mercalli scale IV, which is used along
JMA announcement is broadcast 6 min after an earthquake with the Richter scale in the US.Table 4: Facts about earthquake detection.
Date Magnitude Location Time E-mail sent time #tweets within 10 min Announce of JMA
Aug. 18 4.5 Tochigi 6:58:55 7:00:30 35 07:08
Aug. 18 3.1 Suruga-wan 19:22:48 19:23:14 17 19:28
Aug. 21 4.1 Chiba 8:51:16 8:51:35 52 8:56
Aug. 25 4.3 Uraga-oki 2:22:49 2:23:21 23 02:27
Aug. 25 3.5 Fukushima 22:21:16 22:22:29 13 22:26
Aug. 27 3.9 Wakayama 17:47:30 17:48:11 16 17:53
Aug. 27 2.8 Suruga-wan 20:26:23 20:26:45 14 20:31
Aug. 31 4.5 Fukushima 00:45:54 00:46:24 32 00:51
Sep. 2 3.3 Suruga-wan 13:04:45 13:05:04 18 13:10
Sep. 2 3.6 Bungo-suido 17:37:53 17:38:27 3 17:43
sification of tweets might be done similarly to our algorithm.
Web2express Digest17 is a website that auto-discovers infor-
mation from Twitter streaming data to find real-time inter-
esting conversations. It also uses natural language process-
ing and sentiment analysis to discover interesting topics, as
we do in our study.
Various studies have been made of the analysis of web
data (except for Twitter) particularly addressing the spatial
aspect: The most relevant study to ours is one by Back-
strom et al. [2]. They use queries with location (obtained
by IP addresses), and develop a probabilistic framework for
quantifying spatial variation. The model is based on a de-
composition of the surface of the earth into small grid cells;
they assume that for each grid cell x, there is a probabil-
ity px that a random search from this cell will be equal
to the query under consideration. The framework finds a
query’s geographic center and spatial dispersion. Exam-
ples include baseball teams, newspapers, universities, and
typhoons. Although the motivation is very similar, events
Figure 11: Screenshot of Toretter, an earthquake to be detected differ. Some examples are that people might
reporting system. not make a search query earthquake when they experience
an earthquake. Therefore, our approach complements their
work. Similarly to our work, Mei et al. targeted blogs and
Dear Alice,
analyzed their spatiotemporal patterns [17]. They presented
We have just detected an earthquake examples for Hurricane Katrina, Hurricane Rita, and iPod
around Chiba. Please take care. Nano. The motivation of that study is similar to ours, but
Twitter data are more time-sensitive; our study examines
Toretter Alert System even more time-critical events e.g. earthquakes.
Some works have targeted collaborative bookmarking data,
Figure 12: Sample alert e-mail. as Flickr does, from a spatiotemporal perspective: Serdyukov
et al. investigated generic methods for placing photographs
on Flickr on the world map [24]. They used a language
users and manually classified messages into nine categories model to place photos, and showed that they can effectively
[19]. The numerous categories are ”Me now” and ”State- estimate the language model through analyses of annota-
ments and Random Thoughts”; statements about current tions by users. Rattenbury et al. [22] specifically examined
events corresponding to this category. the problem of extracting place and event semantics for tags
Some studies attempt to show applications of Twitter: that are assigned to photographs on Flickr. They proposed
Borau et al. tried to use Twitter to teach English to English- scale-structure identification, which is a burst-detection method
language learners [4]. Ebner et al. investigated the ap- based on scaled spatial and temporal segments.
plicability of Twitter for educational purposes, i.e. mobile Location estimation studies are often done in the field of
learning [6]. The integration of the Semantic Web and mi- ubiquitous computing. Estimating an object’s location is
croblogging was described in a previous study [20] in which arguably the most fundamental sensing task in many ubiq-
a distributed architecture is proposed and the contents are uitous and pervasive computing scenarios. Representing lo-
aggregated. Jensen et al. analyzed more than 150 thousand cations statistically enables a unified interface for location
tweets, particularly those mentioning brands in corporate information, which enables us to make applications indepen-
accounts [12]. dent of the sensors used — even when using very different
In contrast to the small number of academic studies of sensor types, such as GPS and infrared badges [7], or even
Twitter, many Twitter applications exist. Some are used Twitter. Well known algorithms for location estimation are
for analyses of Twitter data. For example, Tweettronics 16 Kalman filters, multihypothesis tracking, grid-based, and
provides an analysis of tweets related to brands and prod- topological approaches, and particle filters. Hightower and
ucts for marketing purposes. It can classify positive and Borriello made a study of applying particle filters to location
negative tweets, and can identify influential users. The clas- sensors deployed throughout a lab building [10]. More than
16 17
http://www.tweettronics.com http://web2express.org30 lab residents were tracked; their locations were estimated [6] M. Ebner and M. Schiefner. In microblogging.more
accurately using the particle filter approach. than fun? In Proc. IADIS Mobile Learning
Conference, 2008.
[7] D. Fox, J. Hightower, L. Liao, D. Schulz, and
7. DISCUSSION G. Borriello. Bayesian filters for location estimation.
We plan to expand our system to detect events of various IEEE Pervasive Computing, 2003.
kinds using Twitter. We developed another prototype that [8] G. Grosseck and C. Holotescu. Analysis indicators for
detects rainbow information. A rainbow might be visible communities on microblogging platforms. In Proc.
somewhere in the world; someone might be twittering about eLSE Conference, 2009.
a rainbow. Our system can identify rainbow tweets using
[9] J. Hightower and G. Borriello. Location systems for
a similar approach to that used for detecting earthquakes.
ubiquitous computing. IEEE Computer, 34(8):57–66,
The differences are that in the rainbow case, the information
August 2001.
is not so time-sensitive as that in the earthquake case.
Our model includes the assumption that a single instance [10] J. Hightower and G. Borriello. Particle filters for
of the target event exists. For example, we assume that we location estimation in ubiquitous computing: A case
do not have two or more earthquakes or typhoons simulta- study. In Proc. UbiComp04, 2004.
neously. Although the assumption is reasonable for these [11] B. Huberman and D. R. F. Wu. Social networks that
cases, it might not hold for other events such as traffic jams, matter: Twitter under the microscope. First Monday,
accidents, and rainbows. To realize multiple event detec- 14, 2009.
tion, we must produce advanced probabilistic models that [12] B. Jansen, M. Zhang, K. Sobel, and A. Chowdury.
allow hypotheses of multiple event occurrences. Twitter power:tweets as electronic word of mouth.
A search query is important to search possibly-relevant Journal of the American Society for Information
tweets. For example, we set a query term as earthquake Science and Technology, 2009.
and shaking because most tweets mentioning an earthquake [13] A. Java, X. Song, T. Finin, and B. Tseng. Why we
occurrence use either word. However, to improve the recall, twitter: Understanding microblogging usage and
it is necessary to obtain a good set of queries. We can use communities. In Proc. Joint 9th WEBKDD and 1st
advanced algorithms for query expansion, which is a subject SNA-KDD Workshop 2007, 2007.
of our future work. [14] T. Joachims. Text categorization with support vector
machines. In Proc. ECML’98, pages 137–142, 1998.
[15] J. Leskovec, L. Adamic, and B. Huberman. The
8. CONCLUSION dynamics of viral marketing. In Proc. ACM
As described in this paper, we investigated the real-time Conference on Electronic Commerce, 2006.
nature of Twitter, in particular for event detection. Seman- [16] Y. Matsuo and H. Yamamoto. Community gravity:
tic analyses were applied to tweets to classify them into a measuring bidirectional effects by trust and rating on
positive and a negative class. We consider each Twitter user online social networks. In Proc. WWW2009, 2009.
as a sensor, and set a problem to detect an event based on [17] Q. Mei, C. Liu, H. Su, and C. Zhai. A probabilistic
sensory observations. Location estimation methods such as approach to spatiotemporal theme pattern mining on
Kalman filtering and particle filtering are used to estimate weblogs. In Proc. WWW’06, 2006.
the locations of events. As an application, we developed an
[18] S. Milstein, A. Chowdhury, G. Hochmuth, B. Lorica,
earthquake reporting system, which is a novel approach to
and R. Magoulas. Twitter and the micro-messaging
notify people promptly of an earthquake event.
revolution: Communication,connections, and
Microblogging has real-time characteristics that distin-
immediacy.140 characters at a time. O’Reilly Media,
guish it from other social media such as blogs and collabo-
2008.
rative bookmarks. In this paper, we presented an example
using the real-time nature of Twitter. It is hoped that this [19] M. Naaman, J. Boase, and C. Lai. Is it really about
paper provides some insight into the future integration of me? Message content in social awareness streams. In
semantic analysis with microblogging data. Proc. CSCW’09, 2009.
[20] A. Passant, T. Hastrup, U. Bojars, and J. Breslin.
Microblogging: A semantic and distributed approach.
9. REFERENCES In Proc. SFSW2008, 2008.
[1] S. Arulampalam, S. Maskell, N. Gordon, and [21] Y. Raimond and S. Abdallah. The event ontology,
T. Clapp. A tutorial on particle filters for on-line 2007. http://motools.sf.net/event/event.html.
non-linear/non-gaussian bayesian tracking. IEEE [22] T. Rattenbury, N. Good, and M. Naaman. Towards
Transactions on Signal Processing, 2001. automatic extraction of event and place semantics
[2] L. Backstrom, J. Kleinberg, R. Kumar, and J. Novak. from flickr tags. In Proc. SIGIR 2007, 2007.
Spatial variation in search engine queries. In Proc. [23] E. Scordilis, C. Papazachos, G. Karakaisis, and
WWW2008, 2008. V. Karakostas. Accelerating sesmic crustal
[3] T. Bleier and F. Freund. Earthquake warning system. deformation before strong mainshocks in adriatic and
Spectrum, IEEE, 2005. its importance for earthquake prediction. Journal of
[4] K. Borau, C. Ullrich, J. Feng, and R. Shen. Seismology, 8, 2004.
Microblogging for language learning: Using twitter to [24] P. Serdyukov, V. Murdock, and R. van Zwol. Placing
train communicative and cultural competence. In flickr photos on a map. In Proc. SIGIR 2009, 2009.
Proc. ICWL 2009, pages 78–87, 2009. [25] M. Weiser. The computer for the twenty-first century.
[5] d. boyd, S. Golder, and G. Lotan. Tweet, tweet, Scientific American, 268(3):94–104, 1991.
retweet: Conversational aspects of retweeting on
twitter. In Proc. HICSS-43, 2010.You can also read