VIVA-uOttawa / CBSA at TRECVID 2012: Interactive Surveillance Event Detection
←
→
Page content transcription
If your browser does not render page correctly, please read the page content below
VIVA-uOttawa / CBSA at TRECVID 2012:
                                  Interactive Surveillance Event Detection ∗

                              Chris Whiten, Robert Laganière, Ehsan Fazl-Ersi, Feng Shi
                                                VIVA Research Lab
                                       University of Ottawa, Ottawa, Canada
                                        {cwhit025, laganier, efazlers}@uottawa.ca

                                              Guillaume-Alexandre Bilodeau
                                                       LITIV Lab
                                   École Polytechnique de Montréal, Montréal, Canada
                                         guillaume-alexandre.bilodeau@polymtl.ca

                Dmitry O. Gorodnichy, Jean-Philippe Bergeron, Ehren Choy, David Bissessar
               Video Surveillance and Biometrics Section, Science and Engineering Directorate
                              Canada Border Services Agency, Ottawa, Canada

                            Abstract                                    1. Introduction
                                                                        1.1. Operational need
    We present an interactive video event detection system
for the TRECVID 2012 Surveillance Event Detection (SED)                    As a result of the increasingly growing demand for se-
task [16]. Inspired by previous TRECVID submissions, the                curity, many countries have been deploying video surveil-
underlying approach is built on combining automated de-                 lance (CCTV) systems as an important tool for enhanc-
tection of temporal regions of interest through the extrac-             ing preventive measures and aiding post-incident investiga-
tion of binary spatio-temporal keypoint descriptors in ob-              tions. Within the Canadian government, many federal de-
served video-sequences (Video Analytics module), and effi-              partments heavily use CCTV systems, including the Canada
cient manual filtering of false alarms through the use of a             Border Services Agency (CBSA) who sees video surveil-
custom-designed graphical user interface (Visual Analytics              lance as a key technological element in protecting the coun-
module). We make the automated detection of temporal re-                try’s borders as well as in facilitation of travel of legitimate
gions of interest feasible by using efficient binary feature de-        people and goods through the border.
scriptors. These descriptors allow for descriptor matching                  When deployed, CCTV systems are used in either of two
in the bag-of-words model to be orders of magnitude faster              modes of operation: a) Live mode (or real-time monitor-
than traditional descriptors, such as SIFT and optical flow.            ing), and b) Archival mode (or post-event analysis through
The approach is evaluated on a single task, PersonRuns, as              recordings). While evaluating the utility of these systems, it
defined by the TRECVID 2012 guidelines. The combination                 has been realized that currently deployed surveillance sys-
of Visual Analytics and Video Analytics tools is shown to be            tems are not fully efficient for either modes of operation.
essential for the success of a highly challenging task of de-           In the real-time monitoring mode, the problem is that an
tecting events of interest in unstructured environments using           event may easily pass unnoticed due to false or simultane-
video surveillance cameras.                                             ous alarms and a lack of time required to rewind and analyze
                                                                        all potentially useful video streams. In archival mode, video
                                                                        data storage and manageability is the problem that compli-
                                                                        cates the efficiency of post-incident investigation the most.
  ∗ This
                                                                        Due to the temporal nature of video data, it may take very
         work is done within the CBSA-led PSTP BTS-402 project
PROVE-IT(VA) funded by the Defence Research and Development
                                                                        long for a human to analyze it. A way to resolve these prob-
Canada (DRDC) Public Security Technical Program (PSTP). Project lead:   lems is seen in designing automated video analytic tools,
Dmitry Gorodnichy (email: Dmitry.Gorodnichy@cbsa-asfc.gc.ca).           which would help a security or investigation officer to do the
highlights an important dual computer-human nature of the
                                                                       solution defining its two main components: one – executed
                                                                       by a computer, which uses significant machine power and
                                                                       time to search for events of interest in a long video sequence
                                                                       in order to extract the clips corresponding to potential events
                                                                       of interest (Nm ), possibly along with their associated meta-
                                                                       data; and the other – executed by a human, who further pro-
                                                                       cesses the data obtained by a computer in order to detect the
                                                                       true events (Nh ) within a given amount of time (Lh ).
                                                                          In particular, it is realized that, regardless of the qual-
                                                                       ity of a video recognition (Video Analytics) algorithm, it
                                                                       will not be able to robustly detect events of interest with-
                                                                       out generating false alarms, the number of which can be
                                                                       very large in unstructured surveillance environments, such
                                                                       as those used in the SED task.
                                                                          Therefore our solution is sought in combining Video An-
                                                                       alytics advances with the recent advances in Visual An-
                                                                       alytics, the science of using human’s visual recognition
                                                                       power for efficient processing of data through the design
                                                                       of problem-tailored graphical user interfaces. In this way,
                                                                       the number of machine-generated alarms Nm , which would
                                                                       take otherwise `m minutes to view, can be further reduced
                                                                       to Nh alarms which can be viewed Lh minutes.
          Data             length (L)            # events (N)             Specific to the TRECVID 2012 SED task and the results
     original video       Lg=15hours        Ng =107 (ground truth)     we obtained (see Figure 1), with the use of our Visual An-
 detected by computer    Lm =2016*2secs      Nm =2016 (TP+FP)          alytic interface we are able to detect Nh = 15 events in
  detected by human       Lh =25mins            Nh =15 (6+9)
                                                                       Lh = 25 minutes from the Nm =2016 suspected events de-
Figure 1. Formalization of the video analysis problem: Given
`g minutes of video footage, which contains Ng events (ground
                                                                       tected by our Video Analytics algorithm, the total length of
truth), the objective is to design such Video Analytics software and   which is Lm = 2012 ∗ 2 seconds (each event is extracted
such Visual Analytics interface that would allow a human opera-        as 2 sec clip). While machine detected events Nm consist
tor to detect the maximum number of events Nh in not more than         of both true and false positives, with the majority (over esti-
Ln minutes (operational contraint). The table shows the length of      mated 95%) being false positives, the human detected event
video data and the number of events used/obtained/estimated in         Nh should 1 predominantly be true positives.
the current SED task: of original video data, data detected using
Video Analytics (by computer) only, and data detected using both       1.3. Previous work
Video Analytics and Visual Analytics (by human).
                                                                           There has been an extensive amount of research in event
                                                                       detection that is applicable to surveillance environments.
                                                                       Laptev et al. [14] use 3-dimensional Harris corners as a
work more efficiently [11]. The design of such a tool tested           spatiotemporal feature detector, where the third dimension
on TRECVID SED video-sequences captured at Gatwick                     is time. An image patch is deemed to be a keypoint when
airport from HomeOffice iLids dataset is presented in this             sufficient change is present in both spatial dimensions and
paper.                                                                 the temporal dimension. This method generally detects
                                                                       keypoints with a strong reversal in the motion direction,
1.2. Formalization of the problem
                                                                       which returns very few keypoints in many domains. Dol-
   The TRECVID 2012 Surveillance Event Detection                       lar et al. [6] propose a method using Gabor filters in the
(SED) task can be formalized as as follows (see Figure                 temporal domain that tends to return many more keypoints,
1). Given Lg minutes of video footage, which contains Ng               by evoking a strong response when varying image intensi-
events (ground truth), the objective is to design such a tech-         ties contain periodic frequency components. Gilbert et al.
nology that would allow a human analyst to detect the max-
                                                                           1 As presented in later sections, this is not always true, as in our ex-
imum number of events Nh within Lh minutes.
                                                                       periments only 6 of our Nh = 15 manually detected events appeared to
   Such a presentation very well represents the actual op-             be true, with 9 of them being false, which is likely attributed to the fact
erational constraint of many agencies, which is the limited            that the length we chose for extracted clips (2secs) was not large enough
time / human resources available to process the data. It also          to distinguish fast walk from running (especially that of children).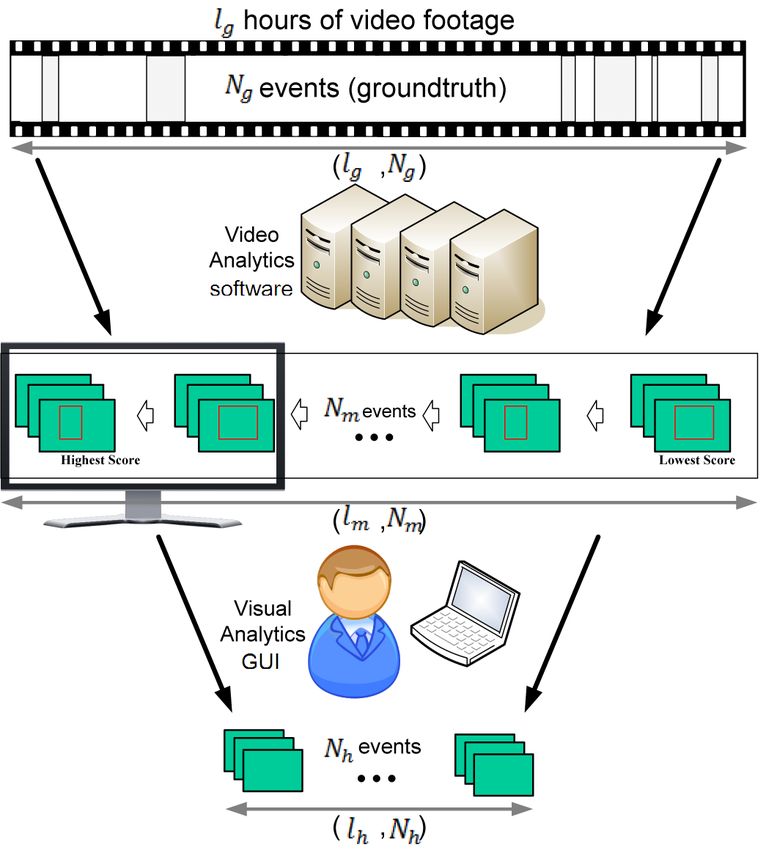
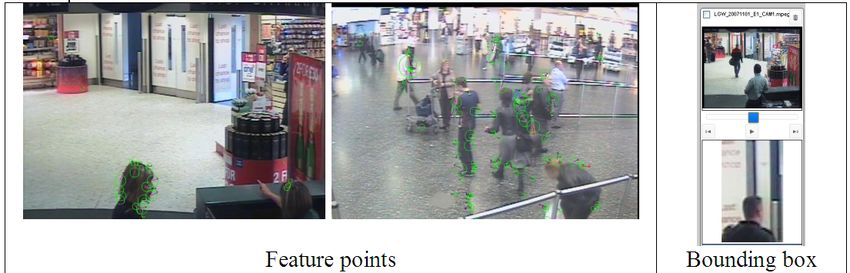
Figure 2. The flow of our event detection system. A pair of frames five (5) frames apart are joined to create an image encoding both motion
and appearance. This new image is used in a bag-of-words model to transform keypoint descriptors into SVM features, which are then
used to compute the likelihood of an event occurring at that frame.

[9] also extend 2-dimensional features into 3 dimensions.               cussion in Section 5.
This is achieved by partitioning the 3D space into 3 chan-
nels, (x, y), (x, t), and (y, t) and densely computing Har-             2. Automated detection of events using Video
ris corners across these spaces. A 3 digit code is created                  Analytics
for each corner, corresponding to its scale, which channel
it was computed on, and its orientation. The APriori algo-              2.1. Approach
rithm is used to mine frequently occurring sets of corners
based on this 3-digit code, yielding discriminative features                Our implementation is an incremental process that can
for classification. While they have reported accurate perfor-           be visualized in Figure 2. We first compute an interme-
mance, dense sampling is extremely space and time costly                diate image representation by the absolute pairwise differ-
on a dataset as large as the TRECVID corpus. MoSIFT                     ence frame between two video frames five frames apart.
is a spatio-temporal keypoint descriptor for action recogni-            From this difference frame, we extract several binary spatio-
tion, proposed by Chen et al. [19]. Rather than simply ex-              temporal keypoint descriptors and a bag of words model
tending a two-dimensional keypoint into three dimensions,               is used to assign descriptors from a temporal sequence to
as was done in [14], MoSIFT is an amalgamation of two                   visual words from a precomputed codebook. Finally, this
separate two-dimensional descriptors, SIFT [15] and opti-               bag of words representation is passed as a feature to a pre-
cal flow. SIFT is used to detect keypoints in the spatial di-           trained support vector machine (SVM), yielding a single
mension, while the magnitude of the optical flow defines                SVM response. Over time, these responses yield an SVM
whether there is sufficient motion at those spatial locations           response distribution and sufficiently large local maxima
to be used as spatio-temporal keypoints. If there is sufficient         within that distribution are deemed to be positive events.
motion, the optical flow descriptor is appended to the SIFT
                                                                        2.2. Extracting binary spatio-temporal descriptors
descriptor to create a descriptor consisting of 256 floating
point values. Using MoSIFT for event detection has seen                    An appearance model that does not sufficiently capture
success in recent TRECVID proceedings [4, 8, 7]]. Despite               the discriminative features of an event will fail to provide
its reported success, MoSIFT remains prohibitively slow for             the classifier with sufficient detail to accurately detect that
processing ongoing streams of video data.                               event in a query video sequence. Furthermore, in a video
    To this date, no perfect solution has been realized for             sequence it is not only the local appearance that is of impor-
the SED task. There does not yet exist an algorithm which               tance, the motion model may be equally important. These
yields an exact number of true positive responses and no                models have been thoroughly studied in the computer vi-
false positives. However, implementing recently proposed                sion literature, and many have been successfully applied at
efficient algorithms as a tool to reduce the computational              TRECVID. MoSIFT is a successful appearance and mo-
load for a human surveillance agent is a very conceivable               tion model that has been applied in previous iterations of
task.                                                                   TRECVID [19]. MoSIFT defines a 256 dimensional feature
    In the following section, we present an overview of our             vector consisting of 128 floating point values for the local
approach to automated event detection. Following that, in               appearance, via SIFT [15], and 128 floating point values for
Section 2 we describe an implementation that makes use                  the motion, via optical flow. While this descriptor has been
of our approach to assist human surveillance agents in ef-              used to achieve state of the art performance at TRECVID,
ficiently locating pre-defined visual events in a large cor-            the descriptors are large and slow to match, making them
pus of surveillance footage. The use of a Visual Analytics              unsuitable for use as the evaluation corpus grows with time
component is described in Section 3. We follow that up                  and additional camera views. We follow a similar philos-
in Section 4 with the results our approach achieved on the              ophy to the one described by Chen et al. [19], with more
TRECVID interactive SED 2012 task, and finish with a dis-               compact and efficient descriptors.
Rather than capturing motion with an expensive optical
flow computation at each detected keypoint, our approach 0.0 SVM Responses
transforms the current frame by taking the absolute differ-
−0.2
ence image between the frame and the image 5 frames in the
past. This representation implicitly encodes both appear- −0.4
ance and motion simultaneously, providing us with a new
−0.6 detection
image from which we need only to extract an appearance
SVM Response
descriptor from. For this appearance descriptor, we elect to −0.8
use the FREAK descriptor [1], which uses a series of local
−1.0
binary comparisons to describe a local image patch with a
64 byte binary string. These strings are not only more com- −1.2
pact than MoSIFT, but allow for efficient matching with the
−1.4
hamming distance operation. FREAK descriptors captured
on this difference frame encode both spatial and temporal −1.6
information, giving us an informative and efficient descrip- −1.80
tor for event detection. 50 100 150 200 250 300
Response Number
Standard keypoint detection algorithms detect keypoints
solely in a spatial manner. We augment keypoint detec-
Figure 3. We test whether a peak in the SVM response space is
tion by running a second check over each detected key-
a detected event by checking the window around that peak for
point. For each detected keypoint, we sum the values in
greater values. In this case (the gray box), there are no greater
the corresponding image patch region in the difference im- peaks and the point would be detected as a PersonRuns event.
age. A high sum in this region indicates significant change
between the paired frames, which increases the likelihood
of true movement in that patch. We normalize the patch for ensuring that there is an even proportion of positive features
scale invariance and compute this sum over each detected (features from our target event) and negative features.
keypoint. If the sum exceeds a pre-determined threshold,
2.4. Event detection
the keypoint is accepted. Otherwise, there is not enough
movement within the patch to be useful for event detection, A query video sequence will incrementally build new
and the keypoint is discarded. bag of words features, which can be fed into an SVM to
classify that specific feature. With that in mind, we pose
2.3. Bag of words model the event detection problem as the problem of finding large
local maxima in the SVM response space.
As events are temporal in nature, they should be de-
Each bag of words feature is encoded as a normalized
scribed by a distribution of events over an elapsed time
histogram. To classify this histogram, we use a support vec-
window. This is achieved by computing a bag of words
tor machine with the histogram intersection kernel. For his-
representation across a series of frames. For PersonRuns,
tograms a and b, the histogram intersection kernel is defined
we have decided to use 50 frames to describe a potential
as
event. Therefore, over 50 frames all of our feature descrip- X n
tors are extracted and assigned to the nearest codeword, a K∩ (a, b) = min(ai , bi ) (1)
pre-selected feature determined at training time, often se- i=1
lected by clustering the training descriptors. A histogram Our experiments have shown that the histogram intersec-
is constructed, where histogram bin i is incremented each tion kernel works as well as the χ2 kernel, and sometimes
time a descriptor is deemed to be most similar to the ith yields better performance.
codeword. In the end, we normalize this histogram to en- Each of these SVM responses gives a floating point value
sure that scenes with more detected keypoints are not over- corresponding to how likely the feature belongs to the Per-
accounted for. sonRuns event. The set of all bag of words features over an
Studies have shown [12] that using k-means clustering interval gives a distribution with several peaks and valleys,
to define the codewords for a bag of features codebook of- visualized in Figure 3. We are interested in SVM responses
ten overfits to the densest region of the feature space, mak- that are much higher than the local neighbourhood of that
ing it no better than random cluster selection. Our experi- specific response. We begin with a single pass over each
ments validated that hypothesis on video action recognition, response and extract each response xi where xi > τ , for
leading us to use class-balanced random clusters for visual some threshold τ , xi > xi−1 and xi > xi+1 . This leaves
codebook selection. Given a training set of features, we ran- us with a small number of candidate events, the areas with
domly select features to be the quantizing codewords, while a direct local peak.With the subset of candidate events extracted, we final-
ize the PersonRuns decision by centering a window around
each candidate point i with SVM response xi and scan- a)
ning the distribution in that window to test whether xi is a
window-wise maximum. If it is, then the PersonRuns event
has occurred at location i. The size of the window is rela-
tive to the assumed length of a PersonRuns event. We pre- b)
viously defined that PersonRuns is a 50 frame event, so the
window would be for 25 frames before and after i. We also Figure 4. Key idea behind VAP software: a) converting continuous
performed experiments with the PersonRuns event being a stream to set of bags of graphically annotated images representing
25 frame event. the potential events of interest, b) the bag of images which are
more likely to be useful are shown to the user first.
2.5. Training
The Gatwick dataset is used as a source for training extract useful information, while ignoring or discarding the
data. As the ground truth is available, all of the Person- information that is not useful.
Runs events were extracted from this dataset for use as pos-
itive examples. Each event is processed by computing the 3.1. Making use of human visual recognition power
keypoint descriptors as described in Section 2.2. These key-
In “Illuminating the Path” [18], Thomas and Cook de-
points are then transformed into bag-of-words features for
fine visual analytics as the science of analytical reasoning
use as training examples for the SVM. A similar approach
facilitated by interactive visual interfaces. From [2] “The
is taken for the negative examples, where random samples
purpose of visual analytics techniques is to help a human
of the video are taken from any time frame that a Person-
analyst to understand some data and underlying phenom-
Runs event does not occur. Finally, the features are used to
ena. Thus, it can be used in studies of individual move-
train an SVM with a modified implementation of LibSVM
ment behaviours, including behaviours of animals.” While
[5], with the histogram intersection kernel.
the computer is efficient at processing lots of information
Clusters for the bag-of-words model were selected at
quickly, the human is efficient at quickly making sense of
random, as described in Section 2.3. The difference be-
the information if it is relatively small and well presented.
tween k-means clustering and random cluster selection was
Visual Analytics is all about showing the data in a format
negligible in our experiments. When sampling clusters,
most suited for the human. From [13], Visual Analytics is
we ensured class balance by selecting 500 random clusters
“The best of both sides” between the machine and the hu-
from keypoints from positive event instances and 500 ran-
man, it is a collective effort from the machine best at pro-
dom clusters from keypoints among the negative event in-
cessing data and the human best at perception.
stances.
The Video Analytic Platform is built while keeping Vi-
3. Filtering false alarms using Visual Analytics sual Analytics in mind. The concept is based on event anal-
ysis where every event has a bag of images consisting of
As mentioned in the introduction, a Visual Analytics tool a subset of the video. In the VAP lexicon, Event, desig-
that allows a human officer to efficiently process the data nated as E, is an instance when certain conditions related
displayed on a computer screen is needed in addition to to what is observed in the video are met, whereas Details of
Video Analytics. Related to the SED task, an interactive interest, designated as D{Ei}(E), are a set of static images
graphical user interface that intelligently organizes detected and associated metadata (annotations, timestamp and score)
events to allow a human to efficiently analyze the events, that are extracted and saved from the video when an event
deciding whether each detected event is a true positive, is of interest happens, of which one image with annotation is
required. chosen to represent the Event.
The Canada Border Services Agency has previously de- Based on these definitions, the main VAP task is to re-
veloped Video Analytics Platform (VAP) [10], that is well place a continuous video-stream with a list of Details {Dj}
suited to this task (Figure 4). VAP was originally developed that can be efficiently browsed and analyzed.
for the testing and integration of third party video analyt- The interface can filter the results by type of descriptor,
ics codes with the existing IP-camera based video surveil- score, flag, timestamp, camera and comment. This multi-
lance infrastructure. A critical feature of this platform is dimensionality gives the user the ability to search for events
the Event Browser which is an interactive web application of interest and prioritize its efforts. The efforts were opti-
for displaying detected events according to filtering criteria. mized by sorting the events by descending algorithm score
It is designed so that to enable humans to use their Visual and thus giving a better chance of finding important events
Analytics power in order to be able to efficiently find and in a limited time period. The descriptor was set for onlyFigure 5. VAP Event Browser interface that allows efficiently reviewing detected events
Figure 6. Timeline View of the VAP Event Browser interface allows analyzing events using the timeline information.
one type of event. Suspicious events would be flagged, af- positive. The first test displayed only a single video at
ter processing the operator would select only flagged events once, while the second test displayed multiple videos simul-
and could review in more detail whether the event is a false taneously. Displaying multiple videos allowed us to pro-
positive or not. cess more PersonRuns events in the same span of time. In
a 3-minute test, a user was able to classify 46 events per
To improve the efficiency, peripheral vision and phys-
minute when multiple videos displayed simultaneously. In
ical navigation was used. From [3], “The key benefits of
constrast, displaying only a single event slowed down user
exploiting physical navigation over virtual navigation are
classification time to 34 events per minute.
its physical efficiency (especially eye and head movements),
its cognitive efficiency as a user interface, and its natural
learnability”. Multiple events were played at the same time 3.2. Applying VAP software to TRECVID test
in loop in descending score order. The length of the video
In the context of this TRECVID submission, all detected
was determined by the underlying architecture, but we de-
events are imported into VAP and sorted by SVM response,
termined that a one to two second event was optimal. The
so events deemed most likely by the SVM classifier appear
user could quickly delete a false alarm or flag the video as
at the start of the interactive process. For each event, the
being important. By having five videos played at the same
video plays and a simple click can flag an event as a true
time, we optimized the human and computer time. The hu-
positive. Alternatively, another click removes an event if it
man was able to observe more than one video at the same
is deemed to be a false positive. This can be visualized by
time as detecting the running action does not need the full
the context menu in Figure 5. We exploit the user’s abil-
attention of the operator. The computer was able to load the
ity to detect events in their peripheral vision by playing the
latest videos as the operator was watching the oldest ones
five most likely events simultaneously, in a horizontal row.
thus giving a minimal loading time.
Our experiments found this technique to be effective, as we
For evaluating the efficiency of the peripheral vision and were able to identify events occurring in videos which were
physical navigation components, two tests were run with not the immediate focus, increasing the number of videos
identical events, with a button to flag a video as a true pos- analyzed within the allocated time slot. For the submission,
itive and a button to delete a video in the event of a false the human operator was successful at processing more thanFigure 7. Extracted meta-data, such as rectangles, points, and vectors detected by the detection algorithm, can be used by VAP Event
Browser interface to make visual processing more efficient though the use overlaid graphical annotations and extracted regions of interests.
600 events in 25 minutes or 24 events per minute with the shop entrances. Camera 2 observes a dense waiting area
help of VAP. with several people sitting and walking through a crowded
Scalability is achieved by distributing all automated walking lane. Camera 3 observes many people standing and
components across multiple machines, and can be furthered waiting, as well as a consistent flow of pedestrians passing
by having multiple users classifying events. One could triv- by. Camera 4 directly observes two elevator doors with very
ially accomplish this, as the platform is web based. little else in the scene. Finally, camera 5 observes multiple
crowded horizontal walking lanes, where pedestrians will
3.3. Additional VAP software features walk by at different visual scales. Training was performed
In addition to Smart Search view, VAP Event Browser on selected portions of 60 hours of the development and
can overlay videos with useful visual information (Figure 7) evaluation video sequences from these cameras. Event de-
and provides an ability to view events using Timeline View. tection was performed on a final 15 hours of test data.
Timeline View shows events using timestamp information, The interactive surveillance event detection task allows
as shown in Figure 6. — One blue block shows one event for a user to spend 25 minutes with a visual analytics tool
in a one hour window. The length of the block is propor- to select true positive events from the video analytics sys-
tional to the length of the event. This view is very useful for tem’s event detection process. Within this 25 minute time-
processing surveillance footage with real timestamps, since frame, our test user selected 15 “true positive” events for
the timestamp may help significantly expedite visual clas- the PersonRuns task. As described in Table 1, nine of these
sification. For example, classification between a car and a events selected by the user were deemed to be false posi-
bicycle could be done by checking the event length. In cur- tives, while six of them were deemed to be true positives.
rent TRECVID evaluation however, this view could not be Due to the nature of the underlying event detection system,
fully used at because the timestamp of the TRECVID video all events processed were of two fixed lengths as processed,
sequences is not known, and also because the length of all 50 frames or 25 frames. As such, it is possible that some of
video clips extracted by the video analytic module was fixed the false positives were a result of the intersection between
(2 secs) for all events. the selected event and the ground truth being too small to be
considered a true detection. A possible remedy for such a
4. Results situation would be to add sliders to the visual analytics tool
to modify the start and end frames of each event. While this
All training and event detection was done on the
would slow down the human processing speed, it would in-
Gatwick dataset, surveillance footage captured at the Lon-
crease the precision of each detection, allowing us to accu-
don Gatwick airport recorded with MPEG2 compression
rately capture the entire event and less spurious data.
at a resolution of 720x480 at 25 frames per second. This
dataset consists of five cameras which contain some over- The DET curve for the returned results is displayed in
lap. Each camera is broken up into several hours of video Figure 8. Our returned DCR score is 0.9469. A DCR score
across multiple days, which ensures that systems do not is a weighted linear combination of the missed detection
overtrain on specific persons and allows for different vari- probability (the number of missed detections divided by the
ations on the same event. Camera 1 observes people exit- number of events) and the rate of false alarms. A DCR score
ing and entering through a series of doors, as well as a few of 0 is indicative of a perfect detection system, so lowerFigure 8. DET curve for our submission for the PersonRuns event on the interactive SED task. The DET curve plots the missed detection probability against the rate of false alarms. Our result is the darkest blue curve, as shown in the legend (VIVA-uOttawa p-baseline 2). The actual DCR value is equivalent to the minimum DCR value, so only one node is visible due to the minimum and actual DCR values overlapping.
Title           #Targ     #NTarg     #Sys     #CorDet     #FA     #Miss     RFA         PMiss     DCR
              PersonRuns      107       9          15       6           9       101       0.59027     0.944     0.9469

Table 1. Details of our submission for the PersonRuns event on the interactive SED task. There were 107 true events (#Targ), while we
detected 15 (#Sys). 6 of those 15 events were deemed to be true events (#CorDet), while 9 were deemed false alarms (#FA), giving us
101 missed detections (#Miss). Our rate of false alarms is 0.59027 (RFA), and our percentage of missed detections is 0.944 (PMiss). The
weighted linear combination of the false alarm rate and probability of a missed detection is 0.9469 (DCR).

DCR scores are deemed to be representative of a more ac-              fier, a per-camera classifier, restricting the search space in
curate event detection system, with respect to false alarms           each camera view to remove unlikely areas for an event to
and detected events. A thorough explanation of the perfor-            occur, etc), visual analytic component (eg. further tuning
mance measures is available in [17].                                  of multi-clip viewing, keyboard short-cuts, graphical anno-
    In the context of other TRECVID teams, two groups                 tations, and visually salient GUI components) as well as
achieved lower DCR scores, while five teams have higher               better data pipe-lining between both components and more
DCR scores reported than our DCR of 0.9469. The mean                  configurability (eg. to allow detected clips to be of variable
DCR is 0.9406, lowered by the best DCR of 0.573, while                length and to have more detailed associated metadata).
the highest DCR was 1.3748. Our rate of false alarms (RFA)
is 0.59027, the second lowest in this year’s TRECVID task.
                                                                      5.1. Relevance to operational needs
The average RFA is 22.0040075, significantly higher than                 In order to relate the value of the obtained results to the
our own. The disparity in RFA scores indicates that there             operational needs, we present in Table 2 the estimates of the
are multiple methodologies that were used to determine                value-cost analysis of the presented technology, measured
how to prune the automated detection results. The largest             in terms of full-time employeee (FTE) required to perform
RFA value is 119.82510, indicating that rather than manu-             that task.
ally filtering events sequentially, an approach of tuning pa-            Automated event detection technologies garner a great
rameters to optimize on a subset of the results may have              deal of interest from government and private organizations,
been taken. Conversely, the lowest RFA score is 0.39351.              due to the vast benefits they could bring to real-time surveil-
That score corresponds to a submission with very few (8)              lance applications, as well as post-event surveillance data
detected events, likely indicating that a similar approach to         analysis. Despite this interest, the current maturity of these
our own was taken, through manual sequential filtering.               technologies does not meet the standard required for real-
                                                                      time deployment in the field. Experiments at TRECVID
5. Discussion                                                         reveal that with 25 minutes of human analysis, only 6% of
                                                                      true events can currently be identified in a 15 hour testing
    In this paper, we propose the use of a standard bag-of-
                                                                      set.
words event detection model with binary feature descrip-
                                                                         Despite the current shortcomings, the results at
tors. The binary feature descriptors permit efficient match-
                                                                      TRECVID showcase growing evidence in the maturing of
ing between detected keypoints and cluster centers, by using
                                                                      video analytics techniques over the recent years. Com-
the hamming distance rather than a slower distance metric,
                                                                      bined with efficient visual analytics interfaces, they may
such as the Euclidean distance. Furthermore, the dimen-
                                                                      provide an effective means for post-event analysis of com-
sionality of the descriptors is greatly reduced, leading to fur-
                                                                      plex surveillance data.
ther efficiency gains and a reduced disk space cost. Despite
the computational gain, the overall recognition performance
                                                                      6. Acknowledgement
of the system could be greatly improved.
    To address the time constraint requirement of the SED               This work was supported by the Defense Research and
task and in order to filter out efficiently the false alarms, we      Development Canada Centre for Security Science Public
piped the results obtained in the video analytic component            Security Technical Program (PTSP 03-0402BTS).
of our solution to the visual analytic component which relies
on the human’s visual recognition power to enable efficient           References
processing of visual data. This component, originally de-
                                                                       [1] A. Alahi, R. Ortiz, and P. Vandergheynst. FREAK: Fast
veloped by CBSA for testing third party video analytics in                 Retina Keypoint. In IEEE Conference on Computer Vision
operational CCTV environments, is further custom-tuned to                  and Pattern Recognition, 2012. CVPR 2012 Open Source
efficiently view, flag and delete TRECVID detection results                Award Winner.
data.                                                                  [2] G. Andrienko, N. Andrienko, and S. Wrobel. Visual analyt-
    Further work includes improving the video analytic com-                ics tools for analysis of movement data. SIGKDD Explor.
ponents (eg. improving the data used to train the classi-                  Newsl., 9(2):38–46, Dec. 2007.
HR cost computer cost # Precision (TP)
Manual processing 3 FTE days 3 computer-days 97%
Video Analytics 3 FTE hours 40 computer-days ˜ 12%
Video Analytics + Visual Analytics 125 FTE hours +3 computer days ˜15%
Video Analytics + 25-minutes of Visual Analytics 25 FTE mins + 25 mins 6%
Table 2. Value-cost analysis of the VA solution compared to manual processing. Video Analytics + Visual Analytics numbers are estimates
based on typical operational requirements, extrapolated from experimental setups at a smaller scale.
[3] R. Ball and C. North. The effects of peripheral vision and [14] I. Laptev and T. Lindeberg. Space-time interest points. In IN
physical navigation on large scale visualization. In Proceed- ICCV, pages 432–439, 2003.
ings of graphics interface 2008, GI ’08, pages 9–16, Toronto, [15] D. G. Lowe. Distinctive image features from scale-invariant
Ont., Canada, Canada, 2008. Canadian Information Process- keypoints. International Journal of Computer Vision, 60:91–
ing Society. 110, 2004.
[4] L. Bao, L. Zhang, S. Yu, Z.-Z. Lan, L. Jiang, A. Overwijk, [16] P. Over, G. Awad, M. Michel, J. Fiscus, G. Sanders, B. Shaw,
Q. Jin, S. Takahashi, B. Langner, Y. Li, M. Garbus, S. Burger, W. Kraaij, A. F. Smeaton, and G. Quenot. Trecvid 2012 – an
F. Metze, and A. Hauptmann. Informedia @ trecvid 2011. In overview of the goals, tasks, data, evaluation mechanisms
TRECVID, 2011. and metrics. In Proceedings of TRECVID 2012. NIST, USA,
[5] C.-C. Chang and C.-J. Lin. LIBSVM: A library for 2012.
support vector machines. ACM Transactions on Intelli- [17] A. F. Smeaton, P. Over, and W. Kraaij. Evaluation campaigns
gent Systems and Technology, 2:27:1–27:27, 2011. Soft- and trecvid. In MIR ’06: Proceedings of the 8th ACM In-
ware available at http://www.csie.ntu.edu.tw/ ternational Workshop on Multimedia Information Retrieval,
˜cjlin/libsvm. pages 321–330, New York, NY, USA, 2006. ACM Press.
[6] P. Dollár, V. Rabaud, G. Cottrell, and S. Belongie. Behavior [18] J. Thomas and K. Cooks. Illuminating the path. IEEE Com-
recognition via sparse spatio-temporal features. In VS-PETS, puter Society, 2005.
October 2005. [19] M. yu Chen, H. Li, and A. Hauptmann. Informedia @ trecvid
[7] X. Fang, H. Zhang, C. Su, T. Xu, F. Wang, S. Tang, Z. Xia, 2009: Analyzing video motions, 2009.
P. Peng, G. Liu, Y. Wang, W. Zeng, and Y. Tian. Pku-nec @
trecvid 2011 sed: Sequence-based event detection in surveil-
lance video. In TRECVID, 2011.
[8] Z. Gao, A. Liu, Y.-T. Su, Z. Ji, and Z.-X. Yang. Tjut-
tju@trecvid 2011: Surveillance event detection. In
TRECVID, 2011.
[9] A. Gilbert, J. Illingworth, and R. Bowden. Fast Realis-
tic Multi-Action Recognition using Mined Dense Spatio-
temporal Features. In Proc. Int. Conference Computer Vision
(ICCV09), 2009.
[10] D. Gorodnichy and E. Dubrofsky. VAP/VAT: Video Ana-
lytics Platform and Test Bed for Testing and Deplying Video
Analytics. In Proceedings of SPIE Volume 7667: Conference
on Defense, Security and Sensing, 2010.
[11] T. Gorodnichy, Mungham. Automated video surveillance:
challenges and solutions. ACE Surveillanec (Annotated Crit-
ical Evidence) case study. In NATO SET-125 Symposium
”Sensor and Technology for Defense against Terrorism”,
2008.
[12] F. Jurie and B. Triggs. Creating efficient codebooks for vi-
sual recognition. In Proceedings of the Tenth IEEE Interna-
tional Conference on Computer Vision (ICCV’05) Volume 1
- Volume 01, ICCV ’05, pages 604–610, Washington, DC,
USA, 2005. IEEE Computer Society.
[13] D. Keim, G. Andrienko, J.-D. Fekete, C. Görg, J. Kohlham-
mer, and G. Melançon. Information visualization. chapter
Visual Analytics: Definition, Process, and Challenges, pages
154–175. Springer-Verlag, Berlin, Heidelberg, 2008.You can also read