Tic Detection in Tourette Syndrome Patients Based on Unsupervised Visual Feature Learning
←
→
Page content transcription
If your browser does not render page correctly, please read the page content below
Hindawi
Journal of Healthcare Engineering
Volume 2021, Article ID 5531186, 10 pages
https://doi.org/10.1155/2021/5531186

Research Article
Tic Detection in Tourette Syndrome Patients Based on
Unsupervised Visual Feature Learning

 Junya Wu ,1 Tianshu Zhou,2 Yufan Guo,3 Yu Tian,1 Yuting Lou,3 Hua Ru,2
 Jianhua Feng ,3 and Jingsong Li 1,2
 1
 Engineering Research Center of EMR and Intelligent Expert System, Ministry of Education,
 Key Laboratory for Biomedical Engineering of Ministry of Education, College of Biomedical Engineering and Instrument Science,
 Zhejiang University, Hangzhou 310027, China
 2
 Research Center for Healthcare Data Science, Zhejiang Lab, Hangzhou 311100, China
 3
 Department of Pediatrics, The Second Affiliated Hospital of Zhejiang University School of Medicine, No. 88 Jiefang Road,
 Hangzhou 310009, China

 Correspondence should be addressed to Jianhua Feng; hzhz87083886@zju.edu.cn and Jingsong Li; ljs@zju.edu.cn

 Junya Wu and Tianshu Zhou contributed equally to this work.

 Received 5 March 2021; Revised 4 May 2021; Accepted 24 May 2021; Published 7 June 2021

 Academic Editor: Jialin Peng

 Copyright © 2021 Junya Wu et al. This is an open access article distributed under the Creative Commons Attribution License,
 which permits unrestricted use, distribution, and reproduction in any medium, provided the original work is properly cited.
 A clinical diagnosis of tic disorder involves several complex processes, among which observation and evaluation of patient
 behavior usually require considerable time and effective cooperation between the doctor and the patient. The existing assessment
 scale has been simplified into qualitative and quantitative assessments of movements and sound twitches over a certain period, but
 it must still be completed manually. Therefore, we attempt to find an automatic method for detecting tic movement to assist in
 diagnosis and evaluation. Based on real clinical data, we propose a deep learning architecture that combines both unsupervised
 and supervised learning methods and learns features from videos for tic motion detection. The model is trained using leave-one-
 subject-out cross-validation for both binary and multiclass classification tasks. For these tasks, the model reaches average
 recognition precisions of 86.33% and 86.26% and recalls of 77.07% and 78.78%, respectively. The visualization of features learned
 from the unsupervised stage indicates the distinguishability of the two types of tics and the nontic. Further evaluation results
 suggest its potential clinical application for auxiliary diagnoses and evaluations of treatment effects.

1. Introduction stages of the disease. Furthermore, approximately 20% of per-
 sons with TS are unaware that they have tics [4]. The clinical
Tourette syndrome (TS) is a childhood-onset neuro- diagnosis of TS involves complex processes that require con-
developmental disorder characterized by the presence of fluc- siderable time and effective cooperation between the doctor and
tuating motor and vocal tics [1]. The core diagnostic features are the patient, especially observation and evaluation of the patient’s
both multiple motor and one or more phonic tics lasting more tic behaviors. A number of instruments for tics and associated
than one year. Typically, the same tic occurs at short-term phenomena have been developed to assess tic severity [5] and
periodicity with short intervals [2]. The simple tic forms are eye differ in construct, comprehensiveness, and ease of
blinking, mouth twitching, head jerking, etc. Multiple studies administration.
published since 2000 have consistently demonstrated that the Recently, artificial intelligence and machine learning
prevalence of TS is much higher than previously thought [3]. As have been widely applied in the medical field. In particular,
the understanding of this disease deepens, the number of the development of video-based human motion behavior
children diagnosed with tic disorder has gradually increased, but analysis technology has advanced various types of medical
most cases do not receive timely clinical attention in the early diagnoses, such as Parkinson’s disease [6], seizure disorders
2 Journal of Healthcare Engineering

[7], spinal muscular atrophy [8], and discomfort detection in unlabeled data and then applying a comparatively simple
premature infants [9]. In part, noncontact video-based network attached to the former trained model for the
analysis has attracted great attention due to the increasing classification tasks. Visualizing the feature representation of
availability of camera monitoring systems. To identify tic the labeled data shows the correspondence with the tic parts,
disorders, patients’ tic movements can be detected and indicating that the unsupervised model learned the valid
analyzed from video tapes that show the patient’s face, head, feature representation. This approach results in the following
or body and rated according to the Yale Global Tic Severity contributions: (1) we employ a deep learning scheme by a
Scale (YGTSS) [10] or the Modified Rush Video-based convolutional-neural-network- (CNN-) based model to
Rating Scale (MRVRS) [11]. These ratings can then be used learn feature representation from abundant unlabeled video
to assist a clinical doctor in evaluating the patient’s symp- data, (2) we apply a long short-term memory neural network
toms and severity. (LSTM) to classify the feature sequences of video clips, and
 Tic movements can be distributed throughout the body. (3) an automated video-based system for detecting tic
Rickard’s research [12] showed that patients’ twitches usually movements in TS patients is devised.
start in the facial area and that eye twitches are the most
frequent. Chappell et al. [13] showed that, in addition to a 2. Materials and Methods
severity scale, the severity of Tourette syndrome can also be
determined by recording the patient’s tics with video for more To solve the problem of insufficient labeled data but enough
than ten minutes. Moreover, monitoring and recording pa- monitoring video data, we propose a two-stage framework
tients in their natural states instead of facing a clinician ef- that combines unsupervised and supervised learning, as
fectively avoids interference in diagnosis and evaluation caused shown in Figure 1. In the first stage, we adopt a contrastive
by the patient actively controlling their tics. Therefore, we aim learning network that learns from unlabeled video data by
to develop a method to automatically detect tics to help cli- extracting features by maximizing mutual information. The
nicians or parents spot and assess tic signs. core idea behind this is to maximize the mutual information
 In recent decades, many studies have focused on the pa- between the two nonoverlapping patch inputs. In the second
thology, genetics, and clinical treatment of TS [14–16], but only stage, we design an end-to-end architecture based on an
a few studies have been published regarding the automatic LSTM network connected to the feature extraction module
detection of TS-related motor disturbances. Jonathan et al. [17] in the first stage that learns to classify tic movements from
studied two patients with TS using deep brain stimulation video data labeled by doctors. We use a combination of
(DBS) during tics and found that low-frequency (1-10 Hz) supervised and unsupervised learning to design and build an
centromedian (CM) thalamic activity and beta frequency motor end-to-end tic detection model.
cortex (M1) activity were tic features and that long complex tics
are concurrent with a highly detectable thalamocortical sig-
 2.1. Subjects. Sixty-eight patients (4–13 years old) diagnosed
nature. Bernabei et al. [4] used a wearable device attached to the
 with TS by two experienced specialists were employed in this
patient’s trunk with an embedded triaxial accelerometer to
 study. All participants were inpatients under normal
monitor tic events. This approach achieved a sensitivity of
 treatment recruited from the Second Affiliated Hospital of
80.8%, a specificity of 75.8%, and an accuracy of 80.5%.
 Zhejiang University School of Medicine between May and
However, the implementation process of this method is quite
 September 2019. This study was approved by the ethics
complicated, which poses a major challenge and requires ex-
 committee of the Second Affiliated Hospital of Zhejiang
tensive cooperation between doctors and patients. Recently,
 University School of Medicine (YAN2019-148). All partic-
Barua et al. [18] proposed a deep learning approach for
 ipants provided written informed consent with the agree-
detecting tic disorders using wireless channel information and
 ment to participate in the study.
achieved an accuracy above 97%. The data used in the task were
simulated using healthy human subjects. However, in a real
clinical situation, acquiring such data would be a considerably 2.2. Data Acquisition and Preprocessing. The TS dataset was
more complicated task. Regarding methodological aspects, sourced from the Department of Pediatrics at the Second
action detection methods have made numerous advancements Affiliated Hospital of Zhejiang University School of Medi-
in video comprehension, such as the two-stream network cine and was collected using EEG video acquisition
[19–21], 3D ConvNet [22–24], and temporal enhancement- equipment installed in the pediatric ward. The video data
and-interaction network (TEINET) [25], whereas these deep were recorded in two situations: (i) the patient was asked to
learning networks require large amounts of labeled data, which sit on a chair in front of the camera and (ii) before or after
carries the high costs and slow procedures associated with EEG recording, the patient was asked to agree to video
manual labeling. Data labeling is often costly and time con- recording. The two situations arise because the data were
suming: an example is the popular ImageNet dataset [26]. collected in different periods: (i) represents data collected
However, in real-world situations, large amounts of readily during the preproject preparation phase, whereas (ii) is a
accessible unlabeled data exist; therefore, unsupervised learning part of the routine during subsequent EEG video recording.
has attracted increasing attention from researchers. In both situations, every patient was informed in advance of
 From these perspectives, we instead adapt a two-stage the recording period and asked to face the camera as much as
architecture by first training an unsupervised feature ex- possible during recording, but no mandatory measures were
traction model to make full use of the more easily acquired imposed; the patients could move freely, which may result in
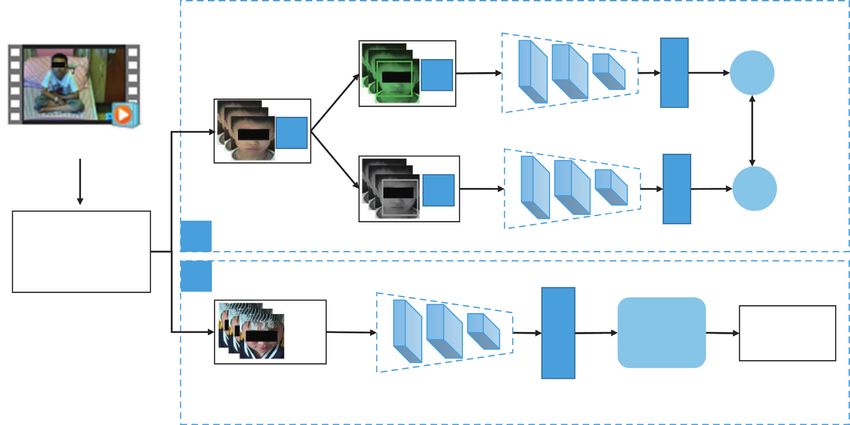
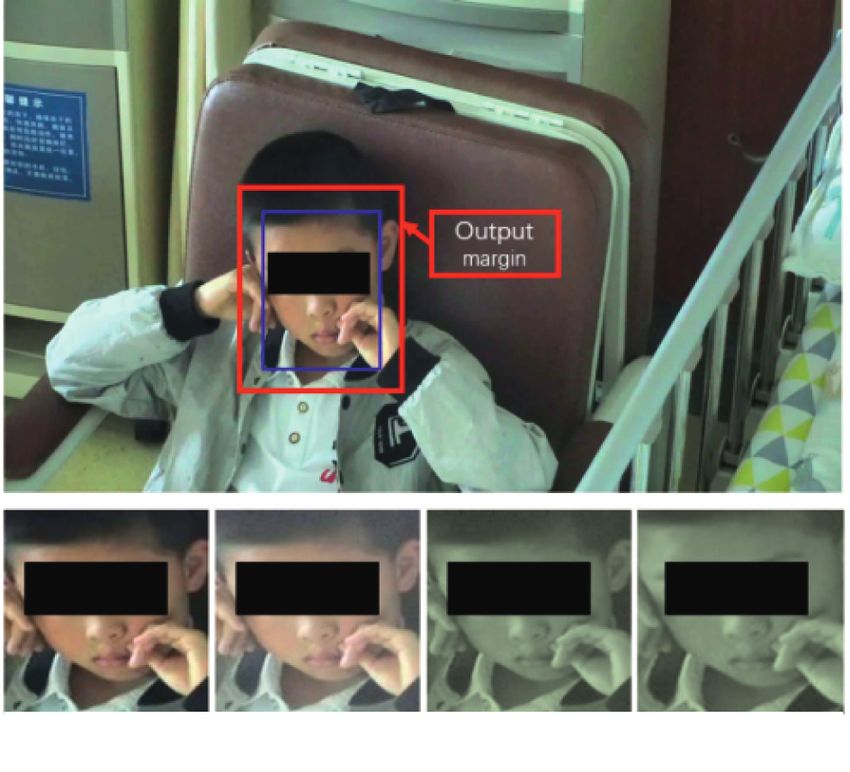
Journal of Healthcare Engineering 3

 F (·)
 G (·)
 ~
 xi fj gj
 T (·)

 Contrastive
 x
 Original video dataset loss function
 F (·)
 G (·)
 T (·) ~
 xj fj gj

 Data 1
 preprocessing
 2
 F (·)

 Features
 Video Tic
 clips
 LSTM
 T (·) detection

Figure 1: The architecture of the proposed method. (1) Stage 1: extracting representative visual features. (2) Stage 2: training an LSTM using
visual features.

useless frames. The patients’ parents provided informed Table 1: Original TS video dataset.
permission for the collection procedure and research use of Category Labeled dataset Unlabeled dataset
the video recordings.
 Videos 13 55
 Due to different camera devices, the original video frame Minutes 136 709
rate includes video acquired at both 30 and 25 fps. The duration
of all videos ranges from 5 to 15 minutes, and all the videos have
a resolution of 1920 × 1080. The length of the videos is listed in
Table 1, and the distribution of the durations is presented in stages. The common operation is to obtain the region of
Figure S1. In this TS dataset, 13 cases were annotated by two interest (ROI), which is defined as the area centered on the
specialists, who labeled the starting and ending timestamps of a patient’s face. This ensures that the models will focus on
specific tic event, such as an eye tic or a mouth tic. They features related to patients’ tic behaviors rather than on
performed manual annotation frame by frame through the other family members or physicians visible in the videos.
video annotation software VoTT (https://github.com/ Identifying the ROI also reduces interference from different
microsoft/VoTT), which then generated annotated JavaScript camera angles and from patient movements since they are
Object Notation (JSON) files for postprocessing to extract free to move out of the camera view. This procedure uses a
annotations. The annotation work was independently per- neural-network-driven face detection method. We use the
formed by two clinicians and verified by the third expert, and multitask cascaded CNN (MTCNN) [27] architecture to
they performed an extra check if there were disagreements until detect the patient’s face and obtain the ROI and use the
they reached a consensus. Finally, we cut and categorized the pretrained weights from Face2 [28]. To avoid the regional
videos based on the timestamped annotations to form the TS deviations caused by free patient motion and obtain more
research dataset, which can be supplemented at any time. We features in the face area, we extract the ROI area by
also segmented the video segments between two labeled tic expanding the width of the face bounding box by 20%.
events in the original video, which can be used as normal Figure 3 illustrates the ROI output margin. We also conduct
recordings and act as negative samples. data augmentation during preprocessing, an approach that
 There are more than five types of tics involving different has been widely used in both supervised and unsupervised
muscle groups in the labeled data. The most common tics are learning [29, 30]. The effectiveness of simple data aug-
eye tic and mouth tic. Not only in this research dataset but also mentation methods for contrastive learning tasks was ver-
most in clinical practice, these two tic types are widespread from ified by [31]. Similarly, after obtaining the ROI area,
a specialist’s perspective [12]. Therefore, we defined two combined data augmentation methods are adopted in-
classification tasks. (1) We chose these two tic types and normal cluding random cropping, random noise, and random color
recordings to define a multiclass classification task. (2) We also distortion.
configured a binary classification task for the tic and normal The difference between the two main stages during data
datasets—that is, all the tic video clips form the positive samples, preprocessing is that the first stage uses a relatively large
while the normal video clips form the negative samples. Figure 2 number of frames from an unlabeled video dataset. As well
shows the category proportion of every patient in the labeled known, the information between continuous video frames is
dataset, defined in these two tasks. usually highly redundant, which can cause overfitting during
 The proposed method is composed of two stages, and training. Thus, we perform a 3-fold downsampling proce-
there are slight differences in data preprocessing for the two dure, which extracts the first frame for every three
4 Journal of Healthcare Engineering

 100 100
 90 90
 80 80

 Percentage (%)
 Percentage (%)

 70 70
 60 60
 50 50
 40 40
 30 30
 20 20
 10 10
 0 0
 01 02 03 04 05 06 07 08 09 10 11 12 13 01 02 03 04 05 06 07 08 09 10 11 12 13
 Subject ID Subject ID
 Normal Normal
 Tics Eye tic
 Mouth tic
 (a) (b)

Figure 2: Category proportion of normalized video clips of patients in (a) the multiclass classification task and (b) the binary classification
task. The ordinate indicates the patient number in the labeled TS dataset.

 unlabeled data (n � 55). Apparently, the labeled data we have
 are insufficient to train a deep learning model. To explore the
 value of the unlabeled data, we adopt a contrastive learning
 framework similar to SimCLR [31] in Stage 1 to extract
 representative visual features among the TS patient groups.
 Specifically, a randomly selected minibatch S of N examples
 is transformed into a minibatch pair S′ consisting of 2N
 examples after applying a combination of a set of data
 augmentation methods. Then, S′ is input to the defined
 contrastive prediction task. For every minibatch pair S′, each
 pair (i, j) of augmented examples S′ (i, j) is treated as a
 positive example (n � 2), while the others (n � 2(N-1)) are
 treated as negative examples. Then the similarity sim(i, j) of
 the pair S′ (i, j) is defined as follows:
 S′Ti Sj
 ′
 sim(i, j) � � ��� �� , (1)
 � �
 (a) (b) (c) (d) ��S′i�����Sj′���
Figure 3: Region of interest in data preprocessing. (a) is the output and the loss function of the pair loss(i, j) is defined as
of the MTCNN, and (b), (c), and (d) are the random data aug-
mentation methods applied. exp(sim(i, j)/τ)
 loss(i, j) � −log , (2)
 2N
 k�1,k≠i exp(sim(i, k)/τ)

consecutive frames on the original videos. In the second where τ denotes a temperature parameter, as in [32]. For
supervised training stage, we first cut the original continuous each pair in every minibatch, the total loss is computed as
video data into video segments and divide them into motion follows:
tic categories based on annotations. Then, we cut each video
segment into 1 s video clips using a no overlapping sliding 1 N
 L� [loss(2k − 1, 2k) + loss(2k, 2k − 1)]. (3)
window. These clips form the input objects for Stage 2. We 2N k�1
then performed the same ROI extraction procedure as for
Stage 1 but without video frame downsampling because the As shown in Figure 1, we use ResNet [33] as the neural
frame data are randomly extracted from every second of network encoder (F) to extract the visual features after data
input, which has an effect similar to downsampling. augmentation, and we use an MLP network (G) to map the
 output feature f to the space where contrastive loss is applied.
 The contrastive prediction task involves finding the other
2.3. Stage 1: Extracting Representative Visual Features. example j in examples S′ (i ≠ j)(n � 2N − 1) for example i in
The dataset used in this work consists of a small amount of each pair. In addition, we impose a restriction that every
labeled data (n � 13) and a relatively large amount of minibatch input must be a set of continuous frames
Journal of Healthcare Engineering 5

randomly selected from the video frames of a single subject. drop rate of 0.8; the output size is 128; and the size of the
This restriction eliminates the possibility of finding existing fully connected layer is changed to match the number of
macrofeatures between different faces during training and classes in each classification task. Considering the limited
helps the model focus on the microfeatures of tics. amounts of labeled data in the study that can easily cause
 overfitting during training and validation, we adopted the
 leave-one-subject-out cross-validation scheme in Stage 2,
2.4. Stage 2: Training the LSTM through Visual Features.
 which allows us to evaluate the differences between indi-
In Stage 2, we design a supervised learning framework based
 vidual patients. The setting for the overall analysis of a single
on the formerly trained neural network encoder (F). The
 patient is in line with the real clinical scenario, which is
LSTM network consists of a layer of LSTM with dropout and
 beneficial for the subsequent comprehensive analysis. We
a fully connected layer with rectified linear unit (ReLU)
 assess the effectiveness of our proposed method by calcu-
activation. Specifically, we take a one-second-long pre-
 lating the accuracy, precision, recall, F1-score, area under the
processed video clip as the input of this stage and randomly
 receiver operating characteristic (ROC) curve (AUC_ROC),
select k frames (k < 25) to feed to F, which generates visual
 area under the precision-recall curve (AUC_PR), and a
feature vectors. Every visual feature vector came from one
 confusion matrix for each subject evaluation. In the two
frame of the input video clip and corresponded to one
 different classification tasks, we consider different cutoff
neuron of the LSTM layer. These visual feature vector se-
 conditions during the training procedure by observing the
quences are then fed to the LSTM network to learn their
 following indicators from the validation evaluation: (1)
temporal features and deeper spatial features to accomplish
 accuracy and (2) the F1-score of the tic category. In addition
the classification task.
 to the data used for experimental modeling, we also collected
 To alleviate the problem of imbalanced categories in our
 individual test video data beyond those used for training
labeled data, we use the focal loss [34] Lf , which is defined as
 verification to verify the universality of the method.
follows:
 The next subsections report the details of the results and
 c p, if y � 1, provide discussions. Unfortunately, to the best of our
 Lf � −αt 1 − pt log pt , pt � knowledge, no public TS dataset for tic detection exists,
 1 − p, otherwise,
 which makes it difficult to compare the results of our method
 (4) with other works. Instead, we applied another two kinds of
where y denotes a tic label, p is the output prediction of the supervised ConvNet architectures, convolutional 3D (C3D)
LSTM network, and α and c are network hyperparameters. [22], and temporal segment network (TSN) [39], for
 comparison.
3. Evaluation and Results
3.1. Experimental Setup. Chen et al. [31] showed that the 3.2. Classification Tasks. C3D [22] is a simple yet effective
simple operation of expanding the batch data volume can model that uses 3D convolution kernels for spatiotemporal
replace the more complex memory library training model feature learning, and TSN [39] combines a sparse temporal
[35, 36]. In this work, the two stages are trained separately. sampling strategy and video-level supervision. They both
In Stage 1, we set the batch size to 512 and limited the single- achieved good performances for action recognition in videos
input data to a randomly chosen person’s continuous data when given limited training samples. As shown in Table 2,
due to the memory limitation of the training platform. For compared with the former two approaches C3D [22] and
the neural network encoder, we used a modified ResNet18 TSN [39], our method with the watch-accuracy strategy
model, with an input dimension of 112 × 112 × 3 and an achieves the best performances, with an average accuracy of
output dimension of 512. The following MLP network 94.87%, precision of 86.26%, and both recall and F1-scores
consists of two layers: the first layer has 512 neurons and the of approximately 80%. These results illustrate the effec-
second layer has 256 neurons. All the preprocessed unla- tiveness of our proposed method for tic recognition on the
beled video datasets were randomly split into a training set multiclass classification task.
(70%) and a validation set (30%) at the patient level. During Using the classification results for an individual subject,
training, we used the Adam optimizer [37] with an initial we further examine the misclassified items. Taking Case 1 as
learning rate of 3 × 10⁻⁴ adjusted by setting the cosine an example, as shown in Figure 4, after checking the original
annealing learning rate (LR) and a weight decay of 10-6. data, we found that (a) in the false positive result where the
Considering the limitation of our dataset, we used the label is normal but the prediction is mouth twitching, the
pretrained built-in weights of PyTorch [38]. The training mouth of the patient in this video clip does indeed twitch in
procedure is stopped when the loss of validation set has no the corners during a smile, indicating that the classification
more drops within 10 epochs. Then the ResNet model is model has learned the features of the motion but cannot
reused in Stage 2 to extract feature representations. precisely differentiate between a mouth-twitching motion
 In Stage 2, each video clip generates a feature vector of and a mouth-smiling motion when both are subtle; thus, it
clip-length × 512 through F. Here, clip-length is set as 16, misclassifies the action. (b) In false negatives where the labels
which means that there are 16 frames randomly sampled are eye tics while the prediction is normal, the patient in this
from each video clip, matching the time-step setting in the video clip is indeed blinking, but it is difficult for ordinary
LSTM network. The input size of the LSTM is 512 with a people and for the model to determine whether the blink is
6 Journal of Healthcare Engineering

 Table 2: Evaluations of the multiclass classification task.
 Accuracy Precision Recall F1-score
C3D [22] 0.7252 (±0.108) 0.7483 (±0.047) 0.7023 (±0.051) 0.7194 (±0.032)
TSN [39] 0.8988 (±0.117) 0.8354 (±0.089) 0.7284 (±0.054) 0.7600 (±0.070)
Ours-acc1 0.9487 (±0.0298)∗∗ 0.8626 (±0.084)∗∗ 0.7878 (±0.106)∗ 0.7975 (±0.093)∗
Ours-f12 0.9363 (±0.0390) 0.7628 (±0.209) 0.7362 (±0.198) 0.7391 (±0.198)
1
 Ours-acc means the proposed architecture with the watch-accuracy strategy. 2Ours-f1 means the proposed architecture with the watch-F1 strategy. ∗ p value
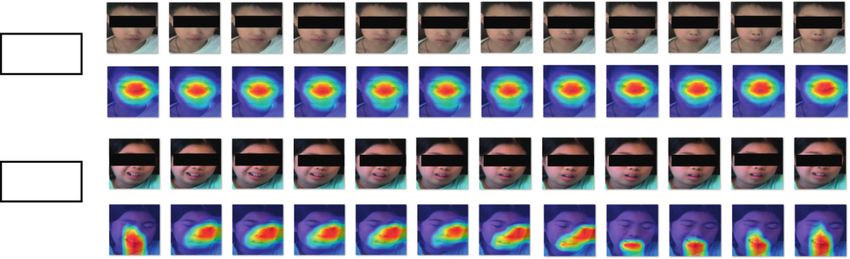
Journal of Healthcare Engineering 7

 Table 3: Evaluations of binary classification task.
 Accuracy AUC_ROC AUC_PR Precision Recall F1-score
Ours-acc 0.8890 (±0.0458) 0.7532 (±0.080) 0.7035 (±0.138) 0.8057 (±0.103) 0.7532 (±0.103) 0.7634 (±0.093)
Ours-f1 0.9057 (±0.0479) 0.7815 (±0.155) 0.7669 (±0.187) 0.8633 (±0.150) 0.7707 (±0.296) 0.7874 (±0.264)

 Eye tic

 Mouth tic

Figure 5: Visualization of two tic video clips of representation learning in Stage 1. The first row shows the original video clip frames; the
second row shows the corresponding CAM image.

 Table 4: Evaluations of some items of scales.
 Number of tic areas Tic frequency (tics/min) Time for evaluation (min)
Test ID
 Clinician Our model Clinician Our model Clinician Our model Clinician review
1 2 2 6 5 >40
8 Journal of Healthcare Engineering

management of the patient, the ability to continuously to try to ameliorate this limitation by integrating the few-
monitor and record tic events is the key to obtaining a shot learning method, which has performed well on many
patient-specific understanding of the disease. While tasks with only small amounts of available training data
reviewing and evaluating these monitoring data is a highly [42, 43]. Moreover, this work can be applied and expanded
time- and cost-intensive process for doctors, the use of to multicenter data analysis similar to [44, 45]; a larger
computer-assisted detection of tic movements can save time research platform may result in additional interesting re-
and cost, empower doctors to optimize and adjust medi- search works.
cation responses, and help establish a good evaluation and
management process for patients. Our work is the first
 5. Conclusions
application of a deep learning for video-based assessment of
Tourette syndrome. In this work, we introduce the first application of a deep
 As the above experimental evaluations show, our learning method that combines unsupervised and super-
video-based architecture possesses the ability to detect vised learning for video-based facial tic motion detection
motor tic events in TS from videos acquired in a natural in TS patients. The developed model achieved good
state. In the classification tasks, we detected two kinds of classification results on both multiclass and binary clas-
tics that occur most often in patients. Although the sification tasks; it can both detect and classify facial tic
multiclass classification task involves limited motor tic behaviors. This study effectively utilized large amounts of
categories in our dataset, it represents a unique result: to unlabeled data, which greatly reduced the labeling
the best of our knowledge, no other similar research that workload. A subsequent quantification of tic behavior has
has used surveillance video data for automatic tic rec- potential clinical application value for early identification
ognition and classification exists. In the evaluation of and auxiliary diagnosis and evaluation of treatment effects.
subsequent results of the model, we defined some items In the future, more video data will be collected and used to
that frequently appeared on the tic scales applied on these evaluate our scheme.
model outcomes and obtained consistent results with
those from clinicians based on the MRVRS, which shows
the ability to integrate observation-based scales or Data Availability
screening instruments for tics, although our current The TS video data used to support the findings of this study
dataset limited a part of it. If we expand to audio data in are restricted by the Ethics Committee of the Second Af-
the near future, it could be more comprehensive for filiated Hospital of Zhejiang University School of Medicine
developing an automatic rating scale of tics. For the binary to protect the patient privacy. The data are not publicly
classification task, it achieved good accuracy on video- available due to ethical restrictions.
clip-based recognition; however, it needs more video data
for individual tests and other clinical data to support its
outstanding performance in computer-aided diagnosis. Conflicts of Interest
 From our perspective, this work has application pros-
pects from two main aspects: (a) automatic annotation of a The authors declare that there are no conflicts of interest
video TS dataset. Because our classification task is based on regarding the publication of this paper.
small video clips, the task model can be used to prelabel the
video and can then be checked by a doctor in a subsequent Acknowledgments
continuous data collection task, thereby reducing the doc-
tor’s labeling workload and accelerating the accumulation of This work was supported by the National Key Research and
labeled data. (b) Home-based health management applica- Development Program of China (No. 2018YFC0116901), the
tions: the extensive use of monitoring cameras makes it National Natural Science Foundation of China (Nos.
possible to extend this work to home-based health moni- 81771936 and 81801796), the Fundamental Research Funds
toring and management since acquiring video at home for the Central Universities (No. 2021FZZX002-18), the
enhances the retrieval of objective tic expression [41]. In this Major Scientific Project of Zhejiang Lab (No.
case, object recognition and tracking, multiangle analysis, 2020ND8AD01), and the Youth Innovation Team Project of
body tic detection, etc. all need to be considered and re- the College of Biomedical Engineering and Instrument
solved. Furthermore, noise reduction and voice extraction Science, Zhejiang University.
are also significant for voice tic detection. A home-based tic
surveillance system allows doctors and family members to Supplementary Materials
better manage and provide more effective treatments for
patients with tics who are undergoing long-term observation Figure S1: Distribution diagram of the TS dataset, including
and treatment. the unlabeled dataset and the labeled dataset. The upper
 The inadequacy of labeled data is a clear limitation to panel shows the frame distribution of every patient video,
future work and constitutes a weakness that we alleviate and the lower panel shows the time distribution of the videos
through unsupervised learning methods. We will continue in the TS dataset. (Supplementary Materials)
Journal of Healthcare Engineering 9

References [15] O. Rose, A. Hartmann, Y. Worbe, J. M. Scharf, and K. J. Black,
 “Tourette syndrome research highlights from 2018,”
 [1] M. M. Robertson, V. Eapen, H. S. Singer et al., “Gilles de la F1000Research, vol. 8, p. 988, 2019.
 Tourette syndrome,” Nature Reviews Disease Primers, vol. 3, [16] T. Pringsheim, M. S. Okun, K. Müller-Vahl et al., “Practice
 no. 1, 2017. guideline recommendations summary: treatment of tics in
 [2] B. S. Peterson and J. F. Leckman, “The temporal dynamics of people with Tourette syndrome and chronic tic disorders,”
 tics in Gilles de la Tourette syndrome,” Biological Psychiatry, Neurology, vol. 92, no. 19, pp. 896–906, 2019.
 vol. 44, no. 12, pp. 1337–1348, 1998. [17] J. B. Shute, M. S. Okun, E. Opri et al., “Thalamocortical
 [3] L. Scahill, M. Specht, and C. Page, “The prevalence of tic network activity enables chronic tic detection in humans with
 disorders and clinical characteristics in children,” Journal of Tourette syndrome,” NeuroImage: Clinical, vol. 12, pp. 165–
 Obsessive-Compulsive and Related Disorders, vol. 3, no. 4, 172, 2016.
 pp. 394–400, 2014. [18] A. Barua, C. Dong, and X. Yang, “A deep learning approach
 [4] M. Bernabei, G. Andreoni, M. O. Mendez Garcia et al., for detecting tic disorder using wireless channel information,”
 “Automatic detection of tic activity in the Tourette Syn- Transactions on Emerging Telecommunications Technologies,
 drome,” in Proceedings of the 2010 Annual International vol. 10, Article ID e3964, 2020.
 Conference of the IEEE Engineering in Medicine and Biology, [19] K. Simonyan and A. Zisserman, “Two-stream convolutional
 pp. 422–425, Québec, Canada, July 2010. networks for action recognition in videos,” 2014, http://arxiv.
 [5] D. Martino, T. M. Pringsheim, A. E. Cavanna et al., “Sys- org/abs/1406.2199.
 tematic review of severity scales and screening instruments for [20] C. Feichtenhofer, A. Pinz, and A. Zisserman, “Convolutional
 two-stream network fusion for video action recognition,” in
 tics: critique and recommendations,” Movement Disorders,
 Proceedings of the 2016 IEEE Conference on Computer Vision
 vol. 32, no. 3, pp. 467–473, 2017.
 and Pattern Recognition (CVPR), pp. 1933–1941, Las Vegas,
 [6] F. M. J. Pfister, T. T. Um, D. C. Pichler et al., “’High-resolution
 NV, USA, June 2016.
 motor state detection in Parkinson’s disease using convolu-
 [21] C. Lea, M. D. Flynn, R. Vidal, A. Reiter, and G. D. Hager,
 tional neural networks,” Scientific Reports, vol. 10, no. 1, 2020. “Temporal convolutional networks for action segmentation
 [7] D. Ahmedt-Aristizabal, S. Denman, K. Nguyen, S. Sridharan, and detection,” in Proceedings of the 2017 IEEE Conference on
 S. Dionisio, and C. Fookes, “’Understanding patients’ be- Computer Vision and Pattern Recognition (CVPR),
 havior: vision-based analysis of seizure disorders,” IEEE pp. 1003–1012, Honolulu, HI, July 2017.
 Journal of Biomedical and Health Informatics, vol. 23, no. 6, [22] D. Tran, L. Bourdev, R. Fergus, L. Torresani, and M. Paluri,
 pp. 2583–2591, 2019. “Learning spatiotemporal features with 3D convolutional
 [8] B. Soran, L. Lowes, and K. M. Steele, “Evaluation of infants networks,” 2014, http://arxiv.org/abs/1412.0767.
 with spinal muscular atrophy type-I using convolutional [23] A. Diba, “Temporal 3D ConvNets: new architecture and
 neural networks,” in Proceedings of the Lecture Notes in transfer learning for video classification,” 2017, http://arxiv.
 Computer Science in Computer Vision – ECCV 2016 Work- org/abs/1711.08200.
 shops, pp. 495–507, Amsterdam, The Netherlands, October [24] J. Carreira and A. Zisserman, “Quo Vadis, action recognition?
 2016. a new model and the kinetics dataset,” 2018, http://arxiv.org/
 [9] Y. Sun, D. Kommers, W. Wang et al., “Automatic and abs/1705.07750.
 continuous discomfort detection for premature infants in a [25] Z. Liu, “TEINet: towards an efficient architecture for video
 NICU using video-based motion analysis,” in Proceedings of recognition,” 2019, http://arxiv.org/abs/1911.09435.
 the 2019 41st Annual International Conference of the IEEE [26] J. Deng, W. Dong, R. Socher et al., “ImageNet: a large-scale
 Engineering in Medicine and Biology Society (EMBC), hierarchical image database,” in Proceedings of the 2009 IEEE
 pp. 5995–5999, Berlin, Germany, July 2019. Conference on Computer Vision and Pattern Recognition,
[10] J. F. Leckman, M. A. Riddle, M. T. Hardin et al., “The Yale pp. 248–255, Miami, Florida, June 2009.
 Global Tic Severity Scale: initial testing of a clinician-rated [27] K. Zhang, Z. Zhang, Z. Li, and Y. Qiao, “Joint face detection
 scale of tic severity,” Journal of the American Academy of Child and alignment using multitask cascaded convolutional net-
 & Adolescent Psychiatry, vol. 28, no. 4, pp. 566–573, 1989. works,” IEEE Signal Processing Letters, vol. 23, no. 10,
[11] C. G. Goetz, E. J. Pappert, E. D. Louis, R. Raman, and pp. 1499–1503, 2016.
 [28] Q. Cao, L. Shen, W. Xie, O. M. Parkhi, and A. Zisserman,
 S. Leurgans, “Advantages of a modified scoring method for
 “VGGFace2: a dataset for recognising faces across pose and
 the rush video-based tic rating scale,” Movement Disorders,
 age,” 2018, http://arxiv.org/abs/1710.08092.
 vol. 14, no. 3, pp. 502–506, 1999.
 [29] P. Bachman, R. D. Hjelm, and W. Buchwalter, “Learning
[12] H. Rickards, “Tics and fits. The current status of Gilles de la
 representations by maximizing mutual information across
 Tourette syndrome and its relationship with epilepsy,” Sei- views,” 2019, http://arxiv.org/abs/1906.00910.
 zure, vol. 4, no. 4, pp. 259–266, 1995. [30] A. Krizhevsky, I. Sutskever, and G. E. Hinton, “ImageNet
[13] P. B. Chappell, M. T. Mcswiggan-Hardin, L. Scahill et al., classification with deep convolutional neural networks,” in
 “’Videotape tic counts in the assessment of tourette’s syn- Advances in Neural Information Processing Systems 25,
 drome: stability, reliability, and validity,” Journal of the F. Pereira, C. J. C. Burges, L. Bottou, and K. Q. Weinberger,
 American Academy of Child & Adolescent Psychiatry, vol. 33, Eds., pp. 1097–1105, Curran Associates, Inc., New York, NY,
 no. 3, pp. 386–393, 1994. USA, 2012.
[14] D. Servello, M. Porta, M. Sassi, A. Brambilla, and [31] T. Chen, S. Kornblith, M. Norouzi, and G. Hinton, “A simple
 M. M. Robertson, “Deep brain stimulation in 18 patients with framework for contrastive learning of visual representations,”
 severe Gilles de la Tourette syndrome refractory to treatment: 2020, http://arxiv.org/abs/2002.05709.
 the surgery and stimulation,” Journal of Neurology, Neuro- [32] G. Hinton, O. Vinyals, and J. Dean, “Distilling the knowledge
 surgery & Psychiatry, vol. 79, no. 2, pp. 136–142, 2008. in a neural network,” 2015, http://arxiv.org/abs/1503.02531.
10 Journal of Healthcare Engineering

[33] K. He, X. Zhang, S. Ren, and J. Sun, “Deep residual learning
 for image recognition,” 2015, http://arxiv.org/abs/1512.03385.
[34] T.-Y. Lin, P. Goyal, R. Girshick, K. He, and P. Dollár, “Focal
 loss for dense object detection,” 2018, http://arxiv.org/abs/
 1708.02002.
[35] K. He, H. Fan, Y. Wu, S. Xie, and R. Girshick, “Momentum
 contrast for unsupervised visual representation learning,”
 2020, http://arxiv.org/abs/1911.05722.
[36] Z. Wu, Y. Xiong, S. Yu, and D. Lin, “Unsupervised feature
 learning via non-parametric instance-level discrimination,”
 2018, http://arxiv.org/abs/1805.01978.
[37] D. P. Kingma and J. Ba, “Adam: a method for stochastic
 optimization,” 2020, http://arxiv.org/abs/1412.6980.
[38] “torchvision.models — torchvision master doc-
 umentation.”https://pytorch.org/vision/stable/models.html.
[39] L. Wang, “Temporal segment networks: towards good prac-
 tices for deep action recognition,” 2016, http://arxiv.org/abs/
 1608.00859.
[40] R. R. Selvaraju, M. Cogswell, A. Das et al., “Grad-CAM: visual
 explanations from deep networks via gradient-based locali-
 zation,” International Journal of Computer Vision, vol. 128,
 no. 2, pp. 336–359, 2020.
[41] C. G. Goetz, S. Leurgans, and T. A. Chmura, “Home alone:
 methods to maximize tic expression for objective videotape
 assessments in Gilles de la Tourette syndrome,” Movement
 Disorders, vol. 16, no. 4, pp. 693–697, 2001.
[42] Y. Wang, Q. Yao, J. Kwok, and L. M. Ni, “Generalizing from a
 few examples: a survey on few-shot learning,” 2020, http://
 arxiv.org/abs/1904.05046.
[43] D. Chen, Y. Chen, Y. Li, F. Mao, Y. He, and H. Xue, “Self-
 supervised learning for few-shot image classification,” 2020,
 http://arxiv.org/abs/1911.06045.
[44] J. Wang, Q. Wang, J. Peng et al., “Multi-task diagnosis for
 autism spectrum disorders using multi-modality features: a
 multi-center study,” Human Brain Mapping, vol. 38, no. 6,
 pp. 3081–3097, 2017.
[45] W. Wu, Y. Zhang, J. Jiang et al., “An electroencephalographic
 signature predicts antidepressant response in major depres-
 sion,” Nature Biotechnology, vol. 38, no. 4, pp. 439–447, 2020.
You can also read