Machine learning prediction of sleep stages in dairy cows from heart rate and muscle activity measures
←
→
Page content transcription
If your browser does not render page correctly, please read the page content below
www.nature.com/scientificreports
OPEN Machine learning prediction
of sleep stages in dairy cows
from heart rate and muscle activity
measures
Laura B. Hunter1,3,4*, Abdul Baten2,5, Marie J. Haskell4, Fritha M. Langford4,
Cheryl O’Connor1, James R. Webster1 & Kevin Stafford3
Sleep is important for cow health and shows promise as a tool for assessing welfare, but methods to
accurately distinguish between important sleep stages are difficult and impractical to use with cattle
in typical farm environments. The objective of this study was to determine if data from more easily
applied non-invasive devices assessing neck muscle activity and heart rate (HR) alone could be used
to differentiate between sleep stages. We developed, trained, and compared two machine learning
models using neural networks and random forest algorithms to predict sleep stages from 15 variables
(features) of the muscle activity and HR data collected from 12 cows in two environments. Using k-fold
cross validation we compared the success of the models to the gold standard, Polysomnography
(PSG). Overall, both models learned from the data and were able to accurately predict sleep stages
from HR and muscle activity alone with classification accuracy in the range of similar human models.
Further research is required to validate the models with a larger sample size, but the proposed
methodology appears to give an accurate representation of sleep stages in cattle and could
consequentially enable future sleep research into conditions affecting cow sleep and welfare.
Animals are driven to sleep and it is vital that enough restful sleep is achieved to feel r eplenished1. Feelings of
exhaustion, tiredness and sleeplessness can impact negatively on animal w elfare2. Health can also be significantly
impacted by sleep loss (sleep deprivation or restriction), which can result in activation of the immune and inflam-
matory systems3 and also influence pain sensitivity and p erception4 in both humans and animals.
We know very little about the importance of sleep and the effects of limited or poor-quality sleep for dairy
cows. Broadly, it is likely that factors affecting lying behaviour will also influence sleep, as cows must lie down to
achieve it5. Sleep can be affected by stressful experiences during the d ay6. Therefore, changes to sleep patterns or
total sleep time in cattle could be useful indicators for stress and other welfare concerns. The ability to identify
sleep stages accurately could enable research on the effects of sleep loss for cows and could be useful to inform
management practices such as determining rest intervals during long-haul transport or management of cattle
during wet weather (i.e. on standoff pads).
Sleep consists of two main types: rapid eye movement (REM) and non-REM (NREM) sleep. The most accurate
method of identifying sleep types is polysomnography (PSG)7,8, which consists of a combination of physiologi-
cal measurements; mainly electroencephalography (EEG), electromyography (EMG), and electro-oculography
(EOG), which record electrical signals of the brain, as well as muscle and eye activity. Using specialized software,
traces from these signals are analyzed and scored visually using characteristic patterns to determine sleep stages
according to defined criteria. REM sleep is a deep sleep stage, where the brain is active, the muscle tone is low
and there are often frequent eye movements. The majority of human total sleep time is spent in NREM sleep,
which can be further divided by ‘depth’ into 3 stages from light—N1 and N2 sleep to deep N3 or slow wave sleep
(SWS). SWS is characterized by high amplitude oscillating activity on the EEG accompanied by lower muscle
tone and lack of eye movements. Many of the restorative functions of sleep are thought to occur in this s tage9.
1
Animal Behaviour and Welfare, AgResearch Ltd., Ruakura Research Centre, Hamilton, Waikato, New
Zealand. 2Bioinformatics and Statistics, AgResearch Ltd., Grasslands Research Centre, Palmerston North,
Manawatu, New Zealand. 3Department of Animal Science, School of Agriculture and Environment, Massey
University, Palmerston North, Manawatu, New Zealand. 4Animal Behaviour and Welfare, Scotland’s Rural College
(SRUC), Edinburgh, Scotland, UK. 5Institute of Precision Medicine and Bioinformatics, Sydney Local Health
District, Royal Prince Alfred Hospital, Camperdown, NSW 2050, Australia. *email: laura.hunter@agresearch.co.nz
Scientific Reports | (2021) 11:10938 | https://doi.org/10.1038/s41598-021-90416-y 1
Vol.:(0123456789)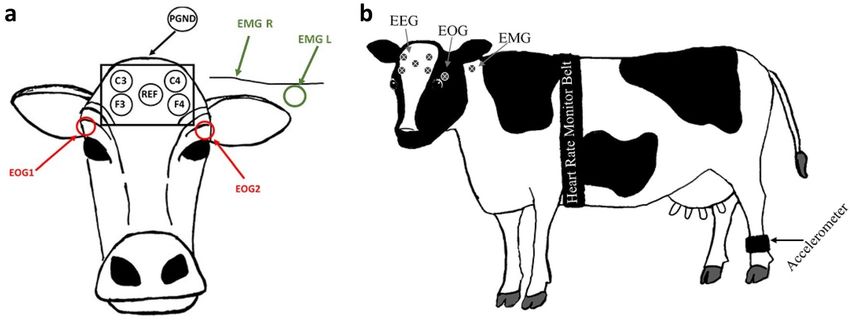
www.nature.com/scientificreports/
Model AUC (%) CA (%) F1 Precision (%) Recall (%)
Neural network 92.5 82.3 0.814 81.5 82.3
Random forest 92.6 82.1 0.805 81.3 82.1
Table 1. Overall performance of the neural network and random forest models across all sleeping stages
(average over classes) in terms of area under the curve (AUC), classification accuracy (CA), F1 score, precision,
and recall (sensitivity).
Dairy cows have been found to sleep for approximately 3–4 h per day, but only around 30 min of this in REM
sleep10,11. Therefore, most of the sleep time also consists of NREM sleep stages and it is likely that these stages
serve important functions for cows as they do humans.
PSG has recently been used to record sleep in calves12 and cows10 in indoor-housed environments. However,
it requires a considerable amount of training to habituate the animal to wearing the equipment, and this with
intensive handling, delicate and expensive devices, specialized scoring and frequent monitoring, makes PSG
impractical for large research projects on cows in uncontrolled environments such as in typical group-housed
farms and outdoors on pasture. No recent studies have attempted to record non-invasive PSG of sleep of cows
on pasture, probably because of the difficulty in using these instruments with cows let alone in challenging and
variable outdoor conditions. An ideal solution would be an alternative method or proxy for PSG, more easily
applied in a variety of environments and less intensive than PSG. As cows must lie down to s leep5, lying posture
has been suggested as such a proxy. In calves that spend a lot more time in deep sleep stages, lying with head up
and immobile and lying with the head resting on the ground or turned and resting on the flank were found to be
able to estimate SWS and REM sleep time r espectively12. However, these same postures greatly over-estimated
total sleep time in adult c ows13 and were unable to accurately detect NREM sleep. Further methods based on
accelerometers to collect movement and position data from devices on the head or neck of calves and c ows14–16
have been developed to predict sleep. However, while these models have shown some success in detecting the
tucked lying posture during which most REM sleep occurs, they overestimate total sleep time and lack the ability
to distinguish differences between light and deep NREM sleep, as well as wakeful inactivity. Additionally, these
methods have only been validated with postural estimates of sleep and not with PSG.
During mammalian sleep, autonomic nervous activity such as heart rate17–19, respiration rate20 and body
temperature change with sleep stage. Machine learning has been used to develop wearable technology for humans
such as smart watches that use heart rate and activity to predict human sleep stages and duration21. Therefore, the
potential exists to use similar physiological changes to identify different sleep stages in cows. In dairy cows, respi-
ration rate and body temperature can be recorded for long periods of time, but are d ifficult22 or require invasive
internal devices. Heart rate (HR) and heart rate variability (HRV) recording devices are relatively inexpensive
and unobtrusive to the cow and can be worn for long periods of t ime23,24. Methods using machine learning to
predict sleep stage from HR and HRV have been developed recently for humans19,25, and methods combining
HR with other measures such as actigraphy further increase performance for sleep stage identification26.
We collected HR, lying behaviour and PSG data simultaneously from two groups of cows, housed indoors and
on pasture. The aim of this project was to determine if we could accurately differentiate between different stages
of light and deep sleep in dairy cows using only HR and neck muscle EMG data, compared to visual scoring of
the PSG, and to compare the success of two machine learning algorithms in this task.
Results and discussion
EEG is the recognized ‘gold standard’ to determine sleep stages however, a complicated and painstaking setup is
required which makes it prohibitive to use for determining sleep stages in cows. The objective of this study was to
determine the efficacy of using heart rate and neck muscle activity to determine cow sleep stages using machine
learning. To our knowledge, this is the first study of its kind aimed to detect cow sleep stages using only heart
and neck muscle data. Using this data alone, the machine learning models developed were able to predict 82.3%
of sleep stages correctly. Classification performance of the machine learning models presented in this paper is
similar to Mitsukura et al.27, which proposed models to detect human sleep stages using only heart rate data.
Table 1 shows the values used to compare both machine learning models. The neural network (NN) analysis
produced the best overall performance and had an area under the curve (AUC) value of 92.5%. Classification
accuracy was 82.3%. precision was 81.5%, recall was 82.3% and F1 score was 0.814. The prediction accuracy of
the NN model is just marginally better than that of random forest (RF) which produced 82.1% classification
accuracy and a slightly better AUC value of 92.6%. Both neural network and random forest algorithms show the
ability to learn reasonably well from the data and discriminate well between various sleep stages.
Table 2 shows the CA and AUC of both models to predict the sleep/wakes stages individually. In terms of
AUC, Awake and REM stages were the most accurately detected with a 94% and 92% chance of scoring cor-
rectly. The models had slightly more difficulty identifying NREM sleep stages; however, AUC was remained at
90%. Figure 1 shows the ROC curves for the classification of each individual sleep stage by both NN and RF
models. Classification accuracy for N3 and REM stages were above 95%, with awake and N1/2 ranging from 85
to 88%. Individually, N3 and light N1/2 sleep were slightly more difficult to predict according to the classifica-
tion performance of various models in our dataset. As previously discussed, this could be due to errors in sleep
scoring from the PSG, however NREM sleep stages are the least different from one another physiologically, so
it is possible that there is a significant overlap with other sleep stages in the heart rate and neck muscle activity.
Scientific Reports | (2021) 11:10938 | https://doi.org/10.1038/s41598-021-90416-y 2
Vol:.(1234567890)www.nature.com/scientificreports/
Awake N1/2 N3 REM
Model AUC (%) CA (%) AUC (%) CA (%) AUC (%) CA (%) AUC (%) CA (%)
Neural network 94.7 88.4 90.8 85.2 90.2 95.3 92.4 95.8
Random forest 94.4 87.2 91.1 85.5 90.4 95.7 92.3 95.9
Table 2. Performance of both models (neural network and random forest) for individual sleep stages (awake,
combined light NREM sleep (N1/2), N3 (SWS) and rapid eye movement sleep (REM)) in terms of area under
the receiver operator curve (AUC) and classification accuracy (CA).
Figure 1. ROC curves of the Neural Network and Random forest models for detection of each individual sleep
stage. (a) Awake stage, (b) combined light sleep stages N1/2, (c) slow wave sleep- N3 stage and (d) REM sleep
stage. Figure created using Orange (version 3.26) https://orangedatamining.com/.
Our methodology involved spending a significant amount of time prior to the beginning of data collection
gentling and handling the cows who had previously been unused to such an amount of human contact and
training them to wear unfamiliar materials and instruments. Even with these efforts, a large amount of recorded
data was then unusable due to cows rubbing electrodes off on gates, water buckets or when lying or moving,
unpredictable cow behaviour, or issues with electrode impedance and the devices that could only be determined
after the recording. We collected a total of 23,123 useable 30 s epochs (approximately 192 h) of PSG, HR, and
activity data from a total of 12 cows in two different environments—housed indoors in the UK and on pasture
in New Zealand. As there are no widely used scoring criteria for cows as there are for humans, previous work on
Scientific Reports | (2021) 11:10938 | https://doi.org/10.1038/s41598-021-90416-y 3
Vol.:(0123456789)www.nature.com/scientificreports/
Awake 16,584 71.72%
N1/2 4401 19.03%
N3 1034 4.47%
REM 1104 4.77%
Total 23,123 100%
Table 3. Number of data points and overall percent of data points at each sleep stage in the dataset.
cow sleep10–12,28 as well as human American Association of Sleep Medicine (AASM)2018 guidelines29 were used
to define sleep stages. Previous cow PSG studies have only identified REM sleep, SWS and ‘drowsing’, however
definitions of drowsing and implications for sleep and cow welfare are u nclear10,30. Labelling of the sleep stages
based on visual analysis of the PSG traces is accepted as common practice in human sleep scoring, however, it
can be somewhat subjective and there can be a degree of disagreement even between highly experienced human
sleep scoring technicians using clearly defined c riteria31. A study of inter-rater reliability of human sleep using
AASM guidelines found an overall agreement of 82.0% and Cohen’s kappa = 0.7632 and a study of intra-expert
scoring of spindles from light sleep found agreement of 72% with k = 0.6633. These kappa figures suggest high,
but not perfect agreement between observers. Overall intra-observer agreement for scoring sleep/awake stages
from the PSG traces in this study was 89.42%, however, N1 and N2 were the least reliable as only 32% of epochs
were agreed, and 39% of N1 were re-scored as N2. Combining N1 and N2 improved agreement to 91.1%. Despite
an ‘almost perfect’ level of intra-observer r eliability34, even when combining N1 and N2 stages, 8.9% of epochs
were disagreed upon when re-scoring PSG. There is therefore a margin of error introduced into the model due
to mistakes in scoring and labelling data from the PSG which was used as the ‘ground truth’ with which to train
the model. However, with visual analysis there is always likely to be a degree of human error associated with
the scoring.
Machine learning has also been used to classify sleep stages in animals such as m ice35 and rats36 using spectral
aspects of the EEG signals, so this could be attempted in future sleep stage labelling of cow PSG data.
Cows are ruminants and must regurgitate and re-chew their food to obtain energy. Because of their strong
jaw muscle movements, distinct rhythmic chewing artefacts obscure the PSG traces making accurate identifica-
tion of any potential sleep stages during rumination or chewing impossible. For this reason, epochs containing
rumination were excluded from the dataset and therefore the current model is only able to identify vigilance
state from data when rumination is absent. Future models could be modified to predict rumination, however
sleep stage estimation during this time would be impacted by the artefacts on the EMG traces.
The data set was heavily weighted to the awake stage. As shown in Table 3, around 70% of the data set con-
sisted of awake data with the other 30% consisting of sleep, and less than 5% of data points being in REM or N3
sleep stages. We made recordings during both day and night and included all recorded data of sufficient quality
in the data set. Most cow sleep occurs at night-time, with small bouts of sleep during the day, and in total only
about 4 h per day is spent s leeping11. Being so heavily weighted to the awake stage, the models had many more
examples to learn from to identify Awake epochs, but far fewer examples from which to learn to identify N3 or
REM sleep epochs. Balancing the dataset in terms of sleep and awake stages equally might help future models
to learn better by having more examples of less common sleep stages.
We used 15 different features of the heart rate and EMG data and the machine learning models were able
to learn from this and discriminate between various sleep stages. Classification models learn and perform well
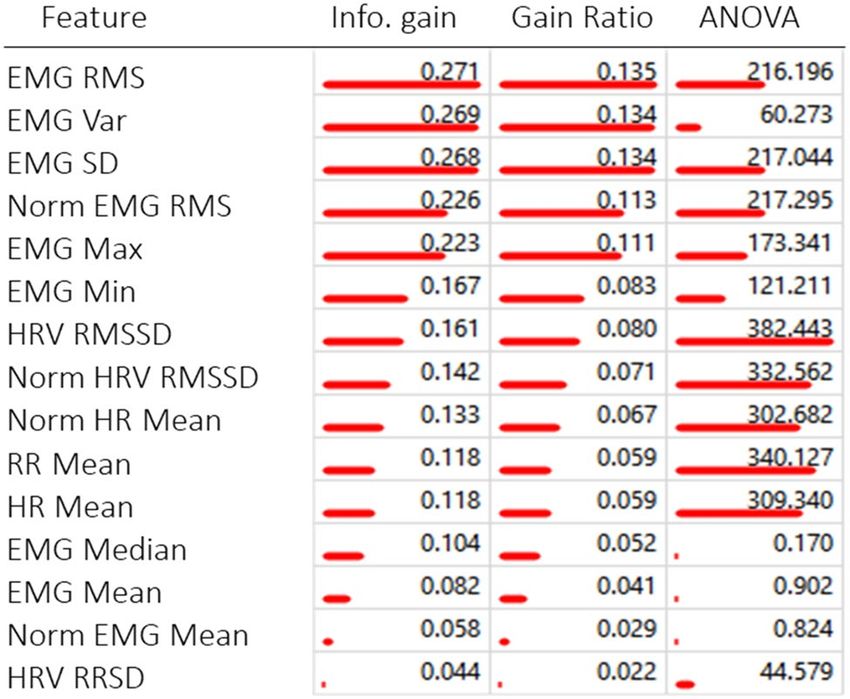
when there is a significant difference between features in various classes. Table 4 shows the rank of each feature
calculated in terms of information gain (the expected amount of information or entropy), gain ratio (a ratio
of the information gain and the attribute’s intrinsic information, which reduces the bias towards multivalued
features that occurs in information gain) and ANOVA (the difference between average values of the feature in
different classes). The features of our dataset that were the most informative for the machine learning models were
mainly the Neck EMG features (Neck RMS, Neck Variance, and Neck Standard Deviation). The highest scoring
features of our dataset were the Neck EMG features (Neck RMS, Neck Variance, and Neck Standard Deviation).
A reduction of muscle tone in the neck muscles is a classical indicator used for the visual identification of REM
sleep from PSG data. The higher AUC and accuracy values for the prediction of REM sleep compared to other
sleep stages may be due to the high rank of the neck EMG features (Table 2). Mitsukura et al.27 predominantly
used frequency domain features of the HRV signal for sleep stage classification in humans, and it is possible that
frequency domain features could be useful for cow sleep staging as well. However, we only used time domain
features of the HRV as we were working from 30 s epochs, which is arguably too short of a window to calculate
frequency domain metrics from. Frequency metrics are usually calculated for 5 min periods, and while it could
be possible to increase epoch size to 5 min to allow for these calculations, this would reduce the granularity and
possibly result in longer epochs containing several sleep stages as some bouts of individual stages have durations
of less than 2 min. Long epochs consisting of multiple stages could also introduce confusion into the model
resulting in more misclassification.
The classification models were developed with data from two separate groups of cows which were different in
terms of breed, age, housing, and previous experience. All cows were non-lactating, but the Kiwi-cross (NZ) cows
were also in mid-late pregnancy during the recording period. There were differences between the two popula-
tions in terms of average HR and the Kiwi-cross cows generally had a higher heart rate than the UK group. These
differences could be due to age, size of cows and pregnancy status, but highlights the possibility of hidden batch
Scientific Reports | (2021) 11:10938 | https://doi.org/10.1038/s41598-021-90416-y 4
Vol:.(1234567890)www.nature.com/scientificreports/
Table 4. Ranking of features in the dataset from overall most informative to least and ranking by each
calculation; info gain, gain ration and ANOVA (redlines). Table produced using Orange (version 3.26) https://
orangedatamining.com/.
effects within the model. More training data from different populations of cows, and cows in different stages of
lactation would be beneficial to increase confidence in the classification ability of the model.
Sleep in mammals typically occurs in cycles with REM sleep following a bout of NREM however, NREM sleep
can also occur on its o wn37. Sleep is regulated homeostatically, but achieving a certain amount of REM sleep
does not necessarily mean that a proportionate amount of NREM will also be a chieved37. In the development of
the models, we considered each 30 s epoch independently, however, they are in a time series and make up bouts
lasting from a few minutes to a few hours. Preceding epoch classification therefore could have an influence on
the classification decision for the successive epoch. Information on typical cow sleep patterns and bout lengths
could possibly aid in future models to predict sleep stages in cows.
The current model is a marked improvement over sleep staging models for cows using only accelerometers
to predict NREM and REM developed in the past that were only able to predict up to 70% of sleep correctly14.
These models also used behavioural observations to label sleep stages, which has been shown to overestimate
sleep in cows13. Our models have been developed with sleep stages labelled using PSG rather than behavioural
observations, and while not as simple as accelerometers, EMG and HR monitoring equipment are small and far
easier to use with cows than a full PSG montage.
We investigated the use of non-invasively acquired EMG and HR data to predict sleep stages from light N1/2
sleep to deep N3 and REM sleep in dairy cows. While these models have been developed with a small sample
size, our classification models developed with Neural Network and Random Forrest algorithms achieved simi-
lar outcomes, both with good accuracy, suggesting neck EMG and HR data could be suitable to predict sleep
stage with some reliability in dairy cows. More data from cows of different breeds, ages and lactation stages
would be beneficial to improve future models. We believe the use of HR and Neck EMG is promising for future
identification of sleep stages in dairy cows from non-invasive physiological recording devices. This will enable
future research into the effects of typical husbandry practices, transport and environment on cow sleep and the
importance of sleep for cow health and welfare.
Methods
Animals and on farm management. Ethical approval for all procedures involving animals was obtained
from the UK Home Office (Project Licence P204B097E), SRUC Animal Ethics Committee (Ref. ED AE 03-2018)
and Ruakura Animal Ethics committee (AE 14708) prior to study onset. All methods were carried out in accord-
ance with UK and New Zealand animal welfare guidelines and regulations and the authors have complied with
the ARRIVE guidelines.
The indoor study was conducted with 6 non-pregnant, Holstein cows (average age 3.86 ± 0.68 years) who
were selected from the herd at SRUC Acrehead Farm (Dumfries, Scotland) based on farm staff knowledge of
their approachable nature. When enrolled, the cows were either non-lactating or dried off according to routine
farm practice prior to the study and were housed in a 20 m × 5 m group pen, deep bedded with straw, within the
main barn and fed as per routine farm practice. A 5 m × 5 m test pen was located adjacent to the group pen, but
could be separated by a buffer zone of approximately 2 m to reduce potential damage to recording equipment and
disruptions to the recordings of other cows, while maintaining visual and auditory contact with the group (Fig. 2).
The protocol was then repeated at pasture with six approachable, mid-late pregnant, non-lactating three-year-
old Kiwi-cross (Friesian-Jersey) cows selected from the herd at DairyNZ Lye Farm (Newstead, NZ). These cows
were managed outdoors in a large (44 m × 29 m) group pen created with electric fencing that could be moved
around within a larger paddock as ground conditions deteriorated. A 10 m × 10 m test pen was created with
Scientific Reports | (2021) 11:10938 | https://doi.org/10.1038/s41598-021-90416-y 5
Vol.:(0123456789)www.nature.com/scientificreports/
Figure 2. Diagrams of group and test pen design in the UK indoor housed study (a) and in the NZ outdoor
pasture study (NZ) (b). During recordings, the test cow was moved into the test pen, when not recording, the
cow was moved back into to the group pen.
non-live electric fencing (to reduce potential electrical noise on physiological traces) on one side of the group
pen. A 2 m buffer zone with live electric fencing was set up around the test pen, allowing for visual and auditory
contact of the test cow with the group at all times (Fig. 2). Cows were allowed to graze and were supplemented
with silage ad libitum. All cows in both groups were trained and habituated to the recording devices and handling
protocols for a minimum of 2 weeks prior to the start of data collection.
Data collection methods. Polysomnography. PSG was recorded using a 10 electrode montage as de-
scribed in Hänninen et al.12. This included 4 EEG, 2 EOG and 2 EMG electrodes as well as a ground and refer-
ence electrode attached to the head and neck of the cow (Fig. 3). Adhesive pre-gelled ECG electrodes (Natus
neurology, Kanata, Canada) were used and secured to clipped and cleaned skin on the head and neck of the cow
with a small amount of superglue (Loctite 454 or Loctite gel control, Henkel Corp., Dublin, Ireland). A stretch-
able LeMieux® or Caribu Lycra horse hood (UK: Horse Health Wessex, Woodington, UK. NZ: Caribu AU, Tru-
ganina, Australia) was modified for the cow anatomy and worn on the head and neck over top of the electrodes
to keep all wires close to the skin and avoid being tangled in the test pen. After data collection was completed,
all materials were removed and electrodes either came away easily or were gently removed using acetone or
aqueous cream to soften the glue. Signals were sampled at 500 Hz and recordings ran for 10 h due to memory
capacity of the Embletta MPR PG + ST proxy recording device (Embla, Natus Neurology, Kanata, Canada). The
recording device was programmed, and data were downloaded using RemLogic 3.4.3 software (Embla Systems,
Kanata, Canada). After downloading, a 50 Hz mains filter was applied to all traces to remove the background
noise caused from electrical wires that are present in the environment and can be picked up by the PSG device,
in the UK and NZ electrical mains frequencies are both at 50 Hz. EEG traces were high pass and low pass filtered
at 0.3 Hz and 30 Hz, EOG traces were filtered at 0.15 Hz and 20 Hz and EMG at 10 Hz. Traces were first in-
spected for quality, “good” quality recordings included those where impedance was within the acceptable range
(> 14 Ω) and at least 2 EEG, 1 EMG and 1 EOG trace remained attached for the entire recording period. “Poor”
quality recordings were not scored and occurred when impedance was too high, there was noise on the traces,
many artefacts obscured the data or electrodes became detached during the recording. Traces were then scored
Scientific Reports | (2021) 11:10938 | https://doi.org/10.1038/s41598-021-90416-y 6
Vol:.(1234567890)www.nature.com/scientificreports/
Figure 3. (a) Diagram indicating electrode placement on the head and neck of the cow for PSG data
acquisition. Four EEG electrodes (C3, C4, F3 & F4) and a reference (REF) electrode were placed on the
forehead. PGND- patient grounding electrode was placed behind the poll on the top of the head. Two EOG
electrodes were placed beside the eyes and two EMG electrodes were placed on the mid-trapezius muscle on
either side of the neck. (b) Diagram indicating placement of the heart rate monitoring girth strap, leg mounted
accelerometer, and PSG electrodes on the whole cow.
visually in 30 s epochs into 4 stages of sleep (N1, N2, N3, REM), wakefulness (W) and rumination (RNT) by a
single scorer trained in human sleep staging, according to staging criteria developed from previous work on cow
sleep10–12,28 as well as human American Association of Sleep Medicine 2018 guidelines29.
Heart rate. Heart rate (HR) and inter-beat intervals (between R peaks of the heart beat signal: (R-R)) were
recorded using a Polar equine monitoring girth strap with electrodes near the heart and the reference electrode
near the shoulder (Fig. 3) and logged with the Polar RS800CX Watch (Polar Electro Oy, Kempele, Finland).
The time was synchronized between the watch and PSG recording devices. Ultrasound gel (Aquasonic 100 gel,
Parker Laboratories, NJ, USA) was applied liberally at electrode locations. Data were downloaded using Polar
Pro-Trainer 5 software (Polar Electro Oy, Finland). After downloading, the signal was filtered using Polar Pro-
trainer 5 at a moderate filter power with a minimum protection zone of 6 bpm. Only traces containing less than
1% identified errors were used for analysis. The filtered data were then extracted, and statistics were calculated
in 30 s epochs corresponding to the timestamps of the PSG epochs. Only the time domain metrics of the heart
rate variability were calculated, as the validity of frequency domain metrics in intervals smaller than the 5 min
standard are q uestionable38.
Lying behaviour. Lying and standing times were recorded continuously using an accelerometer (UK; IceTags
(Ice Robotics, Edinburgh, Scotland), NZ; Onset Pendant G data loggers (64 k, Onset Computer Corporation,
Bourne, MA) attached on the lower hind leg (Fig. 3). The data were downloaded using IceManager Software (Ice
Robotics, Edinburgh, Scotland) or HOBOware Pro software (Onset Corp., Pocasset, MA). Lying and standing
behaviour were determined from the data-logger files in 30 s epochs corresponding to the PSG epochs.
Data pre‑processing and segmentation. Neck muscle activity data was extracted from a single good
quality EMG trace per recording. Statistics were calculated for each epoch, including mean, maximum (max),
minimum (min), median (med), standard deviation (SD), variance (Var) and root mean square (RMS) using
RemLogic software.
Mean HR, mean R-R interval, Standard deviation of RR intervals (SDRR) and Root Mean Square of Succes-
sive Differences (RMSSD) (Eq. 1) were calculated from the exported and filtered polar heart rate data for each
30 s epoch corresponding to the PSG epochs.
�
2
�
N−1
� 1 �
�
RMSSD = � ((RR)i−1 − (RR)i ) (1)
N −1
i−1
Normalized HR mean, RMSSD, EMG mean, and EMG RMS values were also calculated by dividing the data
by the largest point for each individual recording as a way of removing some of the variation between cows and
between recordings. All 15 parameters or ‘features’ from the HR, HRV, EMG and lying behaviour data were
merged and matched with the scored sleep stage epochs using R Studio (Version 1.3.959) using time stamps
and epoch numbers.
Intra-observer reliability was calculated using Cohen’s kappa in the “irr” package in R (Version 4.0.2). Overall
agreement was 89.4% with k = 0.83however, N1 and N2 were the least reliable as only 32% of epochs were agreed,
and 39% were misidentified as N2. In exploration of the physiological data, N1 and N2 were not vastly visually
different in terms of mean and variance (Fig. 4), and so were combined into a new stage of light sleep named
Scientific Reports | (2021) 11:10938 | https://doi.org/10.1038/s41598-021-90416-y 7
Vol.:(0123456789)www.nature.com/scientificreports/
Figure 4. Box and whisker plots of each feature (titles), with sleep stage on the x-axis and relevant units
on the y-axis. The y-axis of HR mean, and Norm HR mean are expressed as beats per minute (BPM), while
RMSSD, RRSD and the normalized graph of these are expressed in milliseconds. The y-axis of all EMG graphs
is expressed in microvolts (µV)Figure produced in R version 4.0.2 using ggplot2 package https://cran.r-project.
org/web/packages/ggplot2/index.html.
‘N1/2’- to improve classification performance. Combination of N1 and N2 improved overall agreement to 91.1%
(k = 0.86). Rumination causes rhythmic chewing activity artefacts that obscure the PSG traces and make it impos-
sible to determine brain activity and sleep stage. It is possible that cows could achieve sleep during rumination,
which could create confusion and misclassification of the data, so for this reason it was removed from the data
set. Dairy cows must lie down to s leep5, therefore epochs determined as ‘standing’ from the accelerometer data
were also removed from the data set.
From visual and exploratory analysis of the data set, there were no clear differences between sleep stages
for any of the features. There were minor differences such as REM sleep tending to have a higher RMSSD than
other sleep stages, and the means of W were higher for max EMG, RMS EMG and SD EMG than for the other
sleep stages (Fig. 4).
Altogether there were 23,120 data points labelled into 4 different sleep stages (Awake, N1/2, N3 and REM)
each with corresponding data from the 15 different features (HR Mean, RR Mean etc.). Table 3 shows number
of data points for each sleep stage, the awake category has the greatest number (16,584) of data points, while the
combination of N1 and N2 (N1/2) had 4401 data points, REM had 1104 and N3 had 1034 data points.
Machine learning method for sleep stages. To predict cow sleep stages using only heart and neck
muscle data, we considered two machine learning techniques: Neural Network39, and Random Forest40. Both the
machine learning models were implemented using the open source Orange machine learning platform (Version
3.26)41. Stratified tenfold cross-validation was used to train and test the models.
Architecture of the Neural Network Model:
Scientific Reports | (2021) 11:10938 | https://doi.org/10.1038/s41598-021-90416-y 8
Vol:.(1234567890)www.nature.com/scientificreports/
Number of neurons in hidden layers: 500.
Activation function: ReLu.
Solver: Adam.
Regularization: 0.0001.
Maximal number of epochs/iterations: 2000.
During the cross-validation process, the whole dataset was randomly split into a labelled or ‘known sleep
stage’ data set to train the model with, the remaining data having the labels hidden and used to test the model
with. For example, REM had 1104 observations, approximately 110 observations were used for testing and rest
were used for training and this process was repeated 10 times for each sleep stage. The model’s predictions were
then compared with the actual labelled sleep stages to test and compare the models. Classification accuracy (CA)
(the number of correct predictions divided by the total number of predictions), recall (sensitivity or true positive
rate), precision (a measure of the model’s exactness), F1 score (the balance between Precision and Recall) and
area under the curve (AUC) determined from the receiver operator curve (ROC) values from each model were
used to measure the performance. The classification accuracy (Eq. 2), precision (Eq. 3), recall (Eq. 4) and F1
score (Eq. 5) were obtained from true negative (TN), false negative (FN), true positive (TP), and false positive
(FP) values. This process was repeated for 10 random splits or ‘folds’ and classification accuracy of each machine
learning technique was measured by taking the average across the 10 folds.
TP + TN
Classification Accuracy (CA) = (2)
TP + TN + FP + FN
TP
Precision = (3)
TP + FP
TP
Recall = (4)
TP + FN
2TP
F1 Score = (5)
2TP + FP + FN
Received: 5 February 2021; Accepted: 7 May 2021
References
1. Siegel, J. M. Clues to the functions of mammalian sleep. Nature 437, 1264–1271 (2005).
2. Mellor, D. J. & Beausoleil, N. J. Extending the ‘Five Domains’ model for animal welfare assessment to incorporate positive welfare
states. Anim. Welf. 24, 241–253 (2015).
3. Faraut, B., Boudjeltia, K. Z., Vanhamme, L. & Kerkhofs, M. Immune, inflammatory and cardiovascular consequences of sleep
restriction and recovery. Sleep Med. Rev. 16, 137–149 (2012).
4. Sardi, N. F. et al. Chronic sleep restriction increases pain sensitivity over time in a periaqueductal gray and nucleus accumbens
dependent manner. Neuropharmacology 139, 52–60 (2018).
5. Ruckebusch, Y. Sleep deprivation in cattle. Brain Res. 78, 495–499 (1974).
6. Langford, F. M. & Cockram, M. S. Is sleep in animals affected by prior waking experiences?. Anim Welf. 19, 215–222 (2010).
7. Drinkenburg, W. H. I. M., Ahnaou, A. & Ruigt, G. S. F. Pharmaco-EEG studies in animals: A history-based introduction to con-
temporary translational applications. Neuropsychobiology 72, 139–150 (2016).
8. Miano, S., Paolino, M. C., Castaldo, R. & Villa, M. P. Visual scoring of sleep: A comparison between the Rechtschaffen and Kales
criteria and the American Academy of Sleep Medicine criteria in a pediatric population with obstructive sleep apnea syndrome.
Clin. Neurophysiol. 121, 39–42 (2010).
9. Xie, L. et al. Sleep drives metabolite clearance from the adult brain. Science (80-. ) 342, 373–377 (2013).
10. Ternman, E., Hänninen, L., Pastell, M., Agenäs, S. & Nielsen, P. P. Sleep in dairy cows recorded with a non-invasive EEG technique.
Appl. Anim. Behav. Sci. 140, 25–32 (2012).
11. Ruckebusch, Y., Bell, F.-R., Barbey, P., Guillemot, P. & Serthelon, J.-P. ÉTUDE POLYGRAPHIQUE ET COMPORTEMENTALE
DES ÉTATS DE VEILLE ET DE SOMMEIL CHEZ LA VACHE (BOS TAURUS). Ann. Rech. Vet. 1, 41–62 (1970).
12. Hänninen, L., Mäkelä, J. P., Rushen, J., de Passillé, A. M. & Saloniemi, H. Assessing sleep state in calves through electrophysiological
and behavioural recordings: A preliminary study. Appl. Anim. Behav. Sci. 111, 235–250 (2008).
13. Ternman, E. et al. Agreement between different sleep states and behaviour indicators in dairy cows. Appl. Anim. Behav. Sci. 160,
12–18 (2014).
14. Klefot, J. M. et al. Development of a noninvasive system for monitoring dairy cattle sleep. J. Dairy Sci. 99, 8477–8485 (2016).
15. Fukasawa, M., Komatsu, T., Higashiyama, Y. & Oshibe, A. The use of accelerometer to measure sleeping posture of beef cows.
Anim. Sci. J. 89, 488–493 (2018).
16. Hokkanen, A. H., Hänninen, L., Tiusanen, J. & Pastell, M. Predicting sleep and lying time of calves with a support vector machine
classifier using accelerometer data. Appl. Anim. Behav. Sci. 134, 10–15 (2011).
17. Chouchou, F. & Desseilles, M. Heart rate variability: A tool to explore the sleeping brain?. Front. Neurosci. 8, 1–9 (2014).
18. Muzet, A. et al. Assessing sleep architecture and continuity measures through the analysis of heart rate and wrist movement
recordings in healthy subjects: Comparison with results based on polysomnography. Sleep Med. 21, 47–56 (2016).
19. Xiao, M., Yan, H., Song, J., Yang, Y. & Yang, X. Sleep stages classification based on heart rate variability and random forest. Biomed.
Signal Process. Control 8, 624–633 (2013).
20. Ebrahimi, F., Setarehdan, S. K. & Nazeran, H. Automatic sleep staging by simultaneous analysis of ECG and respiratory signals in
long epochs. Biomed. Signal Process. Control 18, 69–79 (2015).
21. Fiorillo, L. et al. Automated sleep scoring: A review of the latest approaches. Sleep Med. Rev. 48, 101204 (2019).
Scientific Reports | (2021) 11:10938 | https://doi.org/10.1038/s41598-021-90416-y 9
Vol.:(0123456789)www.nature.com/scientificreports/
22. Wu, D. et al. Detection of the respiratory rate of standing cows by combining the Deeplab V3+ semantic segmentation model with
the phase-based video magnification algorithm. Biosyst. Eng. 192, 72–89 (2020).
23. Kovács, L. et al. Heart rate and heart rate variability in multiparous dairy cows with unassisted calvings in the periparturient period.
Physiol. Behav. 139, 281–289 (2015).
24. Frondelius, L., Järvenranta, K., Koponen, T. & Mononen, J. The effects of body posture and temperament on heart rate variability
in dairy cows. Physiol. Behav. 139, 437–441 (2015).
25. Wang, Y. et al. Automatic identification of rapid eye movement sleep based on random forest using heart rate variability. Phys. A
Stat. Mech. Appl. 527, 121421 (2019).
26. Zhang, X. et al. Sleep stage classification based on multi-level feature learning and recurrent neural networks via wearable device.
Comput. Biol. Med. 103, 71–81 (2018).
27. Mitsukura, Y., Fukunaga, K., Yasui, M. & Mimura, M. Sleep stage detection using only heart rate. Health Inform. J. 26, 376–387
(2020).
28. Takeuchi, T., Sitizyo, K. & Harada, E. Analysis of the electroencephalogram in growing calves by use of power spectrum and cross
correlation. Am. J. Vet. Res. 59, 777–781 (1998).
29. Iber, C., Ancoli-Israel, S., Chesson, A. J. & Quan, S. The AASM Manual for the Scoring of Sleep and Associated Events: Rules Termi-
nology and Technical Specifications (American Association of Sleep Medicine, 2007).
30. Toutain, P. L. & Ruckebusch, Y. Sommeil paradoxal et environnement [Paradoxical sleep and environment]. C. R. Seances Soc.
Biol. Fil. 167, 550–554 (1973).
31. Collop, N. A. Scoring variability between polysomnography technologists in different sleep laboratories. Sleep Med. 3, 43–47
(2002).
32. Danker-Hopfe, H. et al. Interrater reliability for sleep scoring according to the Rechtschaffen & Kales and the new AASM standard.
J. Sleep Res. 18, 74–84 (2009).
33. Wendt, S. L. et al. Inter-expert and intra-expert reliability in sleep spindle scoring. Clin. Neurophysiol. 126, 1548–1556 (2015).
34. Landis, J. R. & Koch, G. G. The measurement of observer agreement for categorical data. Biometrics 33, 159 (1977).
35. Brankačk, J., Kukushka, V. I., Vyssotski, A. L. & Draguhn, A. EEG gamma frequency and sleep-wake scoring in mice: Comparing
two types of supervised classifiers. Brain Res. 1322, 59–71 (2010).
36. Crisler, S., Morrissey, M. J., Anch, A. M. & Barnett, D. W. Sleep-stage scoring in the rat using a support vector machine. J. Neurosci.
Methods 168, 524–534 (2008).
37. Le Bon, O. Relationships between REM and NREM in the NREM-REM sleep cycle: A review on competing concepts. Sleep Med.
70, 6–16 (2020).
38. Bourdillon, N., Schmitt, L., Yazdani, S., Vesin, J. M. & Millet, G. P. Minimal window duration for accurate HRV recording in
athletes. Front. Neurosci. 11, 1–9 (2017).
39. Lippmann, R. P. An introduction to computing with neural nets. IEEE ASSP Mag. 4, 4–22 (1987).
40. Breiman, L. Random forests. Mach. Learn. 45, 5–32 (2001).
41. Demšar, J. et al. Orange: Data mining toolbox in python. J. Mach. Learn. Res. 14, 2349–2353 (2013).
Acknowledgements
Technical assistance from farm staff and technicians is greatly appreciated; SRUC; Ainsley Bagnall, Sam Haining,
Camille Dubos, DairyNZ Lye Farm; Deanne Waugh, Stu Morgan, AgResearch; Rose Greenfield, Louis Luchier,
Trevor Watson, Briar Murphy. We also thank staff and students at AgResearch and SRUC Dairy Research Centre,
including David Bell, Laura Shewbridge-Carter and Holly Fergusson and Melissa Hempstead.
Author contributions
The study was conceived by L.H., M.H., F.L., C.O., J.W. and K.S. The experiments and data collection were run by
L.H. Development and testing of the machine learning models were conducted by A.B. The article was drafted by
L.H. and revised by M.H., A.B., C.O., F.L., J.W. and K.S. Drawings were prepared by L.H. All authors gave final
approval for publication and agree to be held accountable for this work.
Competing interests
The authors declare no competing interests.
Additional information
Correspondence and requests for materials should be addressed to L.B.H.
Reprints and permissions information is available at www.nature.com/reprints.
Publisher’s note Springer Nature remains neutral with regard to jurisdictional claims in published maps and
institutional affiliations.
Open Access This article is licensed under a Creative Commons Attribution 4.0 International
License, which permits use, sharing, adaptation, distribution and reproduction in any medium or
format, as long as you give appropriate credit to the original author(s) and the source, provide a link to the
Creative Commons licence, and indicate if changes were made. The images or other third party material in this
article are included in the article’s Creative Commons licence, unless indicated otherwise in a credit line to the
material. If material is not included in the article’s Creative Commons licence and your intended use is not
permitted by statutory regulation or exceeds the permitted use, you will need to obtain permission directly from
the copyright holder. To view a copy of this licence, visit http://creativecommons.org/licenses/by/4.0/.
© The Author(s) 2021
Scientific Reports | (2021) 11:10938 | https://doi.org/10.1038/s41598-021-90416-y 10
Vol:.(1234567890)You can also read