A machine learning framework for predicting drug-drug interactions - Nature
←
→
Page content transcription
If your browser does not render page correctly, please read the page content below
www.nature.com/scientificreports
OPEN A machine learning framework
for predicting drug–drug
interactions
Suyu Mei1* & Kun Zhang2*
Understanding drug–drug interactions is an essential step to reduce the risk of adverse drug events
before clinical drug co-prescription. Existing methods, commonly integrating heterogeneous data to
increase model performance, often suffer from a high model complexity, As such, how to elucidate
the molecular mechanisms underlying drug–drug interactions while preserving rational biological
interpretability is a challenging task in computational modeling for drug discovery. In this study, we
attempt to investigate drug–drug interactions via the associations between genes that two drugs
target. For this purpose, we propose a simple f drug target profile representation to depict drugs
and drug pairs, from which an l2-regularized logistic regression model is built to predict drug–drug
interactions. Furthermore, we define several statistical metrics in the context of human protein–
protein interaction networks and signaling pathways to measure the interaction intensity, interaction
efficacy and action range between two drugs. Large-scale empirical studies including both cross
validation and independent test show that the proposed drug target profiles-based machine learning
framework outperforms existing data integration-based methods. The proposed statistical metrics
show that two drugs easily interact in the cases that they target common genes; or their target genes
connect via short paths in protein–protein interaction networks; or their target genes are located at
signaling pathways that have cross-talks. The unravelled mechanisms could provide biological insights
into potential adverse drug reactions of co-prescribed drugs.
Drug–drug interactions (DDIs) have been recognized as a major cause of adverse drug reactions (ADRs) that
leads to rising healthcare costs1. Antagonistic drug–drug interactions may occur when a patient takes more than
one drug concurrently and potentially result in adverse side effects and toxicities2. In many cases, drug–drug
interactions are hardly detected during the clinical trial phase, and arbitrary co-prescription of drugs without
prior knowledge potentially poses serious threats to patient health and life3. Cytochrome-P450 (CYP450) iso-
forms (e.g., CYP1A2, CYP2C8, CYP2C9, CYP2C19, CYP2D6 and CYP3A4/5) take the responsibility to metabo-
lize the majority of available drugs and frequently cause antagonistic drug–drug interactions4. For instance,
CYP1A2 metabolizes both drug Theophylline and Duloxetine. If the stronger substrate Duloxetine competes
with the weaker substrate Theophylline to bind to the active site of CYP1A2, breakdown of Theophylline will be
reduced, leading to increased plasma levels of theophylline and potential side-effects like headache, nausea and
vomiting5. To reduce the risk of potential adverse drug reactions, it is crucial to examine in advance whether
co-prescribed drugs interact. Drug–drug interactions could be identified via in vitro or in vivo experiments as
well as in silico computational methods. However, the former two approaches are very costly and in some cases
are impossible to be carried out because the serious side effects DDIs elicited in experiments could do irrevers-
ible damages to human h ealth6. With the advancement of pharmacogenomics, recent years have witnessed
much effort to develop data-driven in silico computational methods to predict drug–drug interactions and their
efficacy, although the “black-box” machine learning and artificial intelligence models sometimes frustrates the
experimental pharmacologists in terms of multidisciplinary gap and practical s uccesses7
As regards drug–drug interactions, existing computational methods could be roughly classified into three cat-
egories, namely similarity-based m ethods8–11, networks-based m ethods12–16 and machine learning m ethods17–25.
Similarity-based methods directly infer drug–drug interactions on the basis of similarity scores between drug
profiles. Vilar et al.8 have reviewed several drug profiles, such as pharmaceutical profiles, gene expression profiles
and phenome profiles, which have been used to infer drug repurposing, drug adverse effects and drug–drug
interactions. Among these profiles, drug structural profiles could be well interpreted based on the assumption
1
Software College, Shenyang Normal University, Shenyang 110034, China. 2Bioinformatics Core of Xavier RCMI
Center for Cancer Research, Department of Computer Science, Xavier University of Louisiana, New Orleans,
LA 70125, USA. *email: meisygle@gmail.com; kzhang@xula.edu
Scientific Reports | (2021) 11:17619 | https://doi.org/10.1038/s41598-021-97193-8 1
Vol.:(0123456789)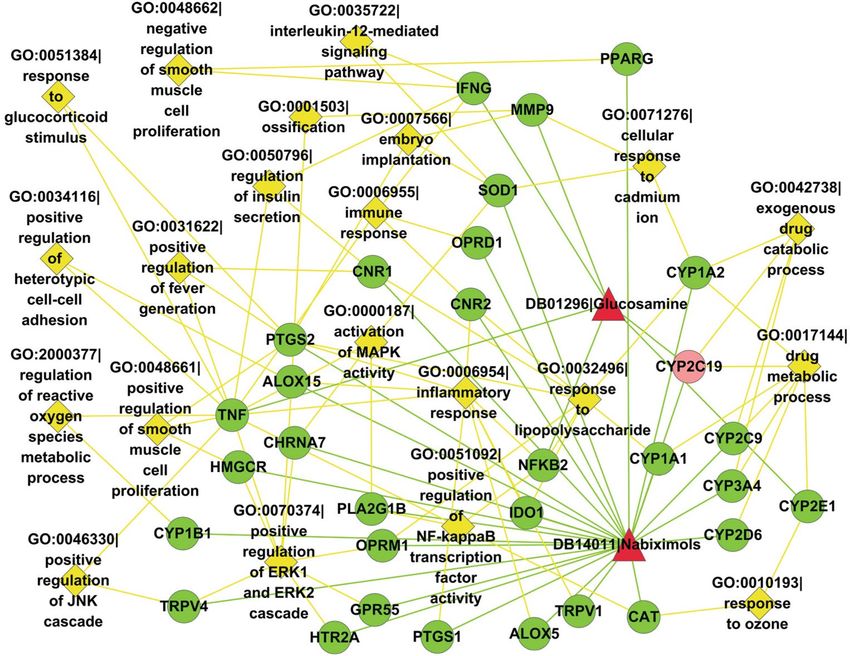
www.nature.com/scientificreports/
that structurally similar drugs tend to target the same or functionally-associated genes to produce similar drug
efficacies9. The other major concern of similarity-based methods is to develop effective metrics to measure simi-
larity between drug profiles. Ferdousi et al.10 choose the optimum measure from a dozen of similarity metrics
between drug target profiles (e.g., inner product, Jaccard similarity, Russell-Rao similarity and Tanimoto coef-
ficient) to infer DDIs. In spite of simple and intuitive interpretation, similarity-based methods are easily affected
by noise, for instance, the thresholding of similarity scores is seriously affected by false DDIs.
The second category of methods, i.e., networks-based methods, could be further classified into drug similarity
networks-based methods12–14 and protein–protein interaction (PPI) networks-based methods15,16. Drug similarity
networks-based methods s predict novel links/DDIs via networks inference on the drug–drug similarity net-
works constructed via a variety of drug similarity metrics, e.g., matrix factorization12,13, block coordinate descent
optimization14. Similar to the similarity-based methods8–11, these methods also resort to the similarities between
drug structural profiles to infer DDIs. Comparatively, networks-based methods are more robust against noise
than direct similarity-based methods. However, drug–drug interactions do not mean direct reactions between
two structurally-similar drug molecules but synergistic enhancement or antagonistic attenuation of each other’s
efficacy. When two drugs take actions on the same genes, associated metabolites or cross-talk signaling pathways,
the biological events that two co-prescribed drugs influence or alter each other’s therapeutic effects may very
well happen10. In this sense, the knowledge about what two drugs target is more useful and interpretable than
drug structural similarity to infer drug–drug interactions, especially for the potential interactions between two
drugs that are not structurally similar.
The PPI networks-based methods15,16 assume that two drugs would produce unexpected perturbations to
each other’s therapeutic efficacy if they simultaneously act on the same or associated genes, so that these methods
have the merit of capturing the underlying mechanism of drug–drug interactions. Park et al.15 assume two drugs
interact if they cause close perturbation within the same pathway or distant perturbation within two cross-talk
pathways, wherein the distant perturbation is captured via random walk algorithm on PPI networks. Huang
et al.16 also consider drug actions in the context of PPI networks. In their method, the target genes together
with their neighbouring genes in PPI networks are defined as the target-centred system for a drug, and then a
metric called S-score is proposed to measure the similarity between two drugs’ target-centered systems to infer
drug–drug interactions. To date, PPI networks are far from complete and contain a certain level of noise so as
to be restricted in the application to inferring drug–drug interactions.
The third category of methods, i.e., machine learning methods, has been widely used to infer drug–drug
interactions17–25. Most of these methods focus on improving the performance of drug–drug interactions predic-
tion via data integration. In these methods, data integration attempts to capture multiple aspects of information
of a single data source or combining multiple heterogeneous data sources. Dhami et al.17 attempt to combine
multiple similarity metrics (e.g., molecular feature similarity, string similarity, molecular fingerprint similarity,
molecular access system) from the sole data of drug SMILES representation. The other m ethods18–25 all combine
multiple data sources. Data integration often combines diverse feature information such as drug adverse drug
reactions (ADR)18–20,23,24, target similarity18–20,22–24, PPI networks23,24, signaling pathways19 and so on. Among
these features, the information of drug chemical structures in the form of SMILES descriptors is most frequently
used17–24. The machine learning frameworks used to integrate heterogeneous data include ensemble learning18,19,
kernel methods17,20 and deep l earning21,22. Empirical studies show that data integration surely enrich the descrip-
tion of drugs from multiple aspects and accordingly improves the performance of drug–drug interaction pre-
diction. However, data integration suffers from two major drawbacks. One drawback is that data integration
increases data complexity. In most cases, we do not know which information is the most important and indispen-
sable for predicting drug–drug interactions. Some information may contribute less to the prediction task. More
importantly, data integration renders data constraint more demanding. Once any aspect of feature information
is not available, e.g., drug molecular structure, the trained model may fail to work. Actually, single-task learning
without data integration also can achieve satisfactory predictive performance, e.g., deep learning on available
DDI networks only25. The other drawback of data integration is that the molecular mechanisms underlying
drug–drug interactions is often ignored or drowned by the information flood. As results, the model is trained
like a black-box and the predictions are hard to interpret in biological sense. Recent studies have revealed some
molecular mechanisms drug–drug interactions, e.g., targeted gene profile and signaling pathway profile26. This
information needs to be considered to increase model interpretability.
In this study, we attempt to simplify the computational modeling for drug–drug interaction prediction on
the basis of potential drug perturbations on associated genes and signaling pathways. We assume that two drugs
potentially interact when a drug alters the other drug’s therapeutic effects through targeted genes or signaling
pathways. For this sake, only the known target genes of drugs taken from DrugBank27 are used to train a predic-
tive model without the information of drug structures or adverse drug reactions that are hard to represent and
potentially are not available. The drug target profile is actually a binary vector indicating the presence or absence
of a gene and the target profiles of two drugs are simply combined into a feature vector to depict a drug pair. To
counteract the potential impact of noise, we choose l2-regularized logistic regression as the base learner. The
proposed framework is evaluated via cross validation and independent test, wherein the external test data are
taken from the comprehensive database28. We further propose several statistical metrics based on protein–protein
interaction networks and signaling pathways to measure the intensity that drugs act on each other.
Data and methods
Data. The known drug–drug interactions and drug–gene interactions are extracted from D rugBank27. As
we use drug target profile to represent drugs and drug pairs, only the drugs that have been discovered to target
at least one human gene are studied in this work. As results, we totally extract 6066 drugs and 2940 targeted
Scientific Reports | (2021) 11:17619 | https://doi.org/10.1038/s41598-021-97193-8 2
Vol:.(1234567890)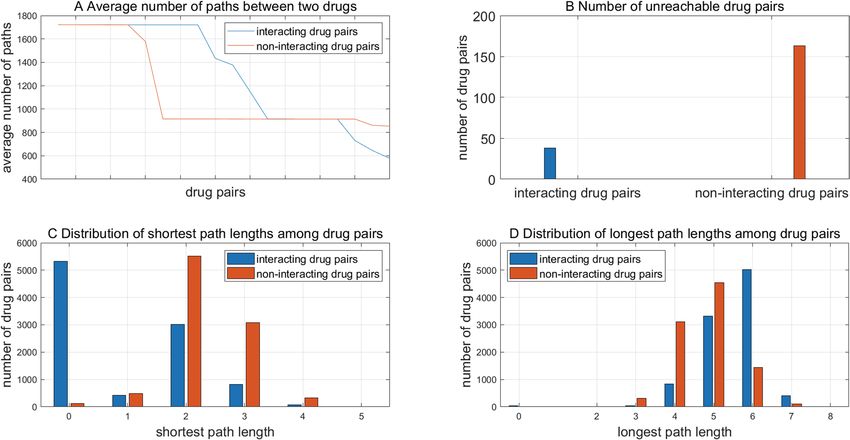
www.nature.com/scientificreports/
human genes from D rugBank27. There are 915,413 drug–drug interactions and 23,169 drug–gene interactions
associated with these drugs. As drug–drug interaction prediction is essentially a problem of binary supervised
learning, we use the 915,413 drug pairs as the positive training data and randomly sample another 915,413 drug
pairs from the 6066 drugs as the negative training data. The two classes of data are ensured to have no overlap.
The comprehensive database28 provides a large repository for drug–drug interactions from experiments and
text mining, some of which come from scattered databases such as D rugBank27, KEGG29, OSCAR30 (https://
31
oscar-emr.com/), VA NDF-RT and so on. After removing the drug–drug interactions that already exist in
DrugBank27, we totally obtain 13 external datasets as positive independent test data, for instance, the largest 8188
drug–drug interactions from K EGG29. To estimate the risk of model bias, we randomly sample 8188 drug pairs
as negative independent test data. These drug pairs are not overlapped with the training data and the positive
independent test data.
To quantitatively estimate the intensity that two drugs perturbate each other’s efficacy, we build up com-
prehensive physical protein–protein interaction (PPI) networks from existing databases ( HPRD32, BioGRID33,
IntAct34, HitPredict35. We totally obtain 171,249 physical PPIs. From N
etPath36, we obtain 27 immune signaling
pathways with IL1–IL11 merged into one pathway for simplicity. From Reactome37, we obtain 1846 human
signaling pathways.
Drug target profile‑based feature construction. Drugs act on their target genes to produce desirable
therapeutic efficacies. In most cases, drug perturbations could disperse to other genes through PPI networks
or signaling pathways, so as to accidentally yield synergy or antagonism to the drugs targeting the indirectly
affected genes. In this study, we depict drugs and drug pairs using drug target profile only. For each drug di in
the DDI-associated drug set D , its targeted human gene set is denoted as Gdi . The entire target gene set is defined
as follows.
G = ∪di ∈D Gdi (1)
For each drug di , drug target profile is formally defined as follows.
1, g ∈ Gdi �g ∈ G
(2)
Vdi g =
0, g ∈
/ Gdi �g ∈ G
Then the drug target profile of a drug pair (di , dj ) is defined by combining the target profile of di and dj as
follows.
V(d i ,dj ) g = Vdi g + Vdj g , g ∈ G (3)
The genes g ∈ / G are discarded. The simple feature representation of drug target profile intuitively reveals the
co-occurrence patterns of genes that a drug or drug pair targets. As an intuitive example, assuming the entire gene
set G = {TF, ALB, XDH, ORM1, ORM2}, drug Patisiran (DB14582) targets the genes {ALB, ORM1, ORM2} and
drug Bismuth Subsalicylate (DB01294) targets the genes {ALB, TF}, then Patisiran is represented with the vector
[0, 1, 0, 1, 1] and Bismuth Subsalicylate is represented with the vector [1, 1, 0, 0, 0]. The drug pair (Patisiran,
Bismuth Subsalicylate) is represented with the combined vector [1, 2, 0, 1, 1], which is used as the input of the
base learner. All the data including the training set and the test set have the same feature descriptors. It is noted
that all the target genes are chosen to represent drugs and drug pairs without giving priority or importance to
the features, because the known target genes are very sparse and many target genes are unknown. If feature selec-
tion with importance weights is conducted, many drugs and drug pairs would be represented with null vector.
L2‑regularized logistic regression as base learner. L2-regularized logistic regression38, well-known for
its fast fitting large training data and penalizing potential noise and overtraining, is adopted as the base learner
in this study. Given the training data x and labels y with each instance xi corresponding a class label yi , i.e.,
(xi , yi ), i = 1, 2, ..., l; xi ∈ R n ; yi ∈ {−1, +1}, the decision function of logistic regression is defined as
T x) . L2-regularized logistic regression derives the weight vector ω via solving the optimization
1
f (x) = 1+exp(−yω
problem
l
1
T
min ωT ω + C log 1 + e−yi ω xi (4)
ω 2
i=1
where C denotes penalty parameter or regularizer. The second term penalizes potential noise/outlier or overtrain-
ing. The optimization problem (4) is solved via its dual form
l l
1
min α T Qα + αi logαi + (C − αi )log(C − αi ) − ClogC
α 2
i:αi >0i:α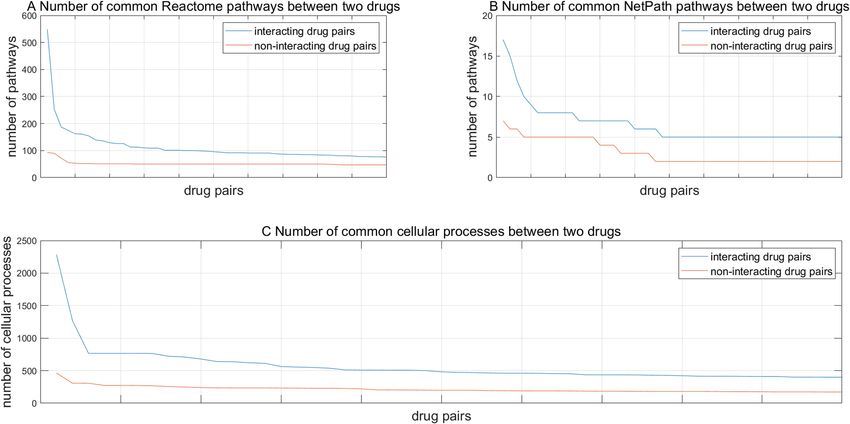
www.nature.com/scientificreports/
Metrics for model performance and intensity of drug–drug interactions. Metrics for binary classi-
fication. Frequently-used performance metrics for supervised classification include Receiver Operating Char-
acteristic curve AUC (ROC-AUC), sensitivity (SE), precision (PR), Matthews correlation coefficient (MCC),
accuracy and F1 score. Except that ROC-AUC is calculated based on the outputs of decision function f (x), all
the other metrics are calculated via confusion matrix M. The element Mi,j records the counts that class i are clas-
sified to class j. From M, we first define several intermediate variables as Formula (6). Then we further define the
performance metrics P Rl, SEl and MCCl for each class label as Formula (7). The overall accuracy and MCC are
defined by Formula (8).
L
L
L
L
pl = Ml,l , ql = Mi,j , rl = Mi,l , sl = Ml,j
i=1,i�=l j=1,j�=l i=1,i�=l j=1,j�=l
(6)
L
L
L
L
p= pl , q = ql , r = rl , s = sl
l=1 l=1 l=1 l=1
pl
PRl = , l = 1, 2 . . . , L
pl + rl
pl
SEl = , l = 1, 2 . . . , L
pl + sl (7)
pl ql − rl sl
MCCl =
, l = 1, 2 . . . , L
pl + rl pl + sl ql + rl ql + sl
L
Ml,l
Acc = L l=1
L
i=1 j=1 Mi,j
(8)
pq − rs
MCC =
p+r p+s q+r q+s
where L denotes the number of labels and equals to 2 in this study. F1 score is defined as follows.
2 × PRl × SEl
F1 score = , l = 1 denotes the positive class (9)
PRl + SEl
Metrics for intensity of drug–drug interactions. Two drugs perturbate each other’s efficacy through their tar-
geted genes and the association between the targeted genes determines the interaction intensity of two drugs.
If two drugs target common genes or different genes connected via short paths in PPI networks, we deem it as
close interaction; if two drugs target different genes via long paths in PPI networks or across signaling pathways,
we deem it as distant interaction; otherwise, the two drugs may not interact. If two drugs target common genes,
the interaction could be regarded as most intensive and the intensity can be measured by Jaccard index. Given a
drug pair (di , dj ), the Jaccard index between the two drugs is defined as follows
|Gdi ∩ Gdj |
Jaccard(di , dj ) = (10)
|Gdi ∪ Gdj |
where Gdi and Gdj denote the target gene set of di and dj , respectively. The larger the Jaccard index is, the more
intensively the drugs interact. We use the threshold ξ to measure the level of interaction intensity. We further
estimate the percentage of drug pairs whose interaction intensity exceeds ξ as follows
|{(di , dj )|Jaccard(di , dj ) ≥ ξ , (di , dj ) ∈ U}|
SimU = (11)
|U|
where U denotes the set of drug–drug interactions. If ξ = min∀(di ,dj )∈U |Gd ∪G
1
d |
, then SimU gives the percentage
i j
of drug pairs that target at least one common gene.
Two drugs may also interact through their target genes communicating via protein–protein interactions,
although they do not target common genes. In these cases, we need to consider all the paths between two target
genes in PPI networks. Given a gene pair ( gi , gj ), we use breadth-first graph search algorithm to search for all
the paths between them in human PPI networks, denotes as P(gi ,gj ). The length of the shortest path and longest
path s denoted as S(gi ,gj ) and L(gi ,gj ), respectively. We use the distance between target genes in terms of path length
in PPI networks to define the distance between drugs. The average number of paths Avg (di ,dj ), the shortest dis-
tance S(di ,dj ) and the longest distance L(di ,dj ) between drug di and dj are defined as follows.
Scientific Reports | (2021) 11:17619 | https://doi.org/10.1038/s41598-021-97193-8 4
Vol:.(1234567890)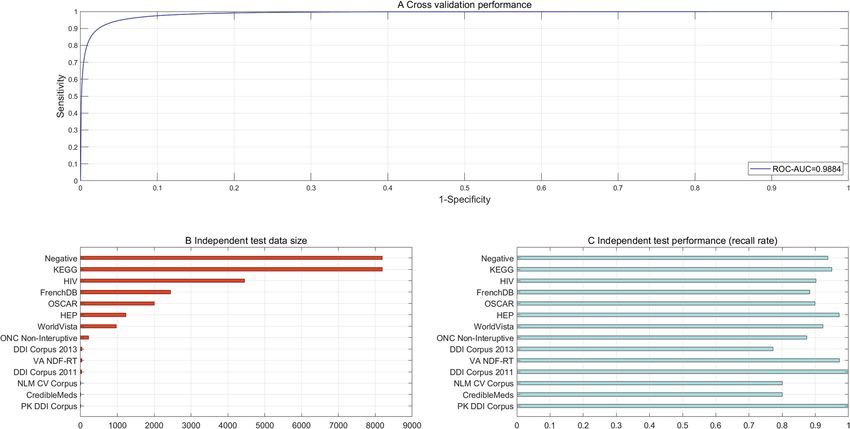
www.nature.com/scientificreports/
Figure 1. Performance of cross validation and independent test. (A) ROC curve and AUC score for fivefold
cross validation. (B) Statistics of independent test data size. (C) Recall rates on the independent test data.
Cross validation Independent test (recall rate)
PR SE MCC Acc MCC* AUC F1 score KEGG OSCAR VA NDF-RT Negative
0.9411 (+) 0.9556 (+) 0.9009 (+)
94.79% 0.9007 0.9884 0.9483 0.9497 0.8992 0.9730 0.9373
0.9549 (−) 0.9402 (−) 0.9007 (−)
Table 1. Performance estimation of fivefold cross validation and independent test. The bracketed + denotes
positive class, the bracketed − denotes negative class and MCC* denotes overall MCC.
(gi ,gj ),gi ∈Gdi �gj ∈Gdj (gi ,gj )
P
Avg(di ,dj ) =
gi , gj
gi ∈ Gdi �gj ∈ Gdj
(12)
S(di ,dj ) = min∀(gi ,gj ),gi ∈Gd �gj ∈Gd S(gi ,gj )
i j
L(di ,dj ) = max∀(gi ,gj ),gi ∈Gd �gj ∈Gd L(gi ,gj )
i j
Avg (di ,dj ) indicates the number of paths through which two drugs interact. S(di ,dj ) indicates the most economi-
cal and effective way that two drugs interact. L(di ,dj ) indicates how far two drugs could alter each other’s efficacy,
i.e., action range between two drugs. These three metrics are proposed to measure the interaction intensities
between two drugs. Especially, S(di ,dj ) = 0 indicates that drug di and dj target common genes, and Avg (di ,dj ) = 0
indicates that there are no paths between drug di and dj and the two drugs do not interact.
Assuming K signaling pathways in total, if there exists a target gene gj of drug di located in a signaling pathway
Sig k, denoted as gj ∈ Sig k, the pathway set associated with gj is defined as Sig gj = {Sig k |g j ∈ Sig , k = 1, 2, . . . , K}.
k
The signaling pathways targeted by di is defined as gj ∈Gd Sig gj , and then the common target signaling pathways
i
between di and dj are defined as Sig (di ,dj ) = gj ∈Gd Sig gj gj ∈Gdj Sig gj . The common target cellular processes
i
between di and dj are constructed in the same way, except that the signaling pathways are replaced with the GO
terms of biological processes in GOA d atabase39.
Results
Performance of cross validation and independent test. The results of fivefold cross validation show
that the proposed framework fairly encouraging performance (see Fig. 1A for ROC-AUC scores and Table 1
for other metrics). The metrics of SP, SE and MCC on the two classes show that the proposed framework is less
biased, e.g., 0.9556 on the positive class, 0.9402 on the negative class in terms of sensitivity and 0.9007 overall
MMC. These results show that drug target profile alone is sufficient to separate interacting drug pairs from non-
interacting drug pairs with a high accuracy (Accuracy = 94.79%). Drug takes effect via its targeted genes and
the direct or indirect association or signaling between targeted genes underlies the mechanism of drug–drug
Scientific Reports | (2021) 11:17619 | https://doi.org/10.1038/s41598-021-97193-8 5
Vol.:(0123456789)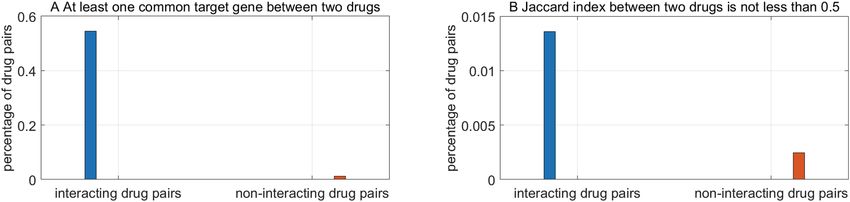
www.nature.com/scientificreports/
Cross validation
Independent
PR SE MCC F1 score ROC-AUC test
0.26 (+) 0.68 (+)
Vilar et al.7 – – 0.92 31%
11.81 (−) 0.96 (−)
8
Ferdousi et al. – 0.72 (+) – – – –
Cheng et al.16 – – – – 0.67 –
Zhang et al.17 0.785 0.670 – 0.723 0.957 35%
Song et al.18 0.68 (+) – – – 0.9738 24%
Gottlieb et al.21 0.88 0.93 – – 0.96 53%
Karim et al.23 – – 0.79 0.91 0.97 –
Table 2. Performance comparisons with existing methods. The bracketed sign + denotes positive class, the
bracketed sign − denotes negative class and the other sign – denotes missing values.
interaction. From this aspect, drug target profile intuitively and effectively elucidates the molecular mechanism
behind drug–drug interactions. Drug target profile could represent not only the genes targeted by structurally
similar drugs but also the genes targeted by structurally dissimilar drugs, so that it is less biased than drug struc-
tural profile. The results also show that neither data integration nor drug structural information is indispensable
for drug–drug interaction prediction. To more objectively gain knowledge about whether or not the model
behaves stably, we evaluate the model performance with varying k-fold cross validation (k = 3, 5, 7, 10, 15, 20, 25)
(see the Supplementary Fig. S1). The results show that the proposed framework achieves nearly constant perfor-
mance in terms of Accuracy, MCC and ROC-AUC score with varying k-fold cross validation.
Cross validation still is prone to overfitting, though that the validation set is disjoint with the training set for
each fold. We further conduct independent test on 13 external DDI datasets and one negative independent test
data to estimate how well the proposed framework generalizes to unseen examples. The size of the independent
test data varies from 3 to 8188 (see Fig. 1B). The performance of independent test is in Fig. 1C. The proposed
framework achieves recall rates on the independent test data all above 0.8 except the dataset “DDI Corpus 2013”.
On the experimental DDIs from KEGG26, OSCAR27 and VA NDF-RT28, the proposed framework achieves recall
rate 0.9497, 0.8992 and 0.9730, respectively (see Table 1). On the negative independent test data, the proposed
framework also achieves 0.9373 recall rate, which indicates a low risk of predictive bias. The independent test
performance also shows that the proposed framework trained using drug target profile generalizes well to unseen
drug–drug interactions with less bias.
Comparisons with existing methods. Existing methods infer drug–drug interactions majorly via drug
structural similarities in combination with data integration in many cases. Structurally similar drugs tend to
target common or associated genes so that they interact to alter each other’s therapeutic efficacy. These methods
surely capture a fraction of drug–drug interactions. However, structurally dissimilar drugs may also interact
through their targeted genes, which cannot be captured by the existing methods based on drug structural simi-
larities. In our proposed framework, direct or indirect associations between the target genes of two drugs are
assumed to be the major driving force that induces drug–drug interactions, so as to capture both structurally-
similar and structurally-dissimilar drug–drug interactions. From biological insights, the proposed framework
is easier to interpret. From computational point of view, the proposed framework uses drug target profiles only
and greatly reduces data complexity as compared to existing data integration methods.
From performance point of view, the proposed framework also outperforms existing methods. The perfor-
mance comparisons are provided in Table 2. All the existing methods achieve fairly high ROC-AUC scores except
Cheng et al.15 (ROC-AUC = 0.67). Unfortunately, these methods show a high risk of bias. For instance, the model
proposed by Vilar et al.9, trained via drug structural profiles, is highly biased towards the negative class with
sensitivity 0.68 and 0.96 on the positive and the negative class, respectively. The data integration method proposed
by Zhang et al.19 achieves encouraging performance of cross validation (ROC-AUC score = 0.957, PR = 0.785,
SE = 0.670) but only recognizes 7 out of 20 predicted DDIs (equivalent to 35% recall rate of independent test),
although it exploits a large amount of feature information such as drug substructures, drug targets, drug enzymes,
drug transporters, drug pathways, drug indications and drug side-effects. Similarly, Gottlieb et al.23 achieve fairly
good performance of cross validation but achieve only 53% recall rate of independent test.
Deep learning, the most promising revolutionary technique to date in machine learning and artificial intel-
ligence, has been used to predict the effects and types of drug–drug interactions21,22. The most related deep
learning framework proposed by Karim et al.25 automatically learns feature representations from the structures
of available drug–drug interaction networks to predict novel DDIs. This method also achieves satisfactory per-
formance (ROC-AUC score = 0.97, MCC = 0.79, F1 score = 0.91), but the learned features are hard to interpret
and to provide biological insights into the molecular mechanisms underlying drug–drug interactions.
Analyses of molecular mechanisms behind drug–drug interactions. Jaccard index between two
drugs. The more common genes two drugs target, the more intensively the two drugs potentially interact. As
presented in Formula (10), the interaction intensity is measured with Jaccard index. The percentage of drug pairs
whose interaction intensity exceeds ξ is illustrated in Fig. 2. The threshold of interaction intensity assumes
Scientific Reports | (2021) 11:17619 | https://doi.org/10.1038/s41598-021-97193-8 6
Vol:.(1234567890)www.nature.com/scientificreports/
Figure 2. Statistics of common target genes between interacting and non-interacting drugs.
Figure 3. The statistics of average number of paths, shortest path lengths and longest path lengths between two
drugs.
1
ξ = min∀(di ,dj )∈U |Gd ∪G d |
and ξ = 0.5 in Fig. 2A,B, respectively. The statistics are derived from the training data.
i j
We can see that interacting drugs tend to target much more common genes than non-interacting drugs.
Average number of paths between two drugs. The average number of paths between the garget genes of two
drugs as defined in Formula (12) also measures the interaction intensity between drugs. To reduce the time
of paths search, we only randomly choose 9692 interacting drug pairs and 9692 non-interacting drug pairs
as examples for the analyses of molecular mechanism behind drug–drug interactions. The average number of
paths of top twenty drug pairs are illustrated in Fig. 3A. We can see that interacting drug pairs have their target
genes more heavily connected than non-interacting drug pairs, which also means the more paths two drugs are
connected through, the more probably the two drugs interact to alter each other’s effects. As shown in Fig. 3B,
non-interacting drugs are more likely to be unreachable to each other than interacting drugs.
Shortest path length between two drugs. For the randomly sampled 9692 interacting drug pairs and 9692 non-
interacting drug pairs, the length of the shortest paths between two drugs’ target genes ranges from 0 to 5 (see
Fig. 3C). We can see that interacting drug pairs significantly outnumber non-interacting drug pairs when the
shortest path length is equal to 0, that’s, that two drugs target common genes. With the increase of the shortest
path length, non-interacting drug pairs gradually outnumber interacting drug pairs. These results show that
drug–drug interactions tend to occur between drugs that target common genes or whose target genes come
across via shorter shortest paths. The shorter the shortest path is, the more efficiently the drugs interact.
Longest path length between two drugs. For the randomly sampled drug pairs, the length of the longest paths
between two drugs’ target genes ranges from 0 to 8 (see Fig. 3D). Non-interacting drug pairs outnumber inter-
Scientific Reports | (2021) 11:17619 | https://doi.org/10.1038/s41598-021-97193-8 7
Vol.:(0123456789)www.nature.com/scientificreports/
Figure 4. Statistics of common signaling pathways that two drugs target and common cellular processes that
two drugs are involved in.
acting drug pairs when the longest path ranges from 3 to 5, but conversely interacting drug pairs significantly
outnumber non-interacting drug pairs when the longest path length equals to 6. These results to some extent
show that interacting drugs could exert far-reaching perturbations on each other with a longer range of action
than non-interacting drugs. The metrics Avg (di ,dj ) , S(di ,dj ) and L(di ,dj ) defined in Formula (12) could measure the
tendency of drug–drug interaction in terms of interaction intensity, interaction efficiency and action range.
When the shortest path length equals to 0 and the longest path length equals to 6, the randomly sampled inter-
acting and on-interacting drug pairs show a significant statistical difference.
Common target pathways between two drugs. We map the target genes onto the signaling pathways from
NetPath36 and Reactome37 to investigate that interacting drugs tend to target common signaling pathways.
Computational results show that interacting drug pairs tend to target more common signaling pathways than
non- interacting drug pairs (see Fig. 4A for NetPath pathways and Fig. 4B for Reactome pathways). If the target
genes of two drugs are located in the same signaling pathway, the two drugs are more likely to perturbate each
other’s efficacies.
Common cellular processes between two drugs. As shown in Fig. 4C, interacting drugs are more likely to get
involved in common cellular processes than non-interacting drugs. This phenomenon is not hard to under-
stand. Two drugs whose target genes are involved in common cellular processes more likely alter each other’s
therapeutic effects.
Predictions and clinical implications. We randomly sample 99,986 drug pairs as the prediction set,
which are not overlapped with the training data and the independent test data. Thereinto, 43,719 drug pairs are
predicted to interact by the proposed framework (see Supplementary File S1). These predictions to some extent
contain a certain level of false interactions. For each prediction, a confidence level in the form of probability
could be chosen to filter out the weak interactions (e.g., 0.7 probability as a threshold). These predictions are
further analysed from the aspect of cellular processes (see Supplementary File S2) and signaling pathways (see
Supplementary File S3) to help us understand the molecular mechanisms underlying drug–drug interactions.
We choose the drug Nabiximols and Glucosamine as a case study.
Nabiximols (C42H60O4), extracted from Cannabis sativa L., is often used to treat neuropathic pain and intrac-
table cancer pain, with the pharmacological effects of analgesic, muscle relaxant, anxiolytic, neuroprotective and
anti-psychotic activity (https://www.drugbank.ca/drugs/DB14011). Glucosamine (C6H13NO5), as a precursor
for glycosaminoglycans that are a major component of joint cartilage, is often used to rebuild cartilage and
rugBank27, Nabiximols targets
treat osteoarthritis (https://www.drugbank.ca/drugs/DB01296). According to D
57 human genes and Glucosamine targets six human genes. Based on these target genes, we could analyse the
cellular processes and signaling pathways through which Nabiximols and Glucosamine take effect.
Common cellular processes between Nabiximols and Glucosamine. Two drugs mediate common cellular pro-
cesses via common target genes or associated target genes involved in the same cellular processes. Computa-
tional results show that Nabiximols and Glucosamine get involved 68 common cellular processes. For clarity,
Scientific Reports | (2021) 11:17619 | https://doi.org/10.1038/s41598-021-97193-8 8
Vol:.(1234567890)www.nature.com/scientificreports/
Figure 5. Common cellular processes of target genes between DB14011|Nabiximols and
DB01296|Glucosamine predicted to interact. Red triangle nodes denote drugs; green circle nodes denote drug
target genes; light red circle nodes denote common target genes; and yellow diamond nodes denote biological
processes of gene ontology. This drawing is created by Cytoscape version 2.8.2 (https://cytoscape.org/).
only 21 cellular processes and the associated target genes are illustrated in Fig. 5. The rest cellular processes are
provided in Supplementary File S2. As shown in Fig. 5, Nabiximols and Glucosamine mediate the common cel-
lular processes of exogenous drug catabolic process (GO:0042738) and drug metabolic process (GO:0017144)
via the common gene CYP2C19. Association via different target genes is one major way that two drugs medi-
ate common cellular processes. For instance, Nabiximols and Glucosamine mediate the common cellular pro-
cesses of negative regulation of smooth muscle cell proliferation (GO:0048662) via Nabiximols-targeted gene
PPARGand Glucosamine-targeted gene IFNG. For another example, Nabiximols and Glucosamine mediate the
common cellular processes of regulation of reactive oxygen species (ROS) metabolic process (GO:2000377)
via Nabiximols-targeted gene CYP1B1 and Glucosamine-targeted gene TNF. Among the predicted drug–drug
interactions, many drug pairs do not target common genes but they are found to mediate common cellular
processes via different target genes (see Supplementary File S2). For instance, drug Nabiximols (DB14011) and
Gallium nitrate (DB05260) are not found to target common genes in DrugBank27, but they are predicted to tar-
get the common cellular processes of neutrophil chemotaxis (GO:0030593), positive regulation of NF-kappaB
transcription factor activity (GO:0051092), etc.
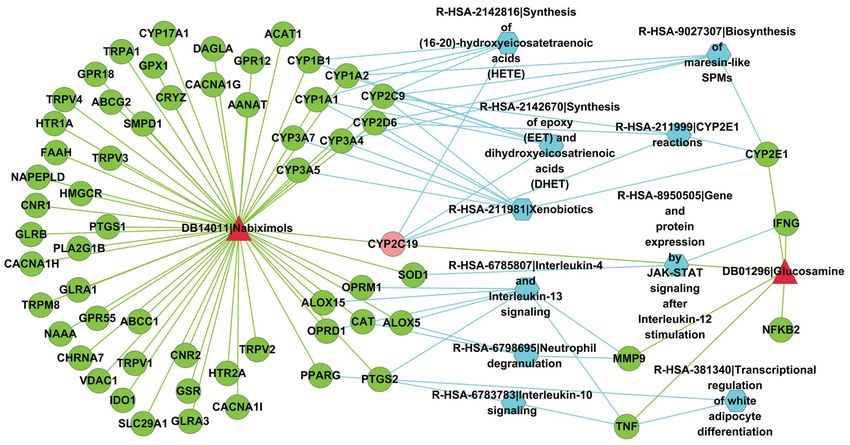
Common signaling pathways between Nabiximols and Glucosamine. The common Reactome signaling pathways
that Nabiximols and Glucosamine mediate are illustrated in Fig. 6. Among the target genes, the common target
gene CYP2C19 is located in four Reactome signaling pathways, i.e., Synthesis of epoxy (EET) and dihydroxyeico-
satrienoic acids (DHET) (R-HSA-2142670), Xenobiotics (R-HSA-211981), CYP2E1 reactions (R-HSA-211999)
and Synthesis of (16-20)-hydroxyeicosatetraenoic acids (HETE) (R-HSA-2142816). Apart from common garget
genes, association via different target genes also leads to two drugs mediating common signaling pathways. For
instance, Nabiximols and Glucosamine mediate the common signaling pathway of Neutrophil degranulation
(R-HSA-6798695) via Nabiximols-targeted gene ALOX5 and Glucosamine-targeted gene MMP9. Two drugs
that do not target common genes also potentially mediate the same signaling pathways (see Supplementary File
S3). For instance, drug Nabiximols (DB14011) and SF1126 (DB05210) have not been reported to target common
genes in DrugBank27, but they are predicted to mediate several common signaling pathways, e.g., Regulation of
PTEN gene transcription (R-HSA-8943724), Interleukin-4 and Interleukin-13 signaling (R-HSA-6785807), G
alpha (q) signaling events (R-HSA-416476).
Scientific Reports | (2021) 11:17619 | https://doi.org/10.1038/s41598-021-97193-8 9
Vol.:(0123456789)www.nature.com/scientificreports/
Figure 6. Common target Reactome signaling pathways between DB14011|Nabiximols and
DB01296|Glucosamine predicted to interact. Red triangle nodes denote drugs; green circle nodes denote drug
target genes; light red circle nodes denote common target genes; and blue hexagon nodes denote Reactome
signaling pathways. This drawing is created by Cytoscape version 2.8.2 (https://cytoscape.org/).
Discussion
Only after co-prescribed drugs have clinically done damages to patient health and life, could drug–drug inter-
actions be detected and reported in most cases. For this reason, we need resort to computational methods to
predict whether two drugs interact and produce undesirable side effects before clinical co-prescription. Existing
computational methods focus on integrating multiple heterogeneous data sources to increase model performance,
among which drug structural profile is the most frequently used feature information. These methods heavily
depend on drug structures and assume that structurally similar drugs often target common or associated genes
so as to alter each other’s therapeutic efficacies. This assumption surely captures a fraction of drug–drug inter-
actions but shows bias, because it ignores a large fraction of interactions between structurally dissimilar drugs.
The other major drawback of these methods lies in the high data complexity. In these methods, we do not know
which information contributes most to the model performance and it is hard to interpret the molecular mecha-
nisms behind drug–drug interactions. Furthermore, data integration would fail when the required data are not
available, e.g., drug structures, drug side-effects, clinical records. Lastly, proper representation of drug molecule
structures and extracting features from drug SMILES remain challenging in the progress of computational model-
ling for drug development. In this study, we use drug target profile to depict drugs and drug pairs to achieve two
goals. One goal is to simplify the modeling processes via reducing data complexity and relieving dependency on
drug molecular structures. The other goal is to computationally model the molecular mechanisms underlying
drug–drug interactions so that the model is biologically interpretable. Drugs act on their target genes to produce
desirable therapeutic efficacies. We assume that the perturbations of two drugs come across through common
target genes, paths in PPI networks or signaling pathways, synergistic enhancement or antagonistic counteract
of therapeutic effects of individual drugs would take place. As compared to the existing methods, this proposed
framework bases the assumption of drug–drug interactions on drug–targeted genes instead of drug structural
similarities. We use the known drug–drug interactions from D rugBank27 as the positive training data and ran-
domly sample the same size of drug pairs as the negative training data to train an l2-regualrized logistic regression
model. K-fold cross validation is a common practice used to estimate model performance, but the performance
varies with the choice of k. The best practice is to choose k at intervals (e.g., k = 3, 5, 10, 15, …) or even conduct
leave-one-out cross validation, so that we could more objectively know whether or not the model behaves sta-
bly. However, this practice is computationally prohibitive to large training data (915,413 positive examples and
915,413 negative examples) and thirteen external test datasets with tedious model parameters tuning. Actually,
it is hard to obtain a training set representative of and infinitely approximate to the population distribution
via varying k-folds. Nevertheless, we still evaluate the model performance with varying k-fold cross validation
(k = 3, 5, 7, 10, 15, 20, 25). The results show that the performance in terms of Accuracy, MCC and ROC-AUC
score is fairly stable with k varying widely. Apart from horizontally randomizing examples (X-randomization),
some statistical machine learning models such as Random Forest also conduct vertical feature randomization
(Y-randomization) to obtain different views or to evaluate feature importance. Because the known target genes
Scientific Reports | (2021) 11:17619 | https://doi.org/10.1038/s41598-021-97193-8 10
Vol:.(1234567890)www.nature.com/scientificreports/
are very sparse and thus random sampling of feature subsets potentially results in null vector representation of
drug pairs, we choose all the features in this study.
Empirical studies show that the proposed framework achieves fairly encouraging performance of fivefold
cross validation and independent test on thirteen external datasets, which significantly outperforms the exist-
ing methods. Furthermore, the encouraging performance on the randomly sampled negative independent test
data shows that the proposed framework is less biased. Nevertheless, the proposed framework yields a little
large fraction of false interactions, which is largely due to the quality of randomly sampled negative training
data. This problem could be to some extent solved by choosing a higher threshold of probability to filter out the
weak predictions. In addition, drug target profile simplifies computational modeling, but meanwhile restricts
the application of the proposed framework in that the target genes have not been reported for many less-studied
drugs. This problem could be solved with the accumulation of the knowledge about drug target genes. The pro-
posed framework could to some extent to be generalized to the other problems concerned with drug discovery,
e.g., drug combinatorial synergy and antagonism, drug side-effects, drug–food interaction, etc., in which drug
target profile could still be useful. Whether or not drug target profile representation is sufficient to solve these
problems need to be further investigated.
We further propose several statistical metrics based on protein–protein interaction networks and signal-
ing pathways to measure the intensity that drugs act on each other. These metrics show that two drugs tend to
interact more efficiently if their perturbations could come across via shorter shortest paths in PPI networks,
and the perturbations would be more far-reaching if longer shortest paths between the two drugs. Lastly, we
use the common cellular processes and signaling pathways that two drugs target to understand the mechanisms
underlying drug–drug interactions. The unravelled mechanisms are useful to provide biological insights into
potential pharmacological risks of known drug–drug interactions.
Conclusions
Drug target profile representation of drugs and drug pairs simplifies the modeling processes for drug–drug
interactions by reducing both data complexity and dependency on drug molecular structures. Meanwhile, Drug
target profile representation renders the proposed framework biologically interpretable in terms of molecular
mechanisms underlying drug–drug interactions.
Code availability
The source code and tools for this proposed framework are publicly available at https://github.com/suyumei/
DrugDrugIntact.git.
Received: 7 May 2021; Accepted: 18 August 2021
References
1. Wienkers, L. C. & Heath, T. G. Predicting in vivo drug interactions from in vitro drug discovery data. Nat. Rev. Drug Discovery 4,
825–833 (2005).
2. Edwards, I. R. & Aronson, J. K. Adverse drug reactions: Definitions, diagnosis, and management. Lancet 356, 1255–1259 (2000).
3. Leape, L. L. et al. Systems analysis of adverse drug events. ADE Prevention Study Group. JAMA 274, 35–43 (1995).
4. Steyn, S. J. & Varma, M. V. S. Cytochrome-P450-mediated drug–drug interactions of substrate drugs: Assessing clinical risk based
on molecular properties and an extended clearance classification system. Mol. Pharm. 17(8), 3024–3032 (2020).
5. Deodhar, M. et al. Mechanisms of CYP450 inhibition: Understanding drug–drug interactions due to mechanism-based inhibition
in clinical practice. Pharmaceutics 12(9), 846 (2020).
6. Duke, J. D. et al. Literature based drug interaction prediction with clinical assessment using electronic medical records: Novel
myopathy associated drug interactions. PLoS Comput. Biol. 8, e1002614 (2012).
7. Medina-Franco, J. L. et al. Rationality over fashion and hype in drug design [version 1; peer review: 2 approved]. F1000Research
10(Chem Inf Sci), 397 (2021).
8. Vilar, S. & Hripcsak, G. The role of drug profiles as similarity metrics: Applications to repurposing, adverse effects detection and
drug–drug interactions. Brief Bioinform. 18, 670–681 (2017).
9. Vilar, S. et al. Drug–drug interaction through molecular structure similarity analysis. J. Am. Med. Inform. Assoc. 19, 1066–1074
(2012).
10. Ferdousi, R., Safdari, R. & Omidi, Y. Computational prediction of drug–drug interactions based on drugs functional similarities.
J. Biomed. Inform. 70, 54–64 (2017).
11. Vilar, S. et al. Similarity-based modeling in large-scale prediction of drug–drug interactions. Nat. Protoc. 9, 2147–2163 (2014).
12. Zhang, W., Chen, Y., Li, D. & Yue, X. Manifold regularized matrix factorization for drug–drug interaction prediction. J. Biomed.
Inform. 88, 90–97 (2018).
13. Shtar, G., Rokach, L. & Shapira, B. Detecting drug–drug interactions using artificial neural networks and classic graph similarity
measures. PLoS ONE 14, e0219796 (2019).
14. Zhang, P., Wang, F., Hu, J. & Sorrentino, R. Label propagation prediction of drug–drug interactions based on clinical side effects.
Sci. Rep. 5, 12339 (2015).
15. Park, K., Kim, D., Ha, S. & Lee, D. Predicting pharmacodynamic drug–drug interactions through signaling propagation interfer-
ence on protein–protein interaction networks. PLoS ONE 10, e0140816 (2015).
16. Huang, J. et al. Systematic prediction of pharmacodynamic drug–drug interactions through protein–protein-interaction network.
PLoS Comput Biol 9, e1002998 (2013).
17. Dhami, D. S., Kunapuli, G., Das, M., Page, D. & Natarajan, S. Drug–drug interaction discovery: Kernel learning from heterogene-
ous similarities. Smart Health (Amst.) 9–10, 88–100 (2018).
18. Cheng, F. & Zhao, Z. Machine learning-based prediction of drug–drug interactions by integrating drug phenotypic, therapeutic,
chemical, and genomic properties. J. Am. Med. Inform. Assoc. 21, e278–e286 (2014).
19. Zhang, W. et al. Predicting potential drug–drug interactions by integrating chemical, biological, phenotypic and network data.
BMC Bioinform. 18, 18 (2017).
20. Song, D. et al. Similarity-based machine learning support vector machine predictor of drug–drug interactions with improved
accuracies. J. Clin. Pharm. Ther. 44, 268–275 (2019).
Scientific Reports | (2021) 11:17619 | https://doi.org/10.1038/s41598-021-97193-8 11
Vol.:(0123456789)www.nature.com/scientificreports/
21. Ryu, J. Y., Kim, H. U. & Lee, S. Y. Deep learning improves prediction of drug–drug and drug-food interactions. Proc. Natl. Acad.
Sci. USA 115, E4304–E4311 (2018).
22. Lee, G., Park, C. & Ahn, J. Novel deep learning model for more accurate prediction of drug–drug interaction effects. BMC Bioin-
form. 20, 415 (2019).
23. Gottlieb, A., Stein, G. Y., Oron, Y., Ruppin, E. & Sharan, R. INDI: a computational framework for inferring drug interactions and
their associated recommendations. Mol. Syst. Biol. 8, 592 (2012).
24. Qian, S., Liang, S. & Yu, H. Leveraging genetic interactions for adverse drug–drug interaction prediction. PLoS Comput. Biol. 15,
e1007068 (2019).
25. Karim, M.R., Cochez, M., Jares, J.B., Uddin, M., Beyan, O., Decker, S. Drug–drug interaction prediction based on knowledge graph
embeddings and convolutional-LSTM network. (2019). arXiv:1908.01288.
26. Jia, J. et al. Mechanisms of drug combinations: Interaction and network perspectives. Nat. Rev. Drug Discov. 8, 111–128 (2009).
27. Wishart, D. S. et al. DrugBank 5.0: A major update to the DrugBank database for 2018. Nucleic Acids Res 46, D1074–D1082 (2018).
28. Ayvaz, S. et al. Toward a complete dataset of drug–drug interaction information from publicly available sources. J. Biomed. Inform.
55, 206–217 (2015).
29. Kanehisa, M. et al. Data, information, knowledge and principle: Back to metabolism in KEGG. Nucleic Acids Res 42(Database
issue), D199–D205 (2014).
30. Crowther, N. R., Holbrook, A. M., Kenwright, R. & Kenwright, M. Drug interactions among commonly used medications. Chart
simplifies data from critical literature review. Can. Fam. Phys. 43, 1972–1976 (1997) (1979–1981).
31. Olvey, E. L., Clauschee, S. & Malone, D. C. Comparison of critical drug–drug interaction listings: The department of Veterans
Affairs medical system and standard reference compendia. Clin. Pharmacol. Ther. 87, 48–51 (2010).
32. Keshava Prasad, T. S. et al. Human protein reference database—2009 update. Nucleic Acids Res. 37(Database issue), D767–D772
(2009).
33. Chatr-Aryamontri, A. et al. The BioGRID interaction database: 2015 update. Nucleic Acids Res 43(Database issue), D470–D478
(2015).
34. Orchard, S., Ammari, M., Aranda, B., Breuza, L. & Briganti, L. The MIntAct project–IntAct as a common curation platform for
11 molecular interaction databases. Nucleic Acids Res. (Database issue) 42, D358–D363 (2014).
35. López, Y., Nakai, K., Patil, A. HitPredict version 4: Comprehensive reliability scoring of physical protein–protein interactions from
more than 100 species. Database (Oxford). 2015:bav117 (2015).
36. Kandasamy, K. et al. NetPath: A public resource of curated signal transduction pathways. Genome Biol. 11, R3 (2010).
37. Fabregat, A. et al. The Reactome pathway knowledgebase. Nucleic Acids Res. 46(Database issue), D649–D655 (2018).
38. Fan, R., Chang, K., Hsieh, C., Wang, X. & Lin, C. LIBLINEAR: A library for large linear classification. Mach. Learn Res. 9, 1871–1874
(2008).
39. Barrell, D. et al. The GOA database in 2009—An integrated Gene Ontology Annotation resource. Nucleic Acids Res. 37(Database
issue), D396–D403 (2009).
Acknowledgements
This work is partly supported by the funding from the NIH Grants 2U54MD007595. The contents are solely the
responsibility of the authors and do not necessarily represent the official views of the NIH.
Author contributions
M.S. conducted the study and wrote the paper. Z.K. revised the manuscript. All the authors reviewed the final
manuscript.
Competing interests
The authors declare no competing interests.
Additional information
Supplementary Information The online version contains supplementary material available at https://doi.org/
10.1038/s41598-021-97193-8.
Correspondence and requests for materials should be addressed to S.M. or K.Z.
Reprints and permissions information is available at www.nature.com/reprints.
Publisher’s note Springer Nature remains neutral with regard to jurisdictional claims in published maps and
institutional affiliations.
Open Access This article is licensed under a Creative Commons Attribution 4.0 International
License, which permits use, sharing, adaptation, distribution and reproduction in any medium or
format, as long as you give appropriate credit to the original author(s) and the source, provide a link to the
Creative Commons licence, and indicate if changes were made. The images or other third party material in this
article are included in the article’s Creative Commons licence, unless indicated otherwise in a credit line to the
material. If material is not included in the article’s Creative Commons licence and your intended use is not
permitted by statutory regulation or exceeds the permitted use, you will need to obtain permission directly from
the copyright holder. To view a copy of this licence, visit http://creativecommons.org/licenses/by/4.0/.
© The Author(s) 2021
Scientific Reports | (2021) 11:17619 | https://doi.org/10.1038/s41598-021-97193-8 12
Vol:.(1234567890)You can also read


