Disease Detection in Plum Using Convolutional Neural Network under True Field Conditions - MDPI
←
→
Page content transcription
If your browser does not render page correctly, please read the page content below
sensors
Article
Disease Detection in Plum Using Convolutional
Neural Network under True Field Conditions
Jamil Ahmad 1 , Bilal Jan 2, *, Haleem Farman 1 , Wakeel Ahmad 3 and Atta Ullah 4
 1    Department of Computer Science, Islamia College, Peshawar 25000, Pakistan; jamil.ahmad@icp.edu.pk (J.A.);
      haleem.farman@icp.edu.pk (H.F.)
 2    Department of Computer Science, FATA University, Kohat 26100, Pakistan
 3    Department of Agronomy, The University of Agriculture, Peshawar 25000, Pakistan;
      wakeel.ahmad@aup.edu.pk
 4    Agricultural Research Institute, Mingora Swat 19200, Pakistan; attaullahaup@yahoo.com
 *    Correspondence: bilal.jan@fu.edu.pk; Tel.: +92-313-959-6988

 Received: 4 June 2020; Accepted: 21 August 2020; Published: 28 September 2020

 Abstract: The agriculture sector faces crop losses every year due to diseases around the globe, which
 adversely affect food productivity and quality. Detecting and identifying plant diseases at an early
 stage is still a challenge for farmers, particularly in developing countries. Widespread use of mobile
 computing devices and the advancements in artificial intelligence have created opportunities for
 developing technologies to assist farmers in plant disease detection and treatment. To this end, deep
 learning has been widely used for disease detection in plants with highly favorable outcomes. In this
 paper, we propose an efficient convolutional neural network-based disease detection framework in
 plum under true field conditions for resource-constrained devices. As opposed to the publicly available
 datasets, images used in this study were collected in the field by considering important parameters of
 image-capturing devices such as angle, scale, orientation, and environmental conditions. Furthermore,
 extensive data augmentation was used to expand the dataset and make it more challenging to enable
 robust training. Investigations of recent architectures revealed that transfer learning of scale-sensitive
 models like Inception yield results much better with such challenging datasets with extensive
 data augmentation. Through parameter quantization, we optimized the Inception-v3 model for
 deployment on resource-constrained devices. The optimized model successfully classified healthy
 and diseased fruits and leaves with more than 92% accuracy on mobile devices.

 Keywords: disease detection; deep learning; plum

1. Introduction
     Agriculture has always been an important sector considering its economic impact on society,
especially in developing countries. One of the significant challenges faced today is fulfilling the
ever-growing requirements and demands for quality food products. Though different factors like crop
diseases, climate change, and many others have a direct impact on food production [1], crop disease
has been reported as one of the main sources of food losses that negatively impacts small-scale farmers.
According to [2], around 80% of the agriculture is produced by small-scale farmers in developing
countries, and food losses are much higher in these areas due to the lack of resources. As per the World
Health Organization [3], more than 200 diseases are caused by unsafe food (viruses, bacteria, and
chemicals) and around 600 million people get ill, in which 420,000 die every year. Further, it becomes more
challenging for the developing countries to control and treat diseases on time so that the production
and quality can be improved.
     Fruit plant disease can have consequences not only on agriculture but also on the economy of
the region. Apart from other food losses, around 10% of the food is demolished due to disease every

Sensors 2020, 20, 5569; doi:10.3390/s20195569                                     www.mdpi.com/journal/sensors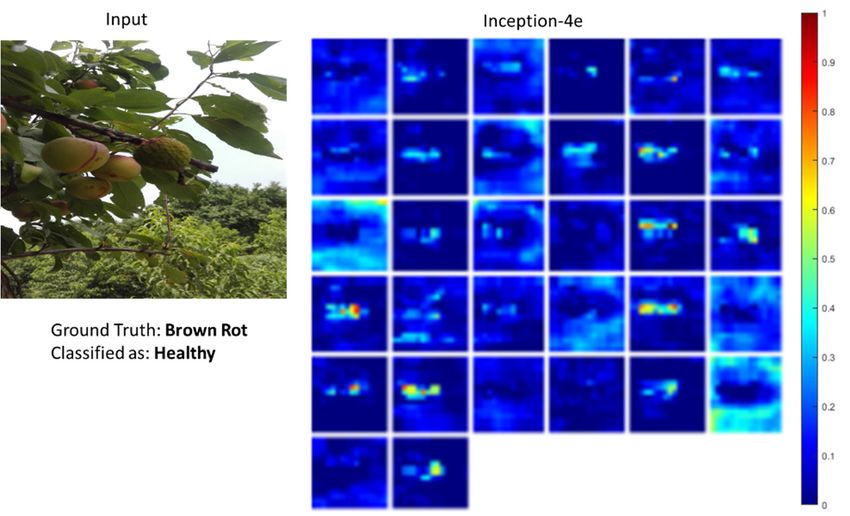
Sensors 2020, 20, 5569                                                                              2 of 18

year [4], which can even be high in developing countries depending on the type of crop, climate, and
agricultural traditions. Some of the fruits are very vulnerable to diseases such as cherry, plum, and
peach. Plum is considered a significant crop in Pakistan and recorded around 49,800 tons of production
in 2017–2018 [5]. On average, a single tree production varies between 70 and 90 kg depending upon
the variety and climate [6]. However, production is reduced by 10–15% due to various diseases, which
affect productivity and quality. The most common diseases in plum fruit are brown rot, nutrient
deficiency, and shot hole. In developing countries, farmers mostly rely on experts in pathology
laboratories to detect and manage the diseases [4]. Detection of disease at its early stage is crucial to
stop its spread to the entire plant and field, especially in fruit trees.
     Disease detection in fruit plants has always been a challenge for farmers to look after the entire
field by visiting each plant. In order to assist farmers in disease detection, different techniques
based on artificial intelligence and computer vision have been proposed to identify the disease along
with its severity level accurately. However, most of the experiments are performed in a controlled
environment [7]. Essential factors such as image angle, scale, direction, and brightness are often
ignored under such conditions. However, in a real environment, these have a direct impact on image
processing and accuracy. Further, some applications such as Plantix [8] and GreenR [9] have been
developed for disease identification by using cloud-based services. A farmer will send the captured
image to the cloud for disease detection and expert opinion, which is time-consuming. However, in
developing countries, internet connectivity is not available everywhere, and farmers in those regions
are unable to use these applications. Moreover, a lightweight algorithm needs to be developed as it has
to operate on smartphones. Technology needs to be transferred to the farmer so that the disease can be
detected with possible treatments on-field to maintain crop health and improve production.
     In this paper, the on-field disease detection and monitoring of plum fruit plants using a deep
learning algorithm has been proposed to maintain plant health by minimizing further infection. It will
help farmers detect early diseases in a plum fruit plant using smartphones in a real environment.
In this regard, a dataset of normal and abnormal images is collected locally under true field conditions.
The major diseases affecting plum fruit and leaves are brown-rot, nutrient deficiency, shot-hole (leaves),
and shot-hole (fruit). All these diseases were covered in the collected dataset. Disease identification
in plum fruit is a fine-grained classification problem where a healthy fruit is discriminated from an
unhealthy one based on subtle differences in color and texture of the fruit. For instance, a healthy fully
grown fruit can be confused with a fruit affected by shot-hole or brown-rot due to visual similarities
to some degrees. Similarly, nutrient deficiency in leaves and shot-hole (leaf) have identical visual
symptoms that make their detection very challenging. Using the dataset, we have trained and evaluated
multiple convolutional neural networks (CNNs) to perform disease detection in images captured
using mobile phones. While developing the proposed system, parameters related to images such as
angles, scales, direction, and external environment are considered in order to train a robust detection
model. The trained model is then optimized for deployment on resource-constrained mobile devices
by quantizing the network parameters from 32-bit floating point (FP32) to 16-bit floating point (FP16).
The final optimized model yields considerable accuracy and can be run conveniently on a mid-range
device, eliminating the need to access cloud services.
     The rest of the paper is organized as follows. The existing relevant literature is discussed in
Section 2. The proposed method is covered in Section 3, while the results and discussion are thoroughly
explained in Section 4. Finally, the paper is concluded along with future work in Section 5.

2. Literature Review
     In the literature, both traditional machine learning and deep learning approaches have been
widely used for disease identification in plants using image processing. Deep learning is considered
one of the capable approaches not only to identify disease but that is used for disease severity as
well. In [1], the publicly available PlantVillage [10] dataset of around 54,306 images in a controlled
environment was used for disease identification in plants. The deep convolutional neural network was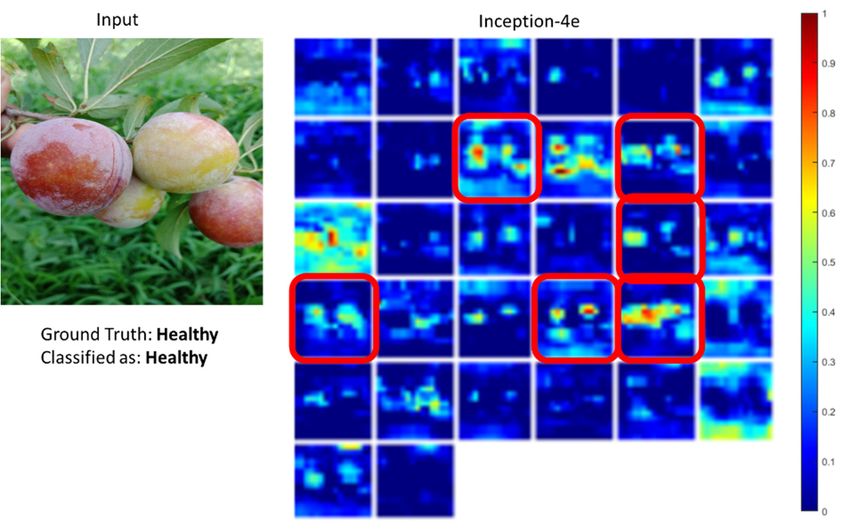
Sensors 2020, 20, 5569                                                                             3 of 18

trained and two of the most popular architectures AlexNet and GoogleNet were considered. The model
could recognize 14 different crops and 26 diseases with 99.35% accuracy. However, images with an
upper side of leaves were evaluated, which cannot always be the case in real life. Disease can be at
any part of the plant; therefore, datasets with many diverse images covering the whole plant may be
required to accurately identify diseases. In [11], a deep learning method was used to automatically
estimate the severity of plant disease by considering apple leaves from the PlantVillage [10] dataset.
The authors have further annotated the healthy and black rot apple images that restrict the model only
to one disease severity estimation. The authors were of the recommendation that the deep VGG16
model with transfer learning had an accuracy of 90.4%. However, the experiments were performed
only on one disease, black rot, by considering only leaves. Further, most of the experiments in the
literature were performed on leaves only and in a controlled environment, while the images in real-time
in fields can be very challenging. Most of the factors that affect the quality of the captured images due
to harsh field conditions were not considered.
      Convolutional neural network (CNN) architectures have been widely used for plant disease
identification [12]. The method was trained and tested by considering a public dataset containing
87,848 healthy and diseased leaves images. The dataset had a combination of images taken in a
controlled and on-field environment. The 80/20 ratio was considered for training/testing. Authors
achieved an accuracy of 99.53% in the classification of 20% of unseen images with VGG-16 architecture.
The training and testing images were taken from the same database, which is commonly used in a
classification-based model. However, the images taken in the field by farmers are more challenging,
having different issues that are not considered in this approach. In [5], two approaches are adopted,
the transfer learning method that is based on densely connected convolutional networks for plant
disease detection on the server side, and a lightweight deep neural networks approach for end devices
having constrained resources. The model performance was investigated using differently sized images
at the input to come up with optimal image input sizes for different scenarios. The proposed model
was trained and evaluated by considering a public dataset under a controlled environment. In [13], the
authors proposed a deep meta-architecture approach to detect and locate infected regions in plants
using three techniques. The region may be leaf, stem, or any other location. The system distinguishes
the detected damaged plant section to be either an abiotic disorder or caused by an infectious agent
(virus, bacteria, fungus, etc.). In other words, the system can detect whether the damaged region of
the plant is because of noninfectious factors (low temperature, nutritional imbalance, etc.) or because
of infectious microbes like viruses, bacteria, fungi, or nematodes. Authors have based the proposed
deep meta-architecture of object recognition and classification mainly on three architectures, namely
Faster Region-based Convolutional Networks (Faster R-CNN), Single Shot Multibox Detector, and
Region-based Fully Convolutional Networks (R-FCN).
      Authors in [7] proposed a two-stage algorithm tackling the problem of plant disease detection in
complex background environments and severe environmental conditions. The authors claimed to have
collected the largest image dataset of around 80 thousand images of 12 different species with 42 distinct
classes. Augmentation of the dataset has been performed using traditional augmentation like geometrical
and intensity transformation techniques and synthetic data generation from an existing dataset using
a trained 5-layer deep convolutional generative adversarial network (DCGAN). For production of
high-resolution images for the efficient training phase, the progressively growing GAN (ProGAN)
technique was used to reconstruct high-dimensional images (typically 255 × 256) from smaller
convolution blocks (128 × 64 × 3, 64 × 3, 64 × 128 × 3) in the discriminator network. This reconstruction
of high-dimensional images was even more strengthened using a StyleGAN that amalgamates both
ProGAN and neural style transfer. The trained StyleGAN combined with the backpropagation
technique were used as a learning process for the diseased/infected portion of the leaf. The model,
however, fails to produce desirable results with complex backgrounds, which is usually faced in
real-time uncontrolled environments. Experiments were performed using the trained model on 18
different classes of the PlantVillage dataset, and these classes are supported on the tested PlantDisease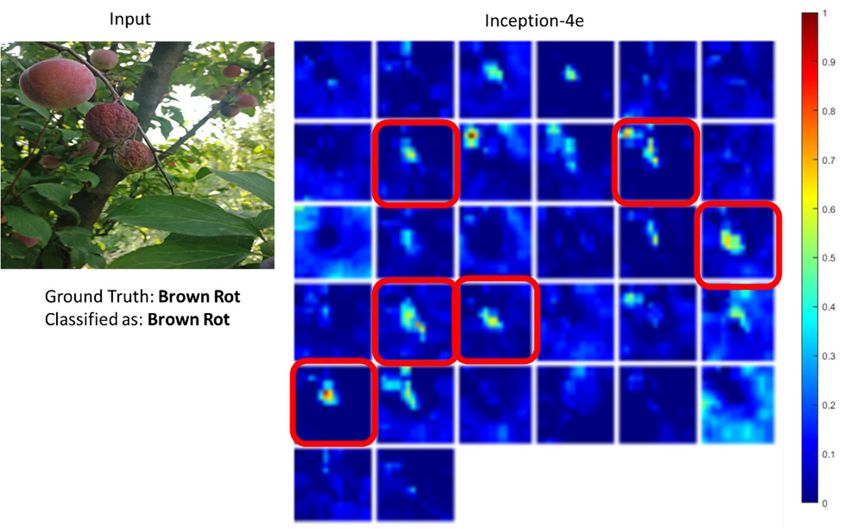
Sensors 2020, 20, 5569                                                                             4 of 18

dataset. For the AlexNet architecture, the model has achieved a validation accuracy of (99.13%,
81.24%) on (PlantVillage and PlantDisease Datasets), respectively. For DenseNet 201 and ResNet
152 architectures, the same validation accuracy was recorded to be (99.81%, 83.90%) and (99.75%,
82.92%), respectively.
      Authors in [14] considered 1567 images of roughly 14 plant species from the PlantVillage database
reflecting 79 different disease types. The images considered were captured with varying resolution
and sizes on different sensor types: Smartphone, DSLR, and compact cameras. In the training phase,
the controlled versus real field scenario images were of ratios 60% and 40%, respectively. The images
were first manually subdivided considering only the leaf portion of the plant as the main target region
for disease identification and classification with the backgrounds blacked out and the healthy portion
of the total images considered as at least 20% to have contrast with lesions and the affected region.
The authors based efficient CNN outcomes on the creation of a large and extended database (XDB)
by using various transfer learning and augmentation techniques intelligently. However, the effort of
database creation, claimed as several hundred hours, and the computation power required by GPUs
are becoming a hindrance for real-time applications.
      The authors in [15] studied the degradation problem in the training phase, which leads to
significant reduction in accuracy where the depth of the network reaches its threshold. Authors have
evaluated the use of a fine-tuned CNN for plant disease identification and classification on the freely
available PlantVillage image dataset on different architectures including VGG 16, Inception-v4, ResNet,
and DenseNets with a varying number of layers and respective image resizing constraints. Overall,
34,727 samples were taken into account with a validation set of 8702 samples and 10,876 images in the
test set. The authors claimed that a fine-tuned 121-layer DenseNets outperformed other architectures
on the ImageNet dataset for a higher training and validation accuracy of approximately 99.8% with
high epochs. The authors claimed better results of ResNet and DenseNets over Inception-v4 and
VGG, taking into account training time in training, computational requirements, efficiency obtained in
transfer learning, convergence, weight requirement, and final accuracy with minimal loss.

3. Materials and Methods
      Keeping in view the fact that the images will be captured under true field conditions where
severe environmental lighting variations, sensory limitations of cheap mobile phone cameras, and the
unfavorable image capturing environment may make it very challenging for simple image processing
techniques to analyze [16], the whole process of image analysis was carefully designed to address
all these issues. First, we prudently considered the various challenges being faced during the initial
phase of the process. For instance, a farmer may capture the image of affected leaves or fruits at the
top of the tree while standing on the ground. That will result in capturing a lot of background noise,
loss of details due to the small scale of the objects of interest, and possibly motion blur. To cope with
these challenges, the proposed method has been optimized to work effectively in true field conditions.
Details of each step are provided comprehensively in the subsequent sections.

3.1. Preprocessing
     In a typical end-to-end learning environment, there is very limited or no preprocessing step
required. In most cases, the type of data available for training the end-to-end architecture is highly
feasible for input, thereby eliminating the need for any preprocessing. In this case, the input had to
be prepared so that it can be efficiently processed, and features can be effectively learned. Figure 1
shows the difference in scale for the objects of interest. For this purpose, extensive data augmentation
was adopted where new images were generated from existing ones by varying the scale, position, and
orientation. Details of the augmentations are provided in the subsequent sections.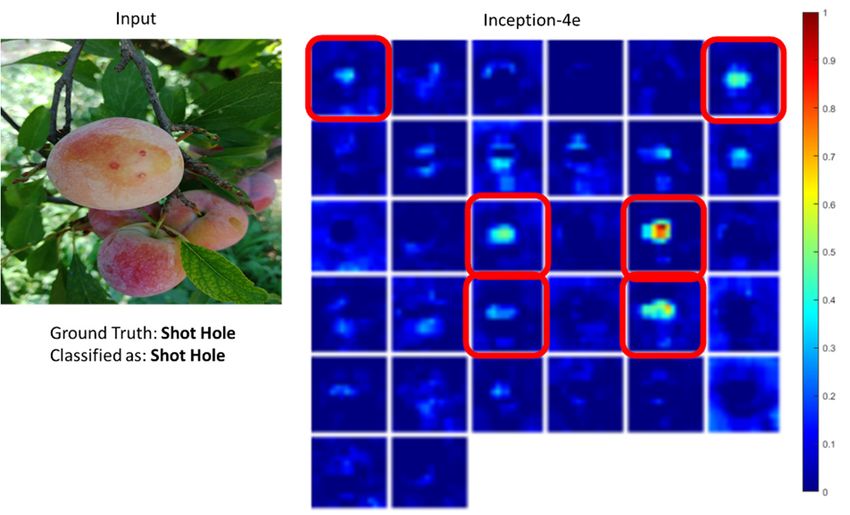
Sensors 2020, 20, x FOR PEER REVIEW 5 of 19
Sensors 2020, 20, 5569 5 of 18
Sensors 2020, 20, x FOR PEER REVIEW 5 of 19
Figure 1. Scale variation in captured images.
3.2. Data Augmentation Figure 1. Scale variation in captured images.
Figure 1. Scale variation in captured images.
3.2. Data Augmentation
Variations in scale, orientation, and position of the objects of interest in the images make
3.2. Data
predictions Augmentation
Variationsfor in
CNNs
scale,very challenging.
orientation, The network
and position has to cope
of the objects with in
of interest allthe
these variations
images in a robust
make predictions
manner.
for CNNs One
veryofchallenging.
Variations inthe mostorientation,
scale, popular approaches
The network and has towe
position cope canwith
of theuseobjects
in these
all situations like in
of variations
interest these
inthe isimages
to use
a robust data
manner.
make
augmentation.
One of the most It is a
popularprocess of
approachesgenerating
we can more
use images
in from
situations
predictions for CNNs very challenging. The network has to cope with all these variations in a robust existing
like these ones
is to by
use applying
data similarity-
augmentation.
preserving
It is a process
manner. Onetransformations.
ofofthegenerating For
most popular our approaches
more dataset,
images we from decided
we can to
existing useimplement
ones the following
by applying
in situations thesetransformations
likesimilarity-preserving
is to use data
to generate more
transformations.
augmentation. images.
It For
is a our dataset,
process we decidedmore
of generating to implement
images from the following
existing ones transformations
by applyingto generate
similarity-
more images.
preserving transformations. For our dataset, we decided to implement the following transformations
3.3.generate
to Geometric Transformations
more images.
3.3. Geometric Transformations
Several geometric transformations, including scaling (3), rotation (5), and translation (image
3.3. Geometric
Several
cropping at theTransformations
geometric
center and transformations,
four corners = including 5), were applied scalingon (3),eachrotationimage(5), in and translation
the dataset (image
to obtain 13
cropping
additional at
Several the
images center
geometric and four corners
from transformations,
this transformation = 5), were applied on each image in
alone. scaling (3), rotation (5), and translation (image
including the dataset to obtain 13
additional images from this transformation alone.
cropping at the center and four corners = 5), were applied on each image in the dataset to obtain 13
3.4. Contrast
additional Adjustments
images from this transformation alone.
3.4. Contrast Adjustments
This transformation was applied to images in order to eliminate the effects of contrast variations
3.4. Contrast
in images due Adjustments
This transformation
to varyingwas applied
lighting to images
conditions in in
theorder
field.toThe
eliminate
contrast thestretching
effects of method
contrast defined
variationsin
in images
(1) was due
applied to varying
to imageswas lighting conditions
to introduce in the field. The contrast stretching method defined in (1)
This transformation applied tocontrast
images variations
in order toin images, the
eliminate as shown
effects in
of Figure
contrast2.variations
was applied to images to introduce contrast variations in images, as shown in Figure 2.
in images due to varying lighting conditions in the field. The contrast stretching method defined in
a f ( x, y ), f (x, y) < r1
1 contrast variations in images, as
(1) was applied to images to introduce a f ( x, y ) , f ( x, y ) < r shown
in Figure 2.
g ( x, y ) =a21 ( f ( x, y ) − r1 ) + s1 , r1 ≥ f ( x,1y ) < r2
(1)
g(x, y) = aa2 (f f((xx,, yy),
) − r1 ) + s1 , r1f (x, ≥ f y) (x,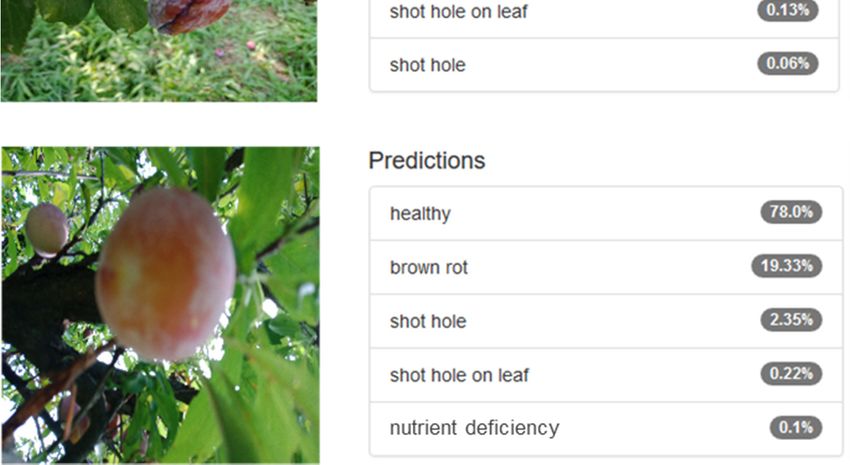
Sensors 2020, 20, x FOR PEER REVIEW 6 of 19
Sensors 2020, 20, x FOR PEER REVIEW 6 of 19
3.5. Brightness Adjustments
3.5. Brightness Adjustments
Environmental lighting variations can induce severe brightness changes in images. The gamma
Sensors 2020, 20, 5569 6 of 18
transforms (2) with varying amounts of gamma values for generating overly lit and under-lit images,
Environmental lighting variations can induce severe brightness changes in images. The gamma
as shown in Figure 3. Though the collected images did have such illumination-induced variations,
transforms (2) with varying amounts of gamma values for generating overly lit and under-lit images,
this
as transformation helped improve the variations even further.
as shown
shownin inFigure
Figure3.3.Though
Thoughthe
thecollected
collectedimages
imagesdid have
did havesuch illumination-induced
such variations,
illumination-induced this
variations,
transformation helped improve the variations even further.
( x, y ) = αeven
this transformation helped improve the gvariations , y )γ
. f ( xfurther. (2)
=α
gg((xx,, yy)) = ( xy, )yγ)γ
α·.ff(x, (2)
(2)
Figure 3. (a) Low-brightness, (b) medium-brightness, and (c) high-brightness images.
Figure 3. (a) Low-brightness, (b) medium-brightness, and (c) high-brightness images.
Figure 3. (a) Low-brightness, (b) medium-brightness, and (c) high-brightness images.
3.6.
3.6. Saturation
Saturation Adjustment
Adjustment
3.6. Saturation
Mobile Adjustment
Mobile phone
phone sensors vary
sensors vary widely
widely based
based onon the
the quality
quality of
of the
the sensors.
sensors. Low-cost
Low-cost mobile
mobile phones
phones
often come with
oftenMobile
come with mediocre
mediocrecameras
camerasthat
thathave
haveaapoor
poorquality
qualityofofcapturing
capturing colors.ToTo
colors. reduce
reduce thethe effects
effects of
phone sensors vary widely based on the quality of the sensors. Low-cost mobile phones
of such
such sensory limitations, the saturation of images was slightly adjusted to generate high-saturation
oftensensory
come withlimitations,
mediocrethe saturation
cameras of images
that have a poorwas slightly
quality adjusted to
of capturing generate
colors. high-saturation
To reduce the effects
and
and low-saturation
low-saturation image
image samples.
samples. For
For this
this purpose,
purpose, RGB
RGB images
images were
were first
first converted
converted to
to the
the Hue-
Hue-
of such sensory limitations, the saturation of images was slightly adjusted to generate high-saturation
Saturation-Intensity
Saturation-Intensity (HSI) color
(HSI) color model,
model, and then after adjusting saturation, they were converted back
and low-saturation image samples. Forand
thisthen after adjusting
purpose, RGB images saturation, they
were first were converted
converted back
to the Hue-
to
to RGB.
RGB. Some
Some of
of the
the results
results of
of saturation
saturation adjustment
adjustment have
have been
been shown
shown in
in Figure
Figure 4.
4.
Saturation-Intensity (HSI) color model, and then after adjusting saturation, they were converted back
to RGB. Some of the results of saturation adjustment have been shown in Figure 4.
Figure 4. (a) Low-saturation, (b) medium-saturation, and (c) high-saturation images.
Figure 4. (a) Low-saturation, (b) medium-saturation, and (c) high-saturation images.
4. Convolutional Neural Networks for Visual Recognition
Figure 4. (a) Low-saturation, (b) medium-saturation, and (c) high-saturation images.
4. Convolutional Neural Networks for Visual Recognition
Convolutional neural networks (CNNs) have been widely used for visual recognition tasks like image
4. Convolutional
Convolutional
classification Neural
neural
[17], object Networks
networks
detection andfor Visual
(CNNs)
recognition Recognition
have been widely
[18–20], imageused for visual
matching recognition
[21–23], tasks like
image in-painting,
image classification
and aConvolutional
variety of other [17], object
similar detection
challenging and
tasks.recognition
Its superior [18–20],
capabilityimage matching
to automatically [21–23], image
identify in-
useful
neural networks (CNNs) have been widely used for visual recognition tasks like
painting,
features and raw
from a variety
image of other similar challengingchoice
tasks.forItscomputer
superior vision
capability to automatically
image classification [17], data
objectmakes it a compelling
detection and recognition [18–20], image matching researchers
[21–23], [24].
image Asin-
a
identify
result, useful features
significant research from has raw
beenimage data makes
conducted on the itdevelopment
a compelling choice
and use offorCNNs
computerfor vision
various
painting, and a variety of other similar challenging tasks. Its superior capability to automatically
researchers
challenging [24]. As
visual a result, significant
recognition research has beenfrom
conducted on the development and use of
identify useful features fromtasks.
raw Architectures
image data makes ranging straightforward
it a compelling choicetofor
highly branched
computer and
vision
CNNs for various
sophisticated networkschallenging
have been visual recognition
developed tasks.to
and shown Architectures
perform ranging from
exceptionally well straightforward
for theand
intended
researchers [24]. As a result, significant research has been conducted on the development use of
to highly
tasks. branched and sophisticated networks have been developed and shown to perform
CNNsIn forthis research,
various we experimented
challenging with several
visual recognition network
tasks. architectures,
Architectures including
ranging plane networks
from straightforward
exceptionally
like AlexNet well
[24] andforVGG-16
the intended
[25] andtasks. In this research, we
sophisticated likeexperimented with Resnet
several network
to highly branched and sophisticated networks networks
have been Inception [26]
developed andand shown to[27]. Each
perform
architectures,
of these including
architectures has plane
its networks
strengths and like AlexNetFor
weaknesses. [24] and VGG-16
instance, AlexNet [25]
is andtosophisticated
easy develop and
exceptionally well for the intended tasks. In this research, we experimented with several network
networks
train; like Inception
however, including [26]
it provides plane and Resnet
lower accuracy [27]. Each of these architectures has its strengths and
architectures, networksdue to the
like relatively
AlexNet [24]shallow depth of[25]
and VGG-16 the network by today’s
and sophisticated
standards.
networks like VGG-16, on the[26]
Inception other
and hand, is an[27].
Resnet extensive
Each and deep architectures
of these network, but ithas is tough to train and
its strengths and
prone to overfitting. The Inception network is a very robust architecture having the built-in capability to
process images at multiple scales. It is also more suited for deployment in mobile applications.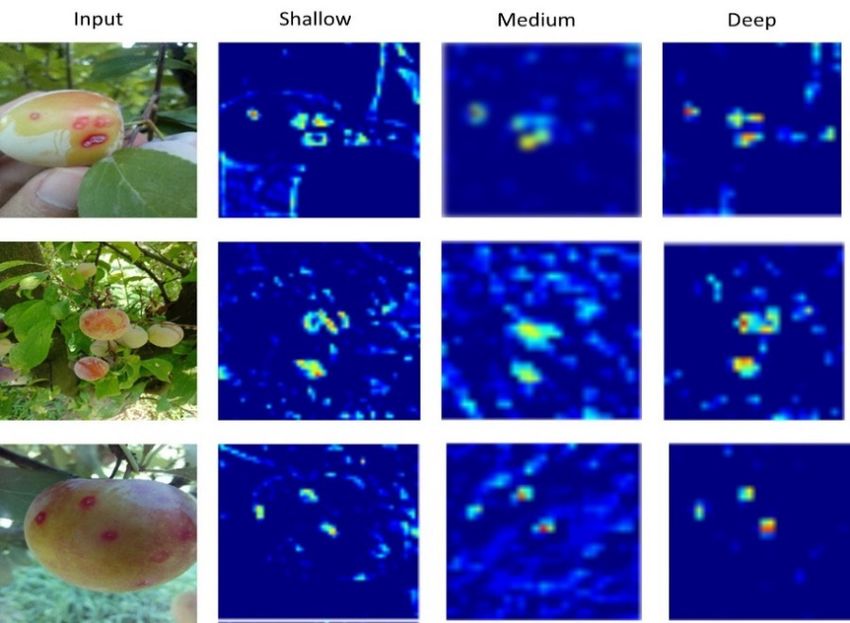
Sensors 2020, 20, x FOR PEER REVIEW 7 of 19
weaknesses. For instance, AlexNet is easy to develop and train; however, it provides lower accuracy
due to the relatively shallow depth of the network by today’s standards. VGG-16, on the other hand,
Sensors 2020, 20, 5569 7 of 18
is an extensive and deep network, but it is tough to train and prone to overfitting. The Inception
network is a very robust architecture having the built-in capability to process images at multiple
scales. It is also more suited for deployment in mobile applications.
4.1. Network Architecture
4.1. Network Architecture
Inception-v3 [26] is the third version of the famous GoogLeNet [28] architecture that won the
ImageNet Large Inception-v3 [26] isRecognition
Scale Visual the third version of the famous
Challenge GoogLeNet
(ILSVRC) [29] in[28] architecture
2014. that won the
It is a powerful and robust
ImageNet Large Scale Visual Recognition Challenge (ILSVRC) [29] in 2014. It is a powerful and robust
CNN architecture developed by Szegedy et al. in 2015 to compete in the ILSVRC 2015, where it was the
CNN architecture developed by Szegedy et al. in 2015 to compete in the ILSVRC 2015, where it was
first runner-up.
the first This network
runner-up. This has improved
network inception
has improved modules
inception and
modules andadded
addedaafew moretweaks
few more tweaksto to obtain
better performance
obtain better and efficiency
performance andthan the previous
efficiency versions.
than the previous Multi-scale
versions. processing
Multi-scale processingatatinception
modules was inception modules
a vital wasof
feature a vital
these feature
modulesof these
andmodules and for
a reason a reason
theirfor their superior
superior performance
performance in so many
in so many tasks. With this version, they factorized the large convolutional filters into pairs of one-
tasks. With this version, they factorized the large convolutional filters into pairs of one-dimensional
dimensional filters in the horizontal and vertical directions, as shown in Figure 5. That helped them
filters in the horizontal
achieve and vertical
similar multi-scale directions,
analysis as shownreduced
with a significantly in Figure 5. That helped
computational cost. them achieve similar
multi-scale analysis with a significantly reduced computational cost.
Figure 5. Inception module (Inception-v3).
Sensors 2020, 20, x FOR PEER REVIEWFigure 5. Inception module (Inception-v3). 8 of 19
The network,
computational
as shown in we
efficiency,
Figure 6,toinputs a 299 × 299 × 3 image and is processed initially by five
The network, as shown inopted
Figure 6,use this network
inputs a 299 × 299to ×detect
3 imageplum's
and isdiseases.
processed However,
initiallywe
by had
five
convolutional layers where
to either trainlayers
convolutional each
this model
where fromlayer applies
scratch
each layer several
or apply
applies several 3 ×
transfer 3 kernels
learning
3 × 3 kernels on the
onintheorder input. Afterward,
input.toAfterward,
make this amodel series a series
of inception
of modules
recognize
inception process
diseases
modules thethe
inprocess input
target
the before
dataset.
input As finally
before this performing
is aperforming
finally classification
multi-classclassification
classification at the
at problem,
the end the
by aendcostby a fully
fully
function
layer. we
connectedconnected usedUnlike
layer.
Unlike with
the thethenetwork
previous
previous was categorical
versions,
versions, cross-entropy,
Inception-v3
Inception-v3 hashas asonly
only shown in Equation
one auxiliary
one (3).classifier,
classifier,
auxiliary which, which,
accordingaccording to the authors, acts as a regularizer.
to the authors, acts as a regularizer.K Between Between the blocks of inception modules, there is an
the blocks of inception modules, there is an
efficient grid size-reduction block. Instead l = −ofapplying
log( p (kto
))qa(pool
k ) for reducing the spatial dimensions (3)
efficient grid size-reduction block. Instead
of the input block, the activation dimension of applying to
k =1is first expanded a poolusingfor1 reducing the spatial
× 1 convolutions, and then dimensions
of the input block,
pooling the
where l isoperation
activation
the loss, Kisis applied.
dimension
the number This is
helpslabels
of class
first
retain expanded
expressiveness
(in this
using 1
in the
case, k = 5), and
× 1 convolutions,
p(k) model and avoids
is the probability of
and then
representational
pooling operation
label k. Minimizing bottlenecks.
is applied. All
Thisinhelps
l results these tweaks
retain the
maximizing make
expressiveness this
log-likelihood of architecture
in the
thelabel,
model very robust
and avoids
selected for
according visual
representational
to the
recognition
bottlenecks.
ground tasks.
All truth
these tweaks make
distribution q(k). this architecture very robust for visual recognition tasks.
This network has been pre-trained on the ImageNet dataset to classify 1000 different types of
objects in images. Due to its superior performance, integrated multi-scale processing, and
Figure 6. 6.Inception-v3
Figure architecture.
Inception-v3 architecture.
4.2. Network Training and Fine-Tuning
Training CNNs require large datasets and much computational power. However, training a
robust and high-performance CNN requires a large but carefully designed dataset covering sufficient
representative samples. The choice of a capable architecture for a particular problem is also key to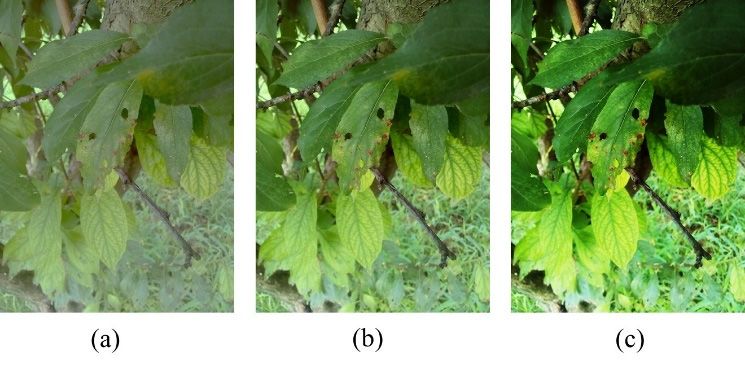
Sensors 2020, 20, 5569                                                                                   8 of 18

      This network has been pre-trained on the ImageNet dataset to classify 1000 different types of objects
in images. Due to its superior performance, integrated multi-scale processing, and computational
efficiency, we opted to use this network to detect plum’s diseases. However, we had to either train
this model from scratch or apply transfer learning in order to make this model recognize diseases in
the target dataset. As this is a multi-class classification problem, the cost function we used with the
network was categorical cross-entropy, as shown in Equation (3).

                                                 K
                                                 X
                                           l=−          log(p(k))q(k)                                       (3)
                                                 k =1

     where l is the loss, K is the number of class labels (in this case, k = 5), and p(k) is the probability of
label k. Minimizing l results in maximizing the log-likelihood of the label, selected according to the
ground truth distribution q(k).

4.2. Network Training and Fine-Tuning
      Training CNNs require large datasets and much computational power. However, training a
robust and high-performance CNN requires a large but carefully designed dataset covering sufficient
representative samples. The choice of a capable architecture for a particular problem is also key to
achieving optimal performance. To this end, we trained a collection of different CNNs like AlexNet,
VGG16, Inception-v1, and Inception-v3. These networks were trained on the target dataset to assess
their performance. Although we were able to achieve around 86% performance with Inception-v3, we
experimented with transfer learning in these models as well. The pre-trained models were previously
trained on the ImageNet dataset. It is a large dataset of around 14 million images consisting of 21,841
different categories. It is essential to mention here that ImageNet contains 4486 synsets of plant, flora, or
plant life, where each synset contains thousands of images covering a wide variety of plants. Though
these CNNs were trained on one million representative images from 1000 categories, they can recognize
a wide variety of plants as well. This makes CNNs trained on this dataset highly suitable for fine-tuning
on other plant datasets. Such a model not only gets better at recognizing objects of interest but also
performs better at rejecting irrelevant objects in the background.
      Fine-tuning or transfer learning is the process of reusing parameters from pre-trained networks.
Instead of randomly initializing network parameters, they are initiated with the parameters of pre-trained
networks. This way, the network does not have to work hard to understand and learn essential visual
features. Rather, the features extraction pipeline of ImageNet pre-trained networks is quite robust and
diverse and can be effectively used to initialize networks for any visual recognition task. In addition
to parameter initialization, we removed the last classification layer and added our layer according
to the number of classes in the target dataset. The network was retrained for several epochs with a
reduced learning rate so that most of the previously acquired knowledge was retained in the network.
Fine-tuning moderately updates the parameters to achieve optimal performance on the target dataset.
Settings for the various hyper parameters of various networks used in this study are provided in Table 1.
Images in the dataset were resized according to the input requirements of each model for training and
evaluation. In the case of fine-tuning, we were restricted to use the default input resolutions. However,
in the case of newly trained models, higher-resolution inputs can be used. Unfortunately, doing so
will increase the computational burden due to the increase in the number of convolution operations
(due to larger activations maps) and the number of network parameters, which is not desirable in our
case. Therefore, default input sizes were used with every network. Larger batch sizes were used for
the relatively shallow AlexNet model. VGG16 is a very memory-intensive model; therefore, we had
to set the batch size to 8. Due to the memory constraints, we could not set the batch sizes for both
Inception models beyond 32. For the deep Inception-v3 model, the RMSProp optimization scheme
was used to ensure faster convergence. For the rest of the networks, we used stochastic gradient
descent with momentum (SGD-M). The learning rate for the newly trained models was set to 0.01 with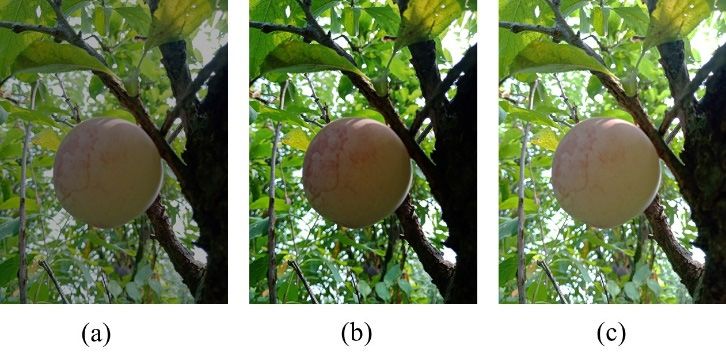
Sensors 2020, 20, 5569                                                                                                  9 of 18

an exponential decay. For fine-tuning, it was set to 0.005 in the beginning, which would decrease to
0.00005 in three steps. These parameters were set after thorough evaluation of these architectures.

                                     Table 1. Network training and fine-tuning parameters.

                                 AlexNet                  VGG-16             Inception-v1               Inception-v3
    Parameter            Train       Fine-Tune    Train      Fine-Tune   Train      Fine-Tune      Train       Fine-Tune
 Input                     227 × 227 × 3             224 × 224 × 3          224 × 224 × 3               299 × 299 × 3
 Batch size              128          128           8            8         32          32            16            16
 Optimization
                     SGD-M            SGD-M      SGD-M        SGD-M      SGD-M       SGD-M       RMSProp       RMSProp
 Scheme
 Momentum              0.9          0.9          0.9          0.9          0.9          0.9          0.9           0.9
 Weight decay          0.1          0.1          0.1          0.1          0.1          0.1          0.1           0.1
 Learning rate      0.01–0.0001 0.001–0.00001 0.01–0.0001 0.001–0.00001 0.01–0.0001 0.005–0.00005 0.01–0.0001 0.005–0.00005

5. Experiments and Results
     In this section, performance details with both freshly trained CNNs and fine-tuned CNNs are
provided in detail, along with an in-depth analysis of the convolutional layers’ sensitivity to affected
regions in images.

5.1. Dataset Collection and Annotation
     The dataset was collected from different areas of Khyber Pakhtunkhwa province in Pakistan.
Mainly, the orchards in the Swat district inside Malakand Division were surveyed with a 15 day interval
from June to September 2019. This allowed us to capture images of fruits at a variety of growth stages.
The plum fruit usually takes about 2 months to reach maturity on a tree with an age between 5 and
12 years. Plum trees less than 5 years old were also covered in the dataset. Images were captured
using a wide variety of mobile phones including a Samsung Galaxy S8 (16 MP) (Samsung, Seoul,
Korea), Huawei (5 MP) (Shenzhen, China), Oppo A33 (8 MP) (Dongguan, China), and some (4 MP)
cameras so that a varying degree of image quality could be obtained. Captured image resolutions were
3456 × 4608 (16 MP), 1920 × 2560 (5 MP), 2400 × 3200 (8 MP), and 2560 × 1440 (4 MP), respectively. Mobile
cameras these days have become high-resolution ranging from 4 to 16 MP in the mid-range devices.
Considerable detail was captured with the sensors used, which helped in producing augmented
images with sufficient quality to enable effective training. A total of 5000 images were captured and
annotated into five different categories, namely healthy, brown rot, shot hole fruit, shot hole leaf, and
nutrient deficiency. Images were annotated on the basis of visual symptoms appearing on fruits and
leaves, overall field conditions, and the presence of pathogens with the assistance of Plant Pathologist
(Agricultural Research Institute, Mingora Swat, Pakistan). The class frequencies for various categories
in the dataset are given in Figure 7. Classes were not perfectly balanced; however, the difference in
frequencies is not substantial. Through data augmentation, 19 different versions of each image were
generated, which resulted in a dataset having 100,000 images. The images were captured at different
times of the day and under varying environmental lighting conditions.
     The dataset was divided into training, validation, and test sets prior to data augmentation
with ratios of 60%, 20%, and 20%, respectively. This allowed appropriate portions of both real and
augmented images to be kept in all three sets so that the training and evaluation can be performed
effectively. To test the robustness of the final trained model, some images of plum with healthy and
diseased fruits were downloaded from the internet to test the performance of the model. A total of 100
images with 20 images in each category were used in this test.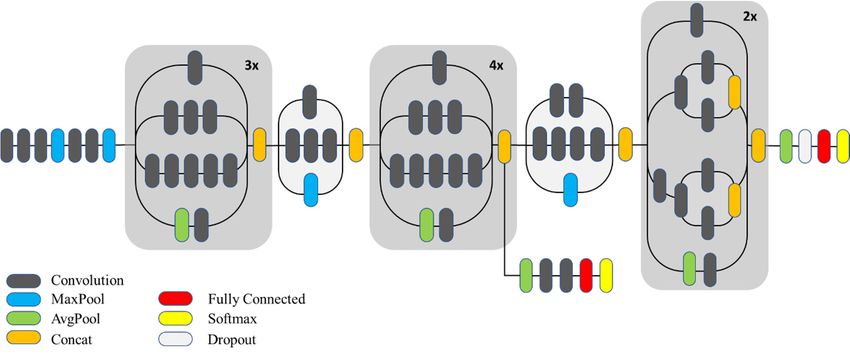
ratios of 60%, 20%, and 20%, respectively. This allowed appropriate portions of both real and
augmented images to be kept in all three sets so that the training and evaluation can be performed
effectively. To test the robustness of the final trained model, some images of plum with healthy and
diseased fruits were downloaded from the internet to test the performance of the model. A total of
Sensors
100 2020, 20,
images 556920 images in each category were used in this test.
with 10 of 18
30
23.53
22.82
20 18.94
18.24
Frequency %
16.47
10
0
brown rot healthy nutrient deficiency shot hole shot hole on leaf
Category
Figure 7. Class frequencies.
Figure 7. Class frequencies.
5.2. Experimental Setup
5.2. Experimental Setup
All the experiments were conducted on a system running Microsoft Windows 10 (Redmond, WA,
All the experiments
USA) powered by an Intelwere conducted
Core-i5 CPU (San on Jose,
a system running
CA, USA) Microsoft
equipped withWindows
16 GB RAM.10 (Redmond,
The deep
Washington, USA) powered
learning experiments by an Intel
were carried Core-i5
out on CPU (San
an Nvidia GeForceJose,GTX
CA, 1060
USA)GPU
equipped
(Santawith 16 CA,
Clara, GB RAM.
USA)
The
withdeep learningThis
6GB VRAM. experiments
GPU has were carried cores
1280 CUDA out on an is
and Nvidia
capableGeForce GTXfairly
of training 1060 complex
GPU (Santa Clara,
networks.
CA, USA)
Google with 6GB (Mountain
TensorFlow VRAM. This GPUCA,
View, hasUSA),
1280 CUDA cores (UC
BVLC Caffe and Berkeley,
is capableCA,
of training fairly complex
USA), Nvidia DIGITS,
networks.
and MathWorks Google TensorFlow
MATLAB 2019b(Mountain
(Natick, MA, View,
USA)CA, USA),
were usedBVLC Caffe (UC Berkeley,
for pre-processing, CA, USA),
data augmentation,
Nvidia
training,DIGITS, and MathWorks
and evaluation. DifferentMATLAB
experiments 2019b
were (Natick,
designed Massachusetts,
to evaluate theUSA) were
efficacy ofused for pre-
the proposed
processing, data augmentation, training, and evaluation. Different experiments were
method. In the first experiment, the overall detection and classification accuracy was measured. In furtherdesigned to
evaluate
experiments,the the
efficacy of the proposed
convolutional activationsmethod. In the model
of the trained first experiment,
were analyzed thetooverall
observedetection and
its sensitivity
classification accuracy was measured. In further experiments, the convolutional activations
to diseased areas of the plants in the presence of background. This analysis helped us determine the of the
trained modelofwere
effectiveness analyzedprocess
the training to observe its sensitivity identifying
in automatically to diseased areas of the plants
the affected regionsin in
thethe
presence
image.
of background.
Results producedThis analysis
by the helped
proposed methodus ondetermine the effectiveness
test sets were of the
verified by Plant training process in
Pathologist.
automatically identifying the affected regions in the image. Results produced by the proposed
5.3. Sensitivity
method on testofsets
Neurons
were in Deep Layers
verified to Affected
by Plant Fruit
Pathologist.
Neurons in deeper layers become sensitive to regions of interest in target images when fully
trained. The study of activation maps reveals how and which neurons have become sensitive to the
regions of interest. In this case, the regions of interest are the affected fruit or leaf in the image or the
lesions on the fruits. In this regard, convolutional activation maps were analyzed by overlapping them
onto original images. It was observed that, in most cases, the high activations of a small number of
maps aligned with the affected regions of the image. Certain neurons in the convolutional network
were producing high activations at those areas. Which defined the category label of the image, despite
the presence of background clutter. This verifies that the CNN trained with the proposed method on
the dataset has mainly learned useful features. Figure 8 shows some of the activation maps for their
corresponding input images, taken from different layers of the network. It can be seen that the shallow
layer activation maps were able to highlight the affected parts of the image, though not perfectly,
which is reasonable as these layers typically learn low-level features. As we move deeper into the
network, the activation maps get cleaner, and only the specific regions of the images are highlighted
while rejecting the rest of the image (background). This analysis was carried out for all the models,the dataset has mainly learned useful features. Figure 8 shows some of the activation maps for their
corresponding input images, taken from different layers of the network. It can be seen that the
shallow layer activation maps were able to highlight the affected parts of the image, though not
perfectly, which is reasonable as these layers typically learn low-level features. As we move deeper
into the network, the activation maps get cleaner, and only the specific regions of the images are
Sensors 2020, 20, 5569 11 of 18
highlighted while rejecting the rest of the image (background). This analysis was carried out for all
the models, where activation maps from specific convolution layers were overlapped onto the image.
The results
where obtained
activation maps from
from thespecific
Inception-v3 modellayers
convolution were the were most promising.
overlapped Figure
onto 9 showsThe
the image. activation
results
maps from
obtained froma deep convolutional
the Inception-v3 layerwere
model (inception-4e) in Inception-v3.
the most promising. FigureThe highlighted
9 shows activation maps
mapsindicate
from
the affected regions in images with high activations, which shows that
a deep convolutional layer (inception-4e) in Inception-v3. The highlighted maps indicate the affectedthe network has adapted to
the newindataset
regions images andwith hashigheffectively
activations,learned to identify
which shows that the regions
networkin has
the adapted
image leading to its
to the new final
dataset
prediction.
and It is alsolearned
has effectively important to note here
to identify that in
regions a unique
the image set of neurons
leading generate
to its high activations
final prediction. for
It is also
a particular
important to category.
note here For that instance,
a unique in setthe case of healthy
of neurons generatesamples, a mostlyforunique
high activations set of category.
a particular neurons
generate
For highinactivations
instance, unlike those
the case of healthy samples,in the case of
a mostly brown-rot
unique set of and shot-hole.
neurons generateSimilarly, neurons
high activations
sensitive
unlike to brown-rot
those in the case remain inactive
of brown-rot andinshot-hole.
all other cases.
Similarly, Thisneurons
shows that the neurons
sensitive in theremain
to brown-rot model
have learned
inactive in all to recognize
other cases. Thisunique
shows patterns in neurons
that the the images. In model
in the the case of samples
have learned (a, b, and c), unique
to recognize correct
predictions
patterns in thewere madeInand
images. thethe
casesetofof high activation
samples (a, b, andmaps havepredictions
c), correct been highlighted
were made in red.
andInthe
thesetcase
of
high activation maps have been highlighted in red. In the case of sample (d), the model was unable toit
of sample (d), the model was unable to correctly recognize the brown-rot. If observed closely,
becomes recognize
correctly clear that thethe brown-rot.
lighting condition
If observedis not ideal itinbecomes
closely, this sample
clearand
thatthe
thefruit has acondition
lighting greener color,
is not
whichinled
ideal thistosample
this confusion and misclassification.
and the fruit has a greener color, which led to this confusion and misclassification.
Sensors 2020, 20, x FOR PEER REVIEW 12 of 19
Figure 8. Activation response of various convolutional layers to
to lesions.
lesions.
(a)
Figure 9. Cont.Sensors 2020, 20, 5569 12 of 18
(a)
(b)
Sensors 2020, 20, x FOR PEER REVIEW 13 of 19
(c)
(d)
Figure9.9.Activation
Figure Activationmaps
mapsoutput
outputofofaadeep
deepInception
Inception module
module in Inception-v3
Inception-v3 inin cases
cases of
of (a)
(a) brown
brown
rot, (b) shot hole, (c) healthy, and (d) brown rot. The sample in
rot, (b) shot hole, (c) healthy, and (d) brown rot. The sample in (d) has(d) has been incorrectly labeled as
incorrectly labeled as
healthy.The
healthy. Thered
redboxes
boxesindicate
indicateneurons
neuronswith
withaahigher
higher sensitivity
sensitivity to affected fruit even in
in the
thepresence
presence
ofof healthyfruit.
healthy fruit.
6. Disease Detection Performance
In this section, the disease detection performance of both newly trained and fine-tuned CNNs is
evaluated on the test set before and after data augmentation.Sensors 2020, 20, 5569 13 of 18
6. Disease Detection Performance
In this section, the disease detection performance of both newly trained and fine-tuned CNNs is
evaluated on the test set before and after data augmentation.
6.1. Performance with Newly Trained CNNs
All the models were trained for 30 epochs in order to evaluate their performance on the datasets
prior to augmentation and after data augmentation. Using the dataset prior to data augmentation, we
obtained results reported in Table 2. AlexNet achieved 53% accuracy on the test set, whereas the heavier
VGG16 model was overfit due to the relatively smaller dataset being insufficient to tune the extremely
large number of parameters. Both Inception models converged to some extent due to their superior
architectures achieving 69% and 75% accuracies, respectively. Data augmentation helped significantly
in model convergence and the achievement of much better performance. Performance improvements
ranging from 9% to 12% were recorded with the use of the augmented dataset. As expected, the models
yielded progressively better performance as we increased the depth and complexity of the networks,
as shown in Table 3. AlexNet achieved 64.06% accuracy, which is the lowest in our experiments. With
VGG-16, we were able to classify 78.68% of the test samples accurately. Inception networks performed
very well in this experiment, owing to their capability of processing at multiple scales inside the
inception modules. The recent version of the inception network yielded the best results of 86.81%.
Table 2. Performance of various convolutional neural networks (CNNs) newly trained on the dataset
without data augmentation.
Models Success Rate Loss Epoch
(Newly Trained) (Test) (Validation) (Convergence)
AlexNet 53.20% 1.084 27
VGG-16 33.11% 1.420 9 (overfit)
Inception-v1 69.33% 0.956 21
Inception-v3 75.92% 0.785 25
Table 3. Performance of various CNNs newly trained on the dataset with data augmentation.
Models Success Rate Loss Epoch
(Newly Trained) (Test) (Validation) (Convergence)
AlexNet 64.06% 0.879 16
VGG-16 78.68% 0.588 13
Inception-v1 81.94% 0.535 22
Inception-v3 86.81% 0.435 28
6.2. Performance with Fine-Tuned CNNs
In this experiment, we fine-tuned all the networks for 15 epochs on the target dataset before
and after data augmentation. Results reported in Tables 4 and 5 highlight the benefits of using data
augmentation with transfer learning. With fine-tuning on the augmented dataset, a considerable
improvement in classification performance was noticed in all networks, particularly in AlexNet and
VGG1-6. These architectures tend to benefit a lot from fine-tuning in this case due to the sheer number
of parameters in these networks. On the other hand, significant improvements were also recorded in
the Inception networks, where more than 90% accuracy was achieved with both networks. Inception-v3
resulted in a 94.34% accuracy after fine-tuning on the target dataset. Training progress of the fine-tuned
Inception-v3 is provided in Figure 10. The optimal model was achieved at around the 7th epoch, which
was used as the final model.
A class-wise prediction performance of the Inception-v3 model with the augmented dataset is
provided in Table 6. It can be seen that the model is able to correctly classify samples of brown-rot,Sensors 2020, 20, 5569 14 of 18
healthy, shot-hole (fruit), and shot-hole (leaf) categories with more than 90% accuracy. In the case
Sensors 2020, 20,
of nutrient x FOR PEERthe
deficiency, REVIEW
accuracy recorded was around 89%. Some of the samples in this category 14 of 19
were misclassified as shot-hole (leaf) and vice versa. It is understandable keeping in view the visual
Table
similarities in 3. Performance
both of Similarly,
categories. various CNNs
somenewly trained
healthy on thewere
samples dataset with dataclassified
incorrectly augmentation.
as brown-rot
due to a certain degreeModels
of similaritiesSuccess
in these Rate
categories.LossOverall, the model
Epochhas lower false-positive
and false-negative(Newly
rates, which
Trained)makes it suitable
(Test) for use in this application.
(Validation) (Convergence)
AlexNet 64.06% 0.879 16
Table 4. Performance of various pre-trained CNNs fine-tuned on the dataset without data augmentation.
VGG-16 78.68% 0.588 13
Inception-v1
Models 81.94%
Success Rate 0.535
Loss 22
Epoch
Inception-v3
(Fine-Tuned) 86.81%
(Test) 0.435
(Validation) 28
(Convergence)
AlexNet 75.67% 0.742 8
6.2. Performance with Fine-Tuned
VGG-16 CNNs 82.06% 0.492 14
Inception-v1 83.12% 0.428 12
In this experiment, we fine-tuned all
Inception-v3 the networks for0.414
86.74% 15 epochs on the 13
target dataset before and
after data augmentation. Results reported in Table 4 and Table 5 highlight the benefits of using data
augmentation with transfer
Table 5. Performance learning.
of various With CNNs
pre-trained fine-tuning on the
fine-tuned augmented
on the dataset withdataset, a considerable
data augmentation.
improvement in classification performance was noticed in all networks, particularly in AlexNet and
Models tend to benefit
VGG1-6. These architectures SuccessaRate Loss
lot from fine-tuning Epoch
in this case due to the sheer number
(Fine-Tuned)
of parameters in these networks. On the (Test) (Validation)
other hand, significant (Convergence)
improvements were also recorded in
AlexNet 81.25% 0.546 10
the Inception networks, where more than 90% accuracy was achieved with both networks. Inception-
v3 resulted in a 94.34% VGG-16 89.06%
accuracy after fine-tuning 0.292 dataset. Training
on the target 13 progress of the fine-
Inception-v1 91.44% 0.195 12
tuned Inception-v3Inception-v3
is provided in Figure 10. The optimal
94.34% model was achieved
0.146 7 at around the 7th
epoch, which was used as the final model.
Figure 10.
Figure Fine-tuning progress
10. Fine-tuning progress of
of Inception-v3
Inception-v3 with augmented dataset.
Table 4. Performance of various pre-trained CNNs fine-tuned on the dataset without data
Table 6. Confusion matrix Inception-v3 with augmented dataset.
augmentation.
Brown Rot Healthy Nutrient Deficiency Shot Hole Shot Hole on Leaf Per-Class Accuracy
brown rot
Models
96.30
Success Rate
1.85 0.00
Loss 1.85
Epoch
0.00 96.30%
healthy (Fine-Tuned)
2.50 97.50 (Test)0.00 (Validation)
0.00 (Convergence)
0.00 97.50%
nutrient deficiency 0.00 0.00 88.89 0.00 11.11 88.89%
shot hole AlexNet 0.00
4.35 75.67%0.00 0.74295.65 8
0.00 95.65%
shot hole on leaf 0.00
VGG-16 2.08 82.06%3.00 0.492 0.00 91.67
14 91.67%
Bold values
Inception-v1 represent the
83.12% True-Positives in
0.428 the confusion matrix.
12
Inception-v3 86.74% 0.414 13
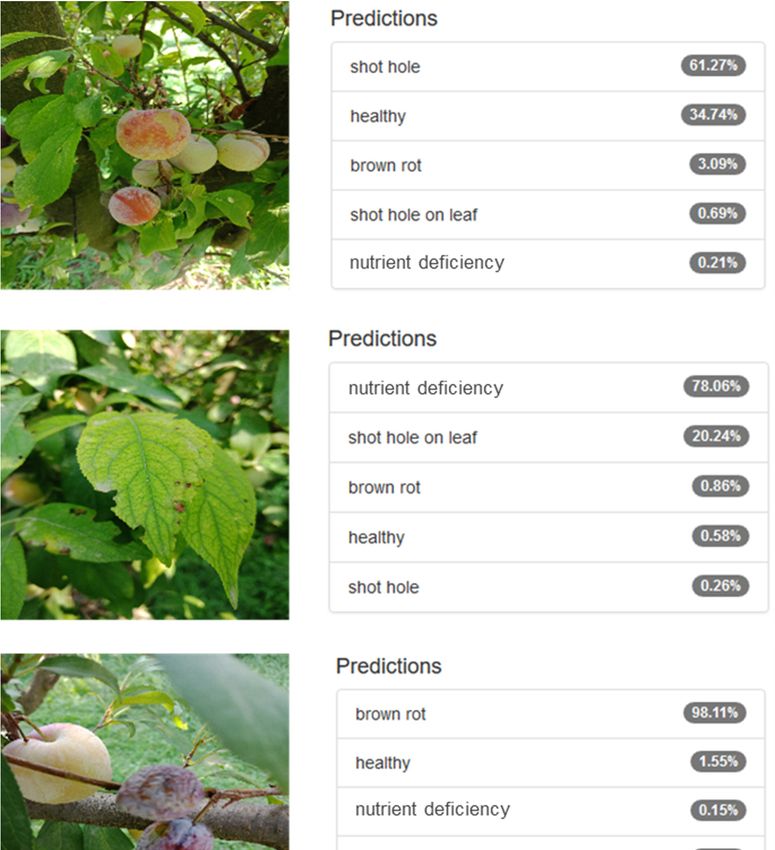
Prediction performance on some of the test images is provided in Figure 11. It is interesting to
note Table
that the model could
5. Performance correctly
of various classifyCNNs
pre-trained the image evenon
fine-tuned inthe
thedataset
presence
with of background
data objects.
augmentation.
For instance, in the first row, there is an unhealthy fruit in the image with shot-hole, which the model
Models Success Rate Loss Epoch
was able to classify correctly with 62% probability. However, looking at the predictions, it also indicates
(Fine-Tuned) (Test) (Validation) (Convergence)
AlexNet 81.25% 0.546 10
VGG-16 89.06% 0.292 13
Inception-v1 91.44% 0.195 12
Inception-v3 94.34% 0.146 7You can also read