Multigraph Modeling for Urban Distribution of Emergency Commodities with Semisoft Time Windows under Uncertainty - Hindawi.com
←
→
Page content transcription
If your browser does not render page correctly, please read the page content below
Hindawi
Journal of Advanced Transportation
Volume 2021, Article ID 8871952, 17 pages
https://doi.org/10.1155/2021/8871952

Research Article
Multigraph Modeling for Urban Distribution of Emergency
Commodities with Semisoft Time Windows under Uncertainty

 Hamid Tikani ,1 Mostafa Setak ,1 and Darya Abbasi 2

 1
 Department of Industrial Engineering, K. N. Toosi University of Technology, Tehran, Iran
 2
 Department of Industrial Engineering and Management Systems, Amirkabir University of Technology, Tehran, Iran

 Correspondence should be addressed to Mostafa Setak; setak@kntu.ac.ir

 Received 13 November 2020; Accepted 19 August 2021; Published 20 September 2021

 Academic Editor: Zhixiang Fang

 Copyright © 2021 Hamid Tikani et al. This is an open access article distributed under the Creative Commons Attribution License,
 which permits unrestricted use, distribution, and reproduction in any medium, provided the original work is properly cited.
 In this paper, we studied a stochastic bi-objective mathematical model for effective and reliable rescue operations in multigraph
 network. The problem is addressed by a two-stage stochastic nonlinear mixed-integer program where the reliability of routes is
 explicitly traded-off with total weighted completion time. The underlying transportation network is able to keep a group of
 multiattribute parallel arcs between every pair of nodes. By this, the proposed model should consider the routing decision in
 logistic planning along with the path selection in an uncertain condition. The first stage of the model concerns with the vehicle
 routing decisions which is not involved with random parameters; besides, the second stage of the model involves with the
 departure time at each demand node and path finding decisions after observation of random vectors in the first stage considering a
 finite number of scenarios. To efficiently solve the presented model, an enhanced nondominated sorting genetic algorithm II
 (NSGA-II) is proposed. The effectiveness of the introduced method is then evaluated by conducting several numerical examples.
 The results implied the high performance of our method in comparison to the standard NSGA-II. In further analyses, we
 investigated the beneficiary of using multigraph setting and showed the applicability of the proposed model using a real
 transportation case.

1. Introduction effective logistic network for rescue operations in the early
 post-disaster situations can significantly reduce the number
Natural and human-caused disasters are unforeseen and of victims.
unexpected events, which would cause catastrophic loss of In the traditional vehicle routing problem, the shortest
life, physical destruction, and massive economic disruption. route between nodes is taken into consideration as the
After any emergency events, the demands for medical distance between two different nodes. Considering only one
equipment, sanitation medicine, water, food, tents, blankets, arc between each pair of nodes may result in overlooking
and other relief commodities are expected to highly increase. some solutions from the solution region. In the real world,
Emergency Events Database (EM-DAT) was launched by the many transportation networks are multigraph which means
Center for Research in 1988 on the Epidemiology of Di- it is possible to reach the destination from an origin by
sasters. EM-DAT is a global database on disasters containing different paths with multiple features (cost, reliability, time,
essential core data on the occurrence and impacts of mass and so on) and conditions (such as traffic jams, weather
technological and natural disasters from 1900 to 2015 [1]. conditions, or accidents). Besides, disasters can seriously
Figure 1 shows that in the year 2015, natural disasters had a damage infrastructures leading to destroy the distribution
devastating impact on human societies. In the year 2015, 376 network. Therefore, considering the availability of alterna-
reported natural disasters caused the fatality of 22,765 tive paths in crisis management is a challenging but im-
people, made 110.3 million victims, and caused US $ 70.3 portant issue. The reason is that considering parallel edges in
billion damages [1]. According to the statistics, designing an the transportation network can substantially enhance the
2 Journal of Advanced Transportation

 700 500

 658
 658
 450
 437
 600 412 423 415
 400
 376
 365
 500 361
 362 350
 351
 330
 300
 400
 278
 259
 250
 345
 346

 341
 341
 300 227
 200
 284

 281
 206
 284

 281

 265
 267

 266
 255
 255
 231

 226

 226
 231

 150

 226

 226
 216
 216
 219

 200

 179
 173
 171

 179
 173
 171

 161
 161
 100

 147
 147

 142

 141
 142

 141
 100

 110
 109
 109

 110
 102
 102
 84

 50
 84

 70
 71
 71

 0 0
 1990 1991 1992 1993 1994 1995 1996 1997 1998 1999 2000 2001 2002 2003 2004 2005 2006 2007 2008 2009 2010 2011 2012 2013 2014 2015

 No. of reported victims (in millions)∗
 No. of reported disasters

 Figure 1: Trends in occurrence and victims of disasters [1].

achieved solutions’ quality and can accelerate the emergency than one connection between nodes with various traffic
response in disaster situations. The current study extends a patterns and reliabilities. Considering reliability in objec-
bi-objective optimization model based on Tikani and Setak tive along with other objectives will lead to more non-
[2] for the vehicle routing and distribution problem for relief dominated solutions which give managers more confidence
operations with the presence of multiple links between to make decisions.
vertexes where the links are differentiated by two inde- The remainder of this study is organized as follows. The
pendent attributes including different travel time and related literature and innovations of this paper are reviewed
reliability. in Section 2. In Section 3, the problem description and
 Crises are often unpredictable; as a result, one of the mathematical model are presented. In Section 4, the solution
most important issues which relief organizations are con- method is introduced. In Section 5, computational results
fronting is the high degree of uncertainty intrinsic in di- and case study are presented. Finally, the conclusion is stated
sasters. The mathematical model proposed by Tikani and in Section 6.
Setak [2] does not reflect uncertainty in the transportation of
post-disaster. Thus, in order to allow the model approache 2. Literature Review
the reality, we developed two-stage mathematical models in
an uncertain condition. The uncertainty in the reliability of Recently, emergency logistics management has received
links, demands of affected areas, and congestion of roads are considerable attention from researchers. In this section, the
captured by a finite number of possible scenarios. literature review is split into four subsections. In the first
 Some disasters impact the transportation infrastruc- part, the literature relevant to the post-disaster logistics
tures and links. Reliable logistic planning in post-disaster planning and reliability of distribution is discussed. In the
holds a pivotal role in ensuring the timely transferring of second subsection, we review the works relevant to the
relief goods to disaster areas and protecting the rescue team vehicle routing problem with semisoft time windows. In the
[3]. In this study, the reliability of the route is taken into third part of this section, the studies on routing problems in
account as an objective that scarcely has been addressed in multigraph networks are reviewed. The fourth subsection
the literature. We studied the problem in a multigraph focuses on works considering uncertainty in post-disaster.
network under uncertain conditions, and we have more Then, the contributions of the paper are presented.
Journal of Advanced Transportation 3

2.1. Related Works on Reliable Distribution in Post-Disaster. ε-constraint method was employed to solve the proposed
In post-disaster conditions, critical infrastructures might model. Tofighi et al. [11] formulated a two-echelon relief
fail. Therefore, in emergency logistics management, the logistics network design problem with determining the
expected reliability of selected roads is one of the vital items number of local distribution centers and central warehouses.
which should be considered as it holds an important role in Also, a relief distribution program for various crisis sce-
the timely and safe delivery of required facilities. Although narios was proposed. They developed a new two-stage
designing a reliable and safe dispatching process is im- scenario-based possibilistic-stochastic model. A meta-
portant, only a few works in the literature considered the heuristic algorithm was employed to solve the model. A
concept of reliability in the emergency dispatching. In this robust model for a three-level relief chain was proposed by
regard, Vitoriano et al. [4] developed the multiobjective Zokaee et al. [12]. They considered relief distribution centers,
mathematical model for relief operation problem that takes suppliers, and the disaster regions in an uncertain envi-
equity, time, priority, cost, security, and reliability into ronment. The model was employed to increase the satis-
consideration. A goal programming method was employed faction of people by minimizing the shortage of relief goods
to cope with different objectives. In another study, Hamedi and minimizing the relief operations’ costs. The capability of
et al. [5] proposed a model considering scheduling of their method was verified by a case study. Vahdani et al. [13]
supplies and reliable routing together over a time-dependent presented a two-stage, mixed-integer, multiobjective, mul-
network. A three-objective integer nonlinear programming ticommodity, and multiperiod model in the three-level relief
model was presented by Wang et al. [3] for the relief dis- chain. In the first phase, locations of the distribution
tribution problem. The objective functions were total cost, warehouses and centers with different capacity levels were
links reliability, and travel time. Liberatore et al. [6] pro- taken into consideration. In the second phase, they took the
posed a distribution model considering practical factors restricted hard time windows into account. They also
such as security and reliability. A multiobjective model was considered the reliability of the route in their study and
developed by Vahdani et al. [7]. They considered vehicle employed two metaheuristic algorithms to solve the pro-
routing, facility location, and emergency roadway repair posed problem. Li et al. [14] proposed a bi-objective rescue
operations in their model. Zhou et al. [8] investigated re- routing model for urban emergency logistics based on travel
source distribution in post-disaster by presenting a multi- time reliability in a stochastic network. In this study, road
objective mathematical model. They considered roadway travel time was assumed to be strongly influenced by urban
availability in a multiperiod dynamic emergency resource- storm flooding disasters. To solve the model, a hybrid
scheduling problem. Tikani and Setak [2] formulated a metaheuristic that integrated Tabu Search and ant colony
reliable time-dependent vehicle routing problem with hard optimization was designed. It is worth mentioning that their
time windows in a multigraph and developed metaheuristics model aims to find the best alternative path with time-in-
to minimize delays in transferring essential goods in a dependent travel times from a warehouse to only one di-
disaster. saster point considering that a vehicle can provide rescue
 services to only one affected area.

2.2. Related Works on Uncertainty in Post-Disaster.
Disasters are generally characterized by a high level of 2.3. Vehicle Routing and Scheduling Problem with Semisoft
uncertainty. Various parameters such as time and demands Time Windows. In resource distribution in post-disaster, it
are hard to predict; hence, decisions should be taken in an is momentous to optimize the delivery plans to improve the
uncertain environment. Two-stage stochastic programming time of emergency packages, reducing distribution costs and
is one of the most well-known modeling methods which increasing the packages safety of delivering process. Vehicle
supports decision-making under uncertainty. Bozorgi- routing problem with semisoft time windows is an extension
Amiri et al. [9] proposed a multiobjective robust stochastic of vehicle routing problem, including the vehicle routing
model for relief logistic under uncertainty. They took de- problem with hard and soft time windows. In vehicle routing
mand, purchase, supply, and transportation costs into ac- problem with soft time windows, maximum and minimum
count as uncertain parameters. They developed their model limits of time window are possible to be violated at a penalty.
based on two stages. In the first stage, the distribution center A problem that only takes penalties on late arrival into
locations and required inventory of any relief goods under account is named the vehicle routing and scheduling
storage were determined. In the second stage, the level of problem with semisoft time windows [15].
items delivered from relief centers to disaster regions was Qureshi et al. [15, 16] proposed a novel column gen-
specified. The proposed model was in accord with the as- eration according to the exact approach for the scheduling
sumption that disaster information is not dependent on and vehicle routing problem with semisoft time windows. In
routing the vehicles and time. Bozorgi-Amiri and Khorsi their study, an upper bound on the lateness time window
[10] developed a multiobjective dynamic location-routing deviation was considered. The proposed solution algorithm
model for midplanning and short-term regarding relief is proved to be effective in solving medium-sized test
under uncertainty. Travel, cost, time, and demand were problems. Tas et al. [17] formulated a vehicle routing
considered as uncertain parameters. The aims of their model problem with stochastic travel times and soft time windows.
were minimization of the maximum shortage among the They considered service and transportation costs in their
disaster regions in all periods, total cost, and travel time. The model. A Tabu Search algorithm was used as a solution
4 Journal of Advanced Transportation

method. Beheshti and Hejazi [18] presented a mathematical (ii) Due to the uncertainty of vehicles’ speeds aftermath
model for the vehicle routing problem with general soft time of a disaster, it is possible that the emergency
window. To solve the model, a hybrid column generation- packages do not deliver to the victims and wounded
metaheuristic algorithm was proposed. Bhusiri et al. [19] people after a desirable time. To handle this issue,
studied the vehicle routing problem with soft time windows. we partially relaxed the time window and penalized
They applied the branch-and-price method which led to a set a time-dependent late arrival cost. In detail, the
partitioning master problem and its new subproblem. They semisoft time window is incorporated to allow and
presented the new methods to solve the subproblem. also control the delays in servicing demand nodes.
 (iii) The problem is studied under multiple objectives.
2.4. Vehicle Routing Problem in Multigraph Networks. The first objective minimizes the total trans-
Prior studies in the vehicle routing problem assume that portation costs including operating costs and late
only one edge exists among two sequential nodes. Owing to arrival penalties, while the second one maximizes
the intricacy of urban environments, it is likely to exist the reliability of constructed routes.
more than one route among two nodes. Neglecting the (iv) Due to the nonlinearity and NP-hardness of the
available parallel arcs in the transportation network in such problem, it is computationally difficult to solve the
problems may adversely affect the quality of obtained model. For this purpose, we present a modified
solutions. Hence, this concept is important to be taken into multiobjective metaheuristic based on NSGA-II to
account by decision makers. A few works in the literature tackle the problem. We compare the performance of
considered multigraph network in vehicle routing problem. modified NSGA-II with the standard NSGA-II to
Garaix et al. [20] focused on the routing problem with the prove the efficiency of the developed approach.
existence of alternative paths through a multigraph setting.
Lai et al. [21] developed the heterogeneous vehicle routing 3. Problem Description and Modeling
model in a multigraph network. Alternative arcs con-
necting customers were characterized by various features Distribution of emergency relief after the occurrence of a
(cost and time). Ticha et al. [22] for solving the vehicle disaster has a significant impact on reducing casualties. Due
routing problem with time windows in single and multi- to the uncertain situations that occur in such a complex
graph networks presented two branch-and-price algo- situation, we focus on the stochastic version of the problem
rithms. However, only two studies focused on emergency to achieve reliable and prompt distribution of urgent
logistics planning in a multigraph network including commodities in inner-city areas. The proposed SR-
Tikani and Setak [2] and Setak et al. [23]. Setak et al. [23] TDRRPM-STW model is developed based on a time-de-
modeled a time-dependent vehicle routing problem in a pendent vehicle routing problem and presented in a special
multigraph-based network for emergency logistics opera- transportation network named multigraph network MG �
tions in the natural disaster occurrences. Also, they con- (V, E) where the set of vertexes V includes one central depot
sidered FIFO property in their model and concentrated on (DC) along with a set of demand nodes N � {1, . . . , n}.
the minimization of total number of vehicles and waiting Moreover, the available connections between the nodes are
time. Tikani and Setak [2] investigated the availability of presented by E � (i, j, m): i, j ∈ ], i ≠ j which shows the
parallel links between nodes considering multiple attri- link between nodes i and j. Each link has two attributes
butes including different reliabilities and travel times. They including different traffic patterns and reliability. In the
proposed a nonlinear mathematical model which mini- following, we discuss the properties of SR-TDRR PM-STW.
mized the total weighted completion time where the reli-
ability of routes was controlled to be more than a
 3.1. FIFO (First-In, First-Out) Property Satisfaction. The
predetermined threshold value. Two other works which
 nonpassing or the first-in, first-out (FIFO) property guar-
focused on routing application in multigraphs are Tikani
 antees that between two identical vehicles A and B, if vehicle
and Setak [24] and Tikani and Setak [25].
 A begins to traverse the arc (i, j) earlier, then it arrives at its
 In the current study, we extend the model of Tikani and
 destination j before vehicle B. Primitive works on time-
Setak [2] from several aspects and study a stochastic reliable
 dependent vehicle routing problem did not satisfy FIFO
time-dependent relief routing problem in multigraphs with
 property [26]. In fact, they utilized a discrete function of
semisoft time windows (abbreviated by SR-TDRRPM-
 time to model the travel times. An example of their approach
SSTW) for early post-disaster operations. The main con-
 is illustrated in Figure 2 [26]. As it can be seen from the
tributions of the current study are as follows:
 figure if a vehicle departs the origin at 4 : 30, it will arrive at
 (i) This is the first study that investigates the avail- its destination in 150 miles away at 9 : 30. Nonetheless, if a
 ability of alternative paths in urban emergency vehicle departs at 6 : 00, it will arrive to its destination at 9 :
 logistics under uncertain conditions. To do this, we 00. It is clear that this situation is not feasible in the real
 applied two-stage stochastic programming where word and the result does not conform the FIFO property.
 the demands of affected areas, reliability of links, Recently, scholars employ continuous travel time
 traffic congestions, and service time duration are functions over the time horizon. In this paper, we employed
 considered as a finite number of possible the approach presented by Setak et al. [27] to convert a travel
 realizations. speed function of Ichoua et al. [26] to a continuous travel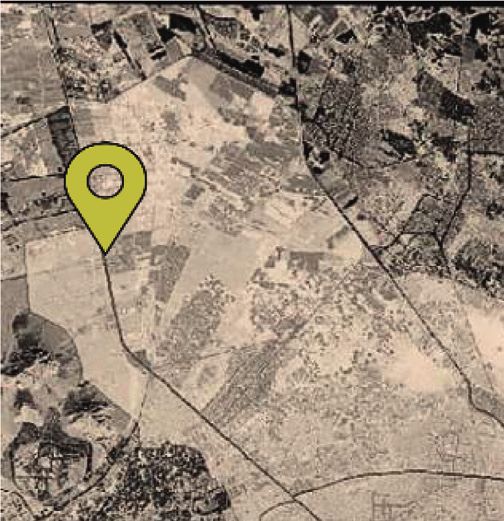
Journal of Advanced Transportation 5

 70 7
 Departure time → 6:00
 60 Arrival time → 9:00 6
 Travel Speeds (mph)

 50 5

 Travel Time
 40 4

 30 3

 20 Departure time → 4:30 2
 Arrival time → 9:30

 10 1

 1 2 3 4 5 6 7 8 1 2 3 4 5 7
 Time interval (hours) Time interval (hours)

Figure 2: An example of ‘‘passing” with discrete travel time Figure 3: Travel time function corresponds to travel speed function
function. in Figure 2.

 achieve new time intervals. In this equation, vuijmij represents
time function. An example of this approach is provided in the travel speed at the mth link (i, j) in uth time interval. In
Figure 3. In this method, a vector U is defined as initial the following, the number of time intervals in travel time
distinct intervals for the mth arc between two nodes i and j. function (H) is calculated by H � 2(U − 1) + 1 where U
Therefore, at first, T can be represented by shows the number of time intervals in the function of time
T � [T1, T2, . . . , TUm ]. Aftermath, new time intervals must speed. Finally, two coefficients a and b are calculated
 ij
be calculated for all links with various traffic congestions. according to equations (5) and (6).
According to Setak et al. [27], equation (1) is employed to

 ⎡⎢⎣ dijm
 Tnewijm � Tnew1ijm , Tnew2ijm , Tnew3ijm , . . . , TnewH−1 H
 ijm , Tnewijm � T1 , T2 − T1 − , . . . , TUm − TUm −1 −, TUm ⎤⎥⎦. (1)
 v1ijm

 If Tnewhijm < Tnewh−1 h h−1
 ijm , then Tnewijm � Tnewijm . In addition,

 ⎢ dijm dijm dijm ⎤⎥
 xijm � ⎡
 ⎣ 1 , 2 ,..., U
 ⎦, (2)
 vijm vijm vijm

 yijm � xijm(1) , xijm(1) , xijm(2) , xijm(2) . . . , xijm(U) , (3)

 yijm(2)− yijm(1) yijm(3)− yijm(2) yijm(Hm )−yijm(Hm −1)
 ⎢
 bijm � ⎡
 ⎣ , ,..., ⎤⎥⎦, (4)
 Tnewijm(2) − Tnewijm(1) Tnewijm(3) − Tnewijm(2) Tnewijm(Hm ) − Tnewijm(Hm –1)

 aijm � yijm(1) − bijm × Tnewijm(1) , . . . , yijm(hm ) − bijm × Tnewijm(Hm ) . (5)

 Henceforth, we can calculate the travel time at the mth 3.2. Reliability of Distribution. In the proposed problem, a
edge among nodes i and j by the following formula: discrete function with a finite set of independent scenarios is
 considered to formulate the reliability of each route. In this
 t � ahijm + bhijm × t0 , (6) regard, the reliability of mth arc between vertexes i and j in
 scenario ω is considered as successful transportation
where t0 is the vehicle departure time from node i to node j through mth arc between two successive nodes i and j
throughout time interval [Tnewhijm , Tnewh+1
 ijm ].
 presented by rijm (ω). In other words, the reliability is
6 Journal of Advanced Transportation addressed as the probability for vehicles to traverse the ∞ Penalty cost connections between two demand nodes in time aftermath of a disaster. Evidently, after the occurrence of disasters, evaluating the status of links (including reliability and traffic C congestions) is more complicated due to the dynamic sit- Time uation. However, according to literatures [2, 4], the values of TWαi (ω) TWβi (ω) reliability and related traffic congestions on links can be estimated based on subjective perceptions instead of ob- Figure 4: Cost function for delayed services. served data. Thereupon, the reliability of kth route performed by vehicle k in scenario ω can be computed by knowing the reliability of each employed link as follows: (v) The reliability of links, distance, and time-depen- reliabilityroute(k) � rijm (ω). dent traffic congestions can be estimated by (i,j,m)∈E| xhk (7) transportation research community’s expertise or ijm (ω) h∈Hm using advanced disaster detection technology in real-time (vi) The quantities of delivery items demanded by 3.3. Semisoft Time Window. Using a semisoft time window, a shelters for each scenario are known demand node is permitted to be served after the defined time (vii) The SR-TDRRPM-SSTW only considers the af- window (TW) by considering a penalty for the delayed fected areas that are accessible by vehicles in inner- arrival time [28]. These penalties can also be assumed to vary city areas from one affected area to another based on their priorities. To deal with the uncertainty of the parameters in SR- Figure 4 shows the nondecreasing time-dependent arrival TDRRPM-SSTW, it is modeled by two-stage stochastic penalty in SR-TDRRPM-SSTW. formulation. To do this, a scenario tree including a set of Consider that the service completion time at the demand independent scenarios is considered to estimate the sto- i is tki (ω). Moreover, C represents the unit penalty cost for chastic demands, reliability of links, service duration time, the late arrival. The cost inducing from delayed service at and travel speeds. The decision variables can be segmented node i in scenario ω is formulated as a function of tki (ω) into two groups consisting scenario-independent vari- using the following: ables (xkij ) which are known as first-stage decisions and scenario-dependent variables [xhk k ijm (ω), ti (ω)] which are ⎪ ⎧ ⎪ 0, if tki (ω) ≤ TWαi , known as second-stage decisions. The second-stage de- ⎪ ⎪ ⎨ β cisions are influenced by the uncertain parameters and penalty cost � ⎪ C. tki (ω) − TWαi , if TWαi ≤ tki (ω) ≤ TWi , ⎪ ⎪ made after realization of the first-stage actions [29]. The ⎪ ⎩ β ∞, if TWi ≤ tki (ω) . first-stage problem is a capacitated vehicle routing (8) problem where the objectives attempt to minimize the expected operational costs and late arrival penalties by equation (9) as well as maximize the expected reliability of 4. Mathematical Formulation constructed links related to the second-stage subproblems P2 with equation (10). The purpose of the proposed SR-TDRRPM-SSTW is to Using the notations presented in Notation and Defini- maximize the reliability of distribution together with min- tions, the mathematic formulation of stage one (P1) and imizing the sum of service completion times in delivering stage two (P2) of SR-TDRRPM-SSTW can be modeled as prioritized items considering the late arrival penalties in the follows. post-disaster situation under uncertainty. In the proposed problem, the following assumptions are considered: 4.1. First Stage (P1) (i) Vehicles are assumed to be homogenous, depart from the distribution center in the first horizon, Objective 1: Eξ [h(x, ξ)], (9) and finally go back to it once the distribution is finished Objective 2: Eξ [g(x, ξ)]. (10) (ii) The locations of affected nodes and candidate central depot are known prior Constrains are as follows: (iii) The probability of successful transportations be- tween vertexes is also estimated for each of the xkij � 1, ∀j ∈ N, (11) scenarios in advance i∈(0 ∪ N),i ≠ j k∈K (iv) The problem is studied in multigraph setting where the alternative links are differentiated by two xkij � 1, ∀i ∈ N, (12) attributes j∈(n+1 ∪ N),i ≠ j k∈K
Journal of Advanced Transportation 7
xkij � xkji , ∀j ∈ N, ∀k ∈ K, (13) θki (ω) ≥ 0, ∀i ∈ N⋃P , ∀k ∈ K. (29)
i∈(0 ∪ N) i∈(n+1 ∪ N)
Constraint (21) is employed to restrict the vehicle k to
xk0j ≤ |K|, select only one path between two nodes i and j. Constraints
(14)
j∈(0⋃ N) k∈K (22)–(23) compute the service completion time at each
demand node in each scenario. Constraint (24) imposes that
xkii � 0, ∀i ∈ (N ∪ P), ∀k ∈ K, (15) the maximum service completion time should be less than
β
TWi . Moreover, constraint (25) computes the allowable late
xki0 � 0, ∀i ∈ (N ∪ P), ∀k ∈ K, (16) arrival time at each node. Constraint (26) controls the ca-
pacity of vehicles along each constructed route. Constraints
(27)–(29) define the type of variables.
xk(n+1)j � 0, ∀j ∈ N, ∀k ∈ K, (17)
5. Solution Methodology: Modified NSGA-II
xkij � {0, 1}, ∀i, j ∈ (N ∪ P), ∀k ∈ K. (18)
The NSGA-II is a popular multiobjective evolutionary al-
Constraints (11)–(13) define the flow on the path of gorithm which was first offered by Deb et al. [30]. It provides
vehicle k. Constraint (14) limits the total number of available an approximation of the nondominated Pareto front by
vehicles. Constraints (15)–(18) guarantee the accuracy of using the successive computation of a series of generations of
achieved solutions. Next, for each scenario ω ∈ Ω, P2 can be solutions. In each iteration, this algorithm generates new
written as follows. populations by employing crossover and mutation opera-
tors. Afterward, members of the current and new genera-
tions are mixed together. Finally, population members are
4.2. Second Stage (P2) ranked according to the crowding distance and non-
dominance concepts to select best solutions. Solutions which
h(x, ξ(ω)) � Min C1 tkn+1 (ω) + C2 θki (ω), lie above the Pareto front are nonoptimal solutions; how-
k∈K i∈(0⋃ N) k∈K ever, solutions that lie under the Pareto front are infeasible.
All solutions on the Pareto front are optimal by considering
(19) a specified objective weight preference. Herein, first, the
solution representation is presented and then the procedures
g(x, ξ(ω)) � Max rijm (ω), ∀k ∈ K, of the operators are briefly described.
(i,j,m)∈E| xhk
ijm (ω)
h∈Hm
(20) 5.1. Solution Representation. Solution scheme in the mod-
ified NSGA-II method is designated to specify the assign-
xhk k
ijm (ω) � xij , ∀i, j ∈ N, ∀k ∈ K, ment of demand points to various routes and determine the
i∈(0⋃ N),i ≠ j m∈Mij h∈Hm order of vertexes for each vehicle. Herein, we applied a
continuous representation form (CRF) as a [S × (N + K −
(21) 1)] dimension matrix which includes numbers in the interval
[0, 1]. In order to obtain the sequence of vertexes, the
tkj (ω) − tki (ω) ≥ ahijm (ω) + bhijm (ω)tki (ω) + sj (ω) + xhk
ijm (ω) − 1 E, numbers in the first row of CRF are sorted decently; then, the
(22) nodes’ sequences can be achieved by comparing the location
of each number in the initial CRF and in the sorted version.
tki (ω) ≤ E. xkij , ∀i ∈ N, ∀k ∈ K, Next, the m link between two sequential nodes is selected if
(23) the value of gene be in the interval of
j∈(N⋃ n+1)
((m − 1)/|Mij |) ≤ value < (m/|Mij |). Figure 5 illustrates a
β sample of the decoding method for SR-TDRRPM-SSTW
tki (ω) − si (ω) ≤ TWi , ∀i ∈ N, ∀k ∈ K, (24)
with 6 vertexes and 2 vehicles in two scenarios with multiple
arcs between points.
tki (ω) − si (ω) − TWαi ≤ θki (ω), ∀i ∈ N, ∀k ∈ K, (25)
xhk
5.2. Crossover Operator. Crossover is one of the funda-
Di (ω) ijm (ω) ≤ Q, ∀k ∈ K,
(26)
i∈N
j∈(N⋃ n+1) m∈Mij h∈Hm
mental operators in the genetic algorithm which is also
referred to as recombination. It is used to explore new
solution space. This operator employs two distinct chro-
xhk
ijm (ω) � {0, 1}, ∀i, j ∈ N⋃P , ∀m ∈ Mij , ∀h ∈ Hm , ∀k ∈ K, mosomes as parents to generate new offspring. The obtained
(27) offspring inherit the characteristics of their parents with a
certain method. There exist various methods to combine two
given parents. In this study, we applied two-point crossover
tki (ω) ≥ 0, ∀i ∈ N⋃P , ∀k ∈ K, (28) to generate new individuals. In this approach, we select two
8 Journal of Advanced Transportation

 Chromosome structure

 Sequence of nodes 0.19 0.56 0.61 0.84 0.09 0.12 0.39
 Sequence of arcs
 0.37 0.44 0.60 0.29 0.78 0.37 0.25
 in scenario #1
 Sequence of arcs
 in scenario #2 0.51 0.31 0.74 0.92 0.08 0.08 0.30

 Decoding process (1,2) (1,2)
 (1,1) 4 5

 4 3 2 7 1 6 5
 3 Route. 1 D Route. 2 6
 1 1 2 1 2 1 1
 2 1 2 2 1 1 2 (1,2)

 2 (2,1)
 1
 (2,2) (1,1)
 Route. 1 Route. 2
 Virtual Depot Employed arcs Employed arcs
 in scenario #1 in scenario #2
 Figure 5: Solution representation and decoding process.

points on the parent chromosome strings. Then, genes practical strategy is used called Least Recently Used (LRU)
between these two points are swapped between the parent employing a hash-queue data structure [33]. Specifically, the
structures. An example process of crossover operator is fitness function of all chromosomes is gathered in a cache
provided in Figure 6. table, then, in case of subsequent iteration of a solution, the
 corresponding objective value is rapidly retrieved.

5.3. Mutation Operators. Mutation operator is mainly re-
sponsible for maintaining diversity in the population. 5.6. Parameters Tuning. The Taguchi method is an efficient
Mutation is conducted via altering a randomly selected gene. method for determining parameters of a metaheuristic al-
Here, we used four mutation operators which are defined as gorithm. This method uses the signal to noise (S/N) ratio to
follows: find the best level of each parameter. Table 1 reports the
 input parameters of the proposed algorithm and their levels.
 Two-point swap: this operator selects two alleles of the Figure 7 demonstrates the obtained S/N ratio corresponding
 chromosome randomly. Then, for creating one new to each defined parameter. In order to implement the
 chromosome, two selected alleles will be swapped. Taguchi method, the Spacing Metric (SM) is considered as a
 Insertion: it moves a randomly selected gene (allele) to measure for evaluating the optimal results [34]. The SM
 another randomly selected place. factor is achieved by equation SM � ( n−1i�1 |d − di |)/(n − 1)d
 Reversion: this operator reverses two randomly se- where n is total number of solutions in the final Pareto front,
 lected-point cuts. di represents the Euclidian distance between every succes-
 Arc exchange: in this operator, the links without sive Pareto solutions, and the average of all di is denoted by
 changing the sequence of nodes will be randomly d. Higher values in Figure 7 represent the more appropriate
 exchanged. levels for intended parameters.

 6. Computational Results
5.4. Migration Operator. We also applied another operator
called immigration. As it occurs in many societies, some 6.1. An Illustrative Example. In this section, we provide a
foreign individuals with various genetic characteristics are small-sized sample in a deterministic situation to illustrate
added to the current population periodically. Immigration that how the model proposes a distribution plan considering
operator is performed to escape local optima by exploring different traffic conditions and reliabilities of links. This
new solution space. To do this, a part of poor individuals at instance contains one distribution center and seven bene-
each generation is replaced with some new randomly created ficiary regions. Table 2 gives the gives the demands of each
immigrants [31]. region. Moreover, the related weights are calculated by
 wi � (Dij /Dj ) × 10. For all of nodes, the time window and
 service time are set to 15 and 1, respectively. One vehicle
5.5. Caching Mechanism. Kratica et al. [32] employed the with capacity 400 is utilized to transship emergency supplies
caching method in the genetic algorithm (GA) for the first from the depot to various destinations. As depicted in
time. This technique improves the algorithm’s running time Figure 8(a), the locations of DC and demand nodes are
through storing a certain number of already measured fit- dispersed in a two-dimensional space and the distances are
ness functions in a cache table. In this study, for caching, a corresponding to the Euclidean distance between locations.
Journal of Advanced Transportation 9

 Parent 1 Parent 2
 0.41 0.71 0.60 0.85 0.17 0.10 0.23 0.41 0.71 0.36 0.32 0.89 0.10 0.23

 0.39 0.81 0.26 0.37 0.28 0.74 0.55 0.39 0.81 0.53 0.28 0.39 0.74 0.55

 0.29 0.41 0.36 0.32 0.89 0.71 0.03 0.29 0.41 0.60 0.85 0.17 0.71 0.03

 0.61 0.11 0.53 0.28 0.39 0.13 0.66 0.61 0.11 0.26 0.37 0.28 0.13 0.66

 Offspring 1 Offspring 2

 Figure 6: Example of crossover operator.

 Table 1: Parameters and their level in GA.
Parameter A: crossover percentage B: mutation percentage C: immigration percentage D: NPOP E: MaxIt
Level #1 0.60 0.05 0.05 60 75
Level #2 0.65 0.10 0.10 80 90
Level #3 0.70 0.15 0.15 100 100
NPOP: number of population; MaxIt: maximum number of iterations.

 Main Effects Plot for SN ratios
 Data Means
 A B C D E
 11

 10
 Mean of SN ratios

 9

 8

 7

 6

 5
 1 2 3 1 2 3 1 2 3 1 2 3 1 2 3
 Figure 7: S/N ratio plots for the modified NSGA-II.

 Table 2: The data of the small-scale instance. second and third scenarios, we encounter medium- and low-
Number (i) 1 2 3 4 5 6 7 traffic congestions with higher traveling speeds. The speed
Di 50 80 60 40 70 45 55 patterns under various scenarios are shown in Figure 9 by
wi 1.25 2 1.5 1 1.75 1.125 1.375 different colors where dotted arcs depict less reliable con-
 nections. Figure 8(b) shows one of the routing schemes with
 reliability � 0.9025.
The reliability of the connections between different points is
categorized to three cases. Furthermore, within the planning
horizon, four numbers of time intervals are taken into 6.2. Computational Experiments. Here, a numerical analysis
consideration for every passable links. The time intervals are is performed to investigate the performance of the modified
[0, 3], [3, 6], [6, 9], and more than 9. The upper limit of the metaheuristic. In this regard, we utilized the test instances
last period (the fourth time interval) is assumed to be a large prepared by Tikani and Setak [2] with some adaptations.
number to guaranty that the vehicle’s travel time is finished Same as Tikani and Setak [2], two alternative links between
in the last interval. We assume three different scenarios for all vertexes are considered in a multigraph setting. In this
traffic congestions. In the first scenario, the traffic is high, study, we consider two scenarios with the respective
and most of the times, the speeds are low. While in the probabilities of 60% and 40%. The reliability of links, service
10 Journal of Advanced Transportation

 90 5 t5 = 5.8565

 80 2
 3
 70
 t2 = 3.7756
 60 t3 = 7.5776

 50
 Arrival Time
 4 6
 40 t4 = 9.0816
 t6 = 1.6675
 30
 7
 20 1
 Optimum Route
 10 t1 = 11.2293
 10 20 30 40 50 60 70 80 90 t7 = 12.3627

 :r = 0.90 High traffic Objective 1 = 71.1594
 :r = 0.95 Medium traffic Objective 2 = 0.9025
 :r = 1 Low traffic
 (a) (b)
 Figure 8: (a) Sample multigraph network; (b) optimum solution.

 25 35
 30
 20
 25
 Speed (km/h)
 Speed (km/h)

 15 20

 10 15
 10
 5
 5
 0 0
 Departure time Departure time
 (a) (b)

 50

 40
 Speed (km/h)

 30

 20

 10

 0
 Departure time
 (c)

Figure 9: (a) Speed changes for the first scenario-high traffic; (b) speed changes for the second scenario-medium traffic; (c) speed changes
for the third scenario-low traffic.

time duration, and demands of the affected areas in the first same as the upper bound of Tikani and Setak [2] and
 β
scenario are in accordance with Tikani and Setak [2], and the TWαi � 0.8 × TWi . Moreover, C1 � 10 and C2 � 2.
parameters in the second scenario are also generated by the To measure the effectiveness of the proposed NSGA-II,
same distribution. We assume that the second scenario has a the performance of this algorithm is evaluated with standard
lower traffic condition in comparison to the first one. To this NSGA-II through five metrics. Table 3 summarizes the
end, the speeds are generated in the interval [20, 35]. performance measurements and their definitions. As
Moreover, the threshold in the semisoft TW is defined as mentioned in Table 3, the higher values of QM indicate the
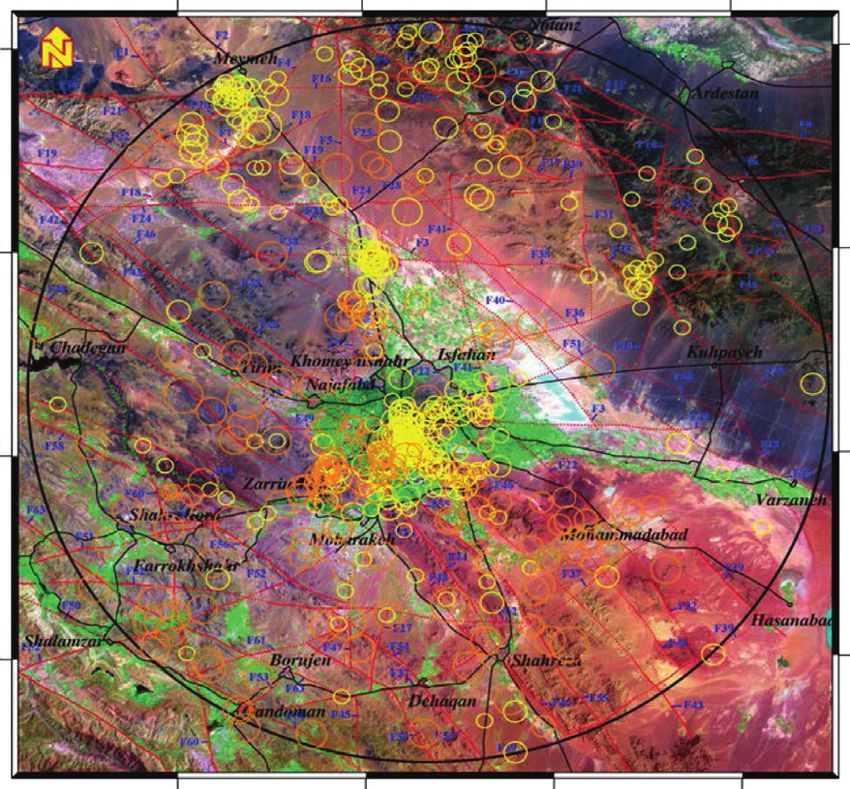
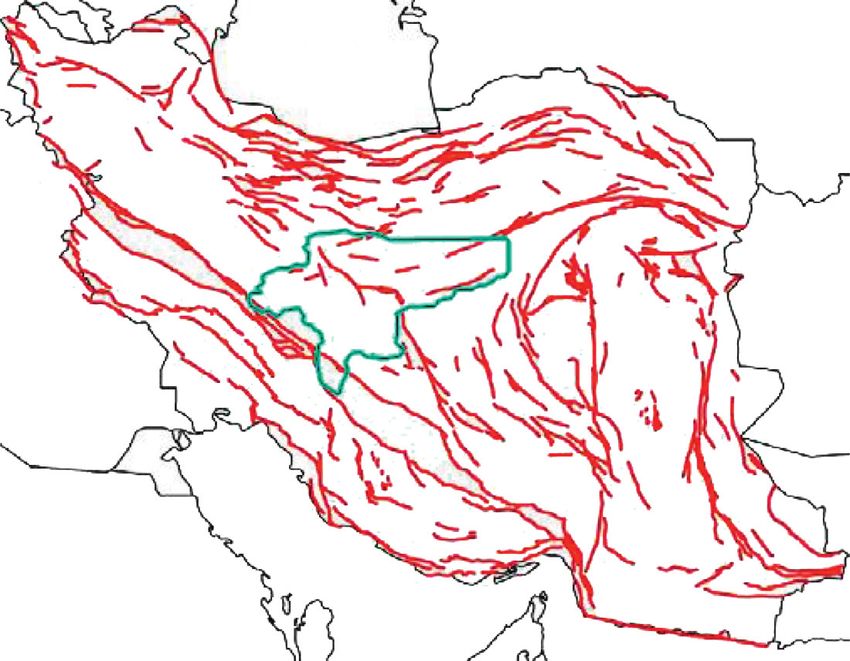
Journal of Advanced Transportation 11

supremacy of the proposed algorithm as well as the lower shown in Figure 11(a). According to geographical research
values of SM, MID, and computation time [35]. Table 4 in a 100-kilometer radius of Isfahan city, 63 faults were
shows the comparison results of the described metrics. found nearby this city; some of these faults were hundreds of
Moreover, Figure 10 visualizes the box plots of the per- kilometers in length [36]. The fault density map and
formance measures. According to the obtained results, earthquakes detected in the mentioned region in 2000–2003
modified NSGA-II shows the better performance compared are displayed in Figure 11(b).
with NSGA-II in all defined metrics. In this study, as illustrated in Figure 12, the underlying
 transportation network comprises 6 shelters and one dis-
 tribution center. The distribution center is situated in
6.3. Statistical Analysis. In order to present a more precise Bakhtiar-Dasht, and also the shelters are in Isfahan’s dis-
comparison, we performed a statistical analysis using the parate areas. To deliver emergency packages from the depot
paired t-test for each of the metrics. The null hypothesis of to the different shelters, three similar vehicles with a capacity
the test assumes that the difference between the proposed of 2000 exist. Required information regarding the problem is
NSGA-II and standard NSGA-II for each specific metric is provided in Table 7. The shelters’ demands are assessed
insignificant, while the alternative hypothesis states that the according to the polls provided by area’s crisis management
proposed NSGA-II yields better overall outcomes than the experts. Times of service and priorities are set based on the
standard NSGA-II regarding the studied performance nodes’ demands in accordance with two formulations
metrics. Si (1) � 1.5h + 0.05 × ω Di (ω)/2 and Si (2) � 2h+ 0.05 × ω
 Herein, at first, the Anderson–Darling test is utilized to Di (ω)/2 and wi � 10 × ( ω Di (ω)/2 × ω j Dj (ω)), re-
check the normality of all metrics, which shows the normal spectively. In order to study the case study in a larger scale,
distribution of applied metrics’ values. The results of the we added fourteen potential shelter locations by consulta-
applied paired t-test are reported in Table 5, and it shows tion with experts (including some existing stadiums, schools,
that in all tests, null hypothesis is not accepted at confi- and college locations in Isfahan), and their related demands
dence level 0.95. The statistical analysis confirms the su- are estimated on the interval of [500, 900]. Other required
periority of the modified NSGA-II compared with its parameters are also computed based on the abovementioned
standard version. formulations.
 The reliability of links between nodes and the speed
6.4. Significance of considering Nondominated Alternative pattern in the disaster aftermath are set in accord with de-
Links. In order to evaluate the importance of using mul- liberation with specialists in crisis management and civil
tigraph setting in the SR-TDRRPM-SSTW, in this section, architecture fields. We classified the region based on three
we discard the availability of multiple paths between nodes. traffic zones of heavy, medium, and light to determine the
To this end, we randomly remove one of the parallel links traffic pattern, which are shown in Figure 12. This classifi-
among the vertexes. Then, the problems are resolved in the cation is performed based on existing transportation statistics
achieved single graph. The best obtained value regarding of Isfahan. For each category of traffic, Figure 13 depicts the
each objective function is described in Table 6. As we ex- speed patterns for four time intervals [0, 3], [3, 6], [6, 9], and
pected, considering nondominated extra edges between more than 9. It is notable that in some cases a route from one
nodes can substantially improve the quality of solutions. The node to another one may include various traffic regions. In
mean of average achievements for four instances is relatively this situation, it is required that some breakpoints be specified
10.4% in which improvements are calculated by the in the indicated route where the vehicles enter to another
following: traffic area. Hence, by considering these breakpoints, travel
 times are calculated using the method of Section 3.1.
 OBJM − OBJS
 improvement(%) � 100 × , (30) Owing to the urban networks’ structure, it is evident that
 OBJS the distances among nodes are not symmetric. In this regard,
where OBJM is the objective of multigraph and OBJS is the two alternative links employed between each pair of nodes
objective of simple graph network. are obtained from Google Maps. We report the details of
 links’ distances and their reliabilities between the main
 shelter locations in Table 8. For the rest of the demand
6.5. A Real Transportation Network. Iran experiences a va- points, detailed information is not presented for the sake of
riety of different natural disasters on a frequent basis. This brevity.
country is located in a very active seismic zone, called Alpide We solved the proposed model once for a logistics
belt. During the past decades, several major and numerous network which includes only the main shelter locations
minor earthquakes have occurred in this country. Generally, (Case I) and once for a logistics network considering both
in Iran, earthquakes with more than two Richter can result in main and potential shelter locations (Case II). By solving the
huge social and economic losses as well as casualties [12]. In proposed model, a series of solutions as a Pareto front are
this research, to demonstrate the feasibility of the logistics achieved. In Figures 14 and 15, we depicted the obtained
model, we studied a possible earthquake in the real-world results for Case I and Case II, respectively. As can be seen
network of Isfahan. The province of Isfahan is one of the from the figures, increasing the reliability of routes yields to
most historical and industrial regions of Iran. Location of increase the first objective function. It accentuates the
Isfahan on the map and the major active faults of Iran are conflict of objectives. Herein, a decision maker should select
12 Journal of Advanced Transportation

 Table 3: Definition of performance metrics.
Measure Definition Criterion∗ Formula
 Indicates the
 number of
NOS achieved L —
 solution in the
 Pareto front
 Shows that
 whether the
Spacing achieved
metric solutions in the S SM � ( n−1i�1 |d − di |)/(n − 1)d
(SM) Pareto front are
 distributed
 evenly
 Presents the
 mean distance
Mean
 among the ������������������������������������������������������������
ideal
 solutions of S MI D � ni�1 ((F1i − F1best )/(F1max min 2 max min 2
 Total − F1Total )) + ((F2i − F2best )/(F2Total − F2Total )) /m
distance
 Pareto set from
(MID)
 the ideal
 solution
 Presents the
 contribution of
Quality
 the algorithm
metric L QM � (number of non_dominated solutions of the method)/total number of non_dominated solutions
 regarding to all
(QM)
 nondominated
 solutions
Solving
time Running time
 S —
(CPU of the algorithm
time)
S: smaller value is better; L: larger value is better.

 Table 4: Comparison metrics for different size instances.
 Modified NSGA-II Standard NSGA-II
Problem no.
 NOS SM MID QM CPU time (s) NOS SM MID QM CPU time (s)
1 4 0.128 0.506 1 54.20 2 0.102 0.545 0.50 67.23
2 5 0.360 0.449 0.71 56.32 4 0.331 0.651 0.50 69.17
3 5 0.390 0.445 1 60.41 3 0.958 0.466 0.60 73.52
4 4 0.096 0.368 1 64.17 3 0.172 0.469 0.75 77.16
5 6 0.294 0.435 0.85 66.58 3 0.518 0.687 0.11 79.54
6 5 0.059 0.320 0.62 72.18 5 0.237 0.633 0.37 80.69
7 6 0.048 0.290 1 75.39 4 0.198 0.591 0.66 86.02
8 6 0.270 0.125 1 76.09 3 0.610 0.353 0.50 89.16
9 7 0.136 0.226 0.87 77.39 4 0.748 0.509 0.25 90.03
10 6 0.068 0.432 0.75 80.11 5 0.405 0.631 0.50 87.51
11 8 0.473 0.265 0.80 84.06 5 0.462 0.446 0.60 97.62
12 8 0.466 0.326 1 85.84 6 0.711 0.508 0.63 100.4
13 9 0.114 0.195 0.81 87.11 5 0.459 0.359 0.45 103.9
14 8 0.310 0.355 0.88 89.77 5 0.536 0.205 0.11 106.7
15 10 0.151 0.209 0.76 92.01 7 0.504 0.244 0.38 111.6
16 9 0.256 0.249 0.81 96.21 6 0.425 0.302 0.54 113.4
17 11 0.337 0.274 0.91 96.99 8 0.297 0.397 0.41 115.0
18 10 0.164 0.321 0.83 98.19 7 0.414 0.313 0.58 117.8
19 11 0.220 0.298 0.78 100.1 8 0.602 0.426 0.50 119.3
20 12 0.153 0.360 1 104.9 9 0.442 0.349 0.58 122.7
21 11 0.327 0.301 0.84 106.3 11 0.526 0.397 0.53 124.6
22 13 0.556 0.325 0.76 108.1 10 0.442 0.401 0.47 125.0
23 16 0.288 0.194 0.94 110.0 11 0.899 0.273 0.52 127.6
24 15 0.380 0.220 0.83 114.3 12 0.564 0.258 0.61 129.0
25 16 0.288 0.362 1 117.9 13 0.442 0.359 0.69 130.8
Average 8.84 0.253 0.314 0.87 86.98 6.360 0.480 0.430 0.49 101.81
Journal of Advanced Transportation 13

 SM factor MID factor
 1
 0.9 0.7
 0.8 0.6
 0.7
 0.6 0.5
 0.5
 0.4
 0.4
 0.3 0.3
 0.2
 0.2
 0.1
 0 0.1
 (a) (b)
 QM factor CPU time (s)
 1.1 140
 1 130
 0.9
 120
 0.8
 0.7 110
 0.6 100
 0.5 90
 0.4
 80
 0.3
 70
 0.2
 0.1 60
 0 50
 (c) (d)

 Figure 10: Comparison metrics for the standard NSGA-II (red boxes) and the modified NSGA-II (green boxes).

 Table 5: The P values of the paired t-test for different metrics.
Metric’s name T value P value Test results
NOS 10.7 0 ×
SM −5.82 0 ×
MID −5.15 0 ×
QM 12.08 0 ×
CPU time −22.34 0 ×
×: null hypothesis is not accepted.

 Table 6: The best achieved values of each objective in multigraph network versus simple graph.
 Multigraph Simple graph
Problem no. Average of improvements
 OF 1 OF 2 OF 1 OF 2
4 167.1 0.92 184.2 0.80 12.14
10 190.3 0.84 206.8 0.76 9.25
16 218.0 0.75 234.6 0.68 8.68
22 287.9 0.74 324.3 0.66 11.66

one of the solutions in the Pareto front according to his Case II, the overall reliability (objective 2) of routes decreases
preference. By comparing Figures 14 and 15, it becomes and cost of traveling (objective 1) increases since a vehicle
clear that by increasing the number of demand points in should serve more demand nodes.
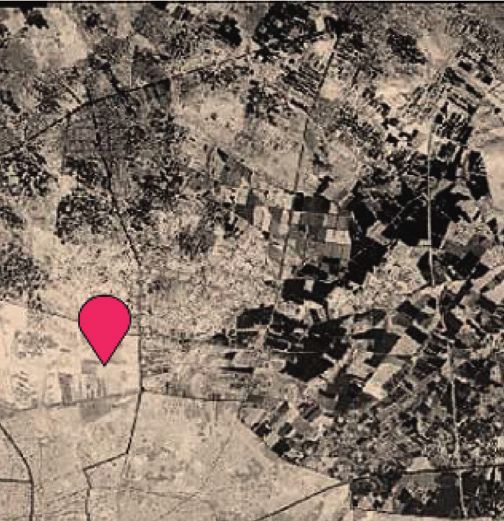
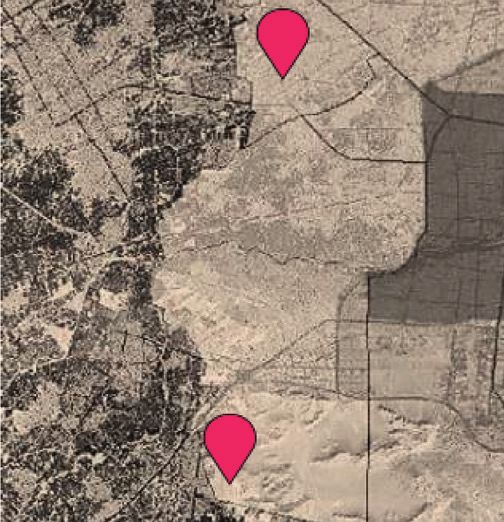
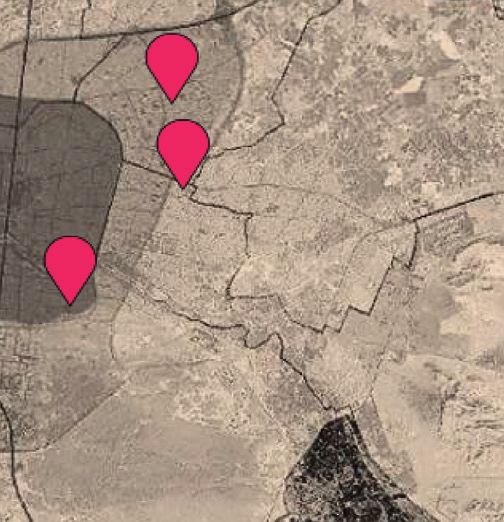
14 Journal of Advanced Transportation

 Turkmenistan E51′ E51′30º E52′ E52′30º

 N33′30º
 N33′30º
 Caspian Sea

 N33′
 N33′
 Iraq Isfahan

 N32′30º
 N32′30º
 N
 Pe
 rs

 N32′
 N32′
 ian
 Gu
 lf

 0 175 350 km
 Oman Sea
 E51′ E51′30º E52′ E52′30º
 Major Active Fault
 (a) (b)

Figure 11: (a) Major active faults and location of Isfahan in the map of Iran; (b) satellite image for fault density in 100 km radius of Isfahan
and detected earthquakes in 2000–2003.

 1

 Zone (c)
 5
 2
 5
 4
 e (a)
 Zon
 3

 Zone (b)
 6

 Depot/

 Shelter locations/
 Potential shelter locations
 Figure 12: Traffic zones with various traffic patterns and representation of the logistics network (Google Maps).
Journal of Advanced Transportation 15

 Table 7: Information regarding the main shelters in the network.
 Demands Service times (hour)
Shelters Locations Priorities
 Scenario 1 Scenario 2 Scenario 1 Scenario 2
1 Bagh-Fadak 1050 1250 2.0354 2.27 2.57
2 Pirouzi Stadium 700 1100 1.5929 2.15 2.45
3 Enghelab Stadium 660 840 1.3274 2.07 2.37
4 Ghadir Park 1000 1100 1.8584 2.22 2.52
5 Vaziche Stadium 750 850 1.4159 2.10 2.40
6 Abrisham 850 1150 1.7699 2.20 2.50

 70 70 70
 60 60 60
 50 50 50
 40 40 40
 30 30 30
 20 20 20
 0 2 4 6 8 0 2 4 6 8 0 2 4 6 8
 (a) (b) (c)

Figure 13: (a) Speed changes of the light traffic zone; (b) speed changes of the medium traffic zone; (c) speed changes of the heavy traffic
zone (continues line: first scenario; dash line: second scenario).

 Table 8: Details of distances (km) for two parallel links between main shelter locations in multigraph.
 Depot i1 i2 i3 i4 i5 i6
 20.1-1 22.8-1 23.7-1 25.7-1 16.2-1 29.6-0.95
Depot ×
 24.9-1 25.5-1 23.9-1 31.4-1 16.4-1 33.1-0.95
 23.3-1 11.4-1 20.7-0.95 14.3-1 20.1-1 30.1-0.95
i1 ×
 26.9-1 15.9-1 21.1-0.95 15.9-1 21.2-1 37.3-0.95
 26.0-1 12.4-1 7.90-0.95 3.2-1 19.2-1 29.2-0.95
i2 ×
 31.4-1 15.2-1 13.9-0.95 3.9-1 24.0-1 32.3-0.90
 24.8-0.95 19.5-0.95 9.0-0.95 6.7-0.95 14.0-0.95 15.2-1
i3 ×
 37.9-0.95 22.2-0.95 14.9-0.95 7.5-0.90 20.7-0.85 25.8-1
 25.7-1 16.3-1 2.6-1 7.8-0.95 25.1-1 24.4-0.95
i4 ×
 31.9-1 20.3-1 3.0-1 13.7-0.95 29.9-0.9 32.1-0.95
 17.0-1 18.6-1 20.0-1 13.5-0.90 25.8-1 17.2-0.90
i5 ×
 17.6-1 19.9-1 20.5-1 14.6-0.95 26.3-1 23.6-0.95
 17.3-0.90 30.1-0.95 25.9-0.95 16.3-1 23.6-0.95 18.8-0.90
i6 ×
 35.5-0.95 46.9-0.95 30.7-0.95 24.6-1 31.3-0.95 24.8-0.95

 60.5 172
 170
 58.5
 168

 56.5 166
 objective 1

 objective 1

 164
 54.5 162
 160
 52.5
 158
 50.5 156
 154
 48.5 152
 0.87 0.86 0.835 0.82 0.79 0.41 0.46 0.51 0.56 0.61 0.66
 Objective 2 Objective 2
Figure 14: Approximate Pareto optimal for the studied Case I. Figure 15: Approximate Pareto optimal for the studied Case II.
16 Journal of Advanced Transportation

7. Conclusion h: Indices to time intervals
In this study, we developed a novel multiobjective stochastic h ∈ 1, . . . , |Hm |
mathematic model for urban distribution of emergency m: Indices to links m ∈ 1, . . . , |Mij |
supplies named SR-TDRRPM-SSTW. The first objective Si: Service time for serving disaster area
strived to minimize the total operational costs and penalties i ∈ N; under scenario ω
of late arrivals while the second one attempted to maximize TWαi : The latest allowable service
the reliability of constructed routes. The arrival times at each completion time at demand node
demand node of the designated routing scheme were sup- without any penalty i ∈ N
 β
posed to adhere to semisoft time windows. Since the SR- TWi : The latest allowable service
TDRRPM-SSTW was studied in a multigraph setting, not completion time at demand node
only should it determine the sequence of serving affected i∈N
areas but also should decide about effective links between Variables
nodes. In this regard, in the first stage of the model, the xijk: 1 if the vehicle k moves from node i to node j by
vehicle routing decisions were performed, and based on vehicle k, 0 else
expected conditions, the decisions about suitable paths and xhkijm (ω): 1 if the vehicle k moves through mth link between
arrival times were made in the second stage with a finite two nodes i and j in the hth time interval, 0 else
number of defined scenarios. tki (ω): Departure time of vehicle k from node i
 To solve the problem, an improved version of NSGA-II θki (ω): The amount of late arrival time of vehicle k at
was proposed and employed. A comparison between the demand node i under scenario ω.
proposed NSGA-II and its standard version implied the
effectiveness of the proposed method in several aspects. The Data Availability
employed statistical tests demonstrated that the difference The data used to support the findings of this study are in-
between these two methods was statistically significant. In cluded within the article.
further analysis, we found that consideration of non-
dominated parallel links as a multigraph network can re- Conflicts of Interest
markably improve the solution of SR-TDRRPM-SSTW. The
extensions for future works can include investigating the The authors declare that they have no conflicts of interest.
multicommodity version of SR-TDRRPM-SSTW and con-
sidering the possibility of split deliveries. References
Notation and Definitions [1] D. Guha-Sapir, F. Vos, R. Below, and S. Ponserre, Annual
 Disaster Statistical Review 2011: The Numbers and Trends,
Sets and parameters Centre for Research on the Epidemiology of Disasters
 (CRED), Brussels, Belgium, 2012.
N � {1, . . . , n}: Set of disaster area [2] H. Tikani and M. Setak, “Efficient solution algorithms for a
Di (ω): Quantity of reliefs demanded by time-critical reliable transportation problem in multigraph
 disaster area i ∈ N under scenario ω networks with FIFO property,” Applied Soft Computing,
P � {0, n + 1}: Relief distribution center and its copy vol. 74, pp. 504–528, 2019.
E: A large number [3] H. Wang, L. Du, and S. Ma, “Multi-objective open location-
K � {1, . . . , |K|}: Set of vehicles routing model with split delivery for optimized relief distri-
Q: Capacity of each vehicle bution in post-earthquake,” Transportation Research Part E:
Mij � 1, . . . , |Mij | : Set of available traffic links between Logistics and Transportation Review, vol. 69, pp. 160–179,
 2014.
 two nodes i and j, i ≠ j
 [4] B. Vitoriano, M. T. Ortuño, G. Tirado, and J. Montero, “A
rijm (ω): Probability of crossing the mth link multi-criteria optimization model for humanitarian aid dis-
 between two nodes i and j under tribution,” Journal of Global Optimization, vol. 51, no. 2,
 scenario ω pp. 189–208, 2011.
Hm � 1, . . . , |Hm | : Set of time intervals in the mth link [5] M. Hamedi, A. Haghani, and S. Yang, “Reliable transportation
 between two nodes i and j of humanitarian supplies in disaster response: model and
C1: Operational cos per unit of time heuristic,” Procedia-Social and Behavioral Sciences, vol. 54,
ω ∈ Ω: The indices of scenarios pp. 1205–1219, 2012.
C2: Late arrival penalty cost [6] F. Liberatore, M. T. Ortuño, G. Tirado, B. Vitoriano, and
i, j: Indices to nodes i, j ∈ {N ∪ P} M. P. Scaparra, “A hierarchical compromise model for the
 joint optimization of recovery operations and distribution of
Tijm (ω): The head points of new time intervals
 emergency goods in Humanitarian Logistics,” Computers &
 in the mth link between two nodes i Operations Research, vol. 42, pp. 3–13, 2014.
 and j under scenario ω [7] B. Vahdani, D. Veysmoradi, F. Noori, and F. Mansour, “Two-
k: Indices to vehicles k ∈ {1, . . . , |K|} stage multi-objective location-routing-inventory model for
ahijm (ω), bhijm (ω): Coefficients to determine the travel humanitarian logistics network design under uncertainty,”
 time in the mth link between two International Journal of Disaster Risk Reduction, vol. 27,
 node i and j under scenario ω pp. 290–306, 2018.
You can also read