Patterns of population displacement during mega-fires in California detected using Facebook Disaster Maps - IOPscience
←
→
Page content transcription
If your browser does not render page correctly, please read the page content below
Environmental Research Letters

LETTER • OPEN ACCESS

Patterns of population displacement during mega-fires in California
detected using Facebook Disaster Maps
To cite this article: Shenyue Jia et al 2020 Environ. Res. Lett. 15 074029

View the article online for updates and enhancements.

                                This content was downloaded from IP address 176.9.8.24 on 18/09/2020 at 11:26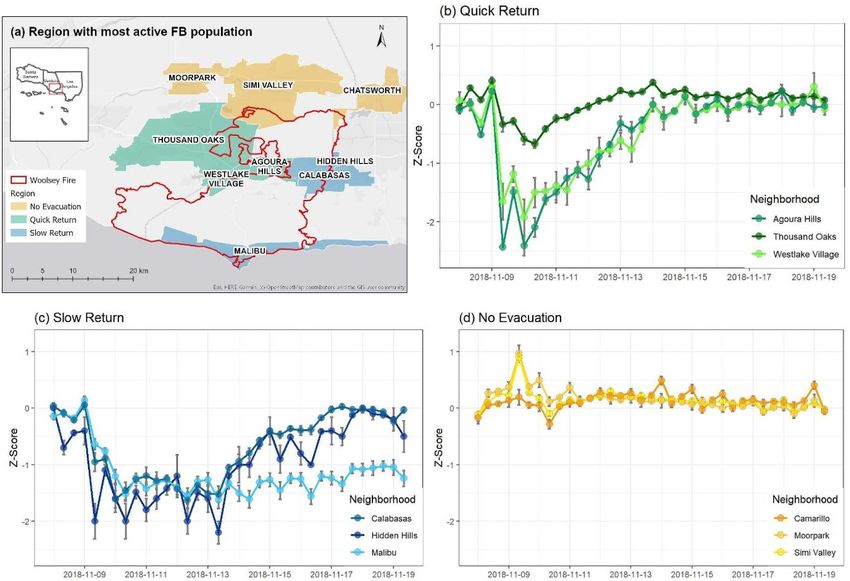
Environ. Res. Lett. 15 (2020) 074029                                                      https://doi.org/10.1088/1748-9326/ab8847

                              Environmental Research Letters

                              Patterns of population displacement during mega-fires in
                              California detected using Facebook Disaster Maps
OPEN ACCESS                   Shenyue Jia1, Seung Hee Kim1,4, Son V Nghiem2, Paul Doherty3 and Menas C Kafatos1
                              1
                                  Center of Excellence in Earth Systems Modeling and Observations (CEESMO), Chapman University, Orange, California, United States
RECEIVED                          of America
30 January 2020               2
                                  NASA Jet Propulsion Laboratory, California Institute of Technology, Pasadena, California, United States of America
                              3
REVISED                           National Alliance for Public Safety GIS (NAPSG) Foundation, Washington D.C., United States of America
                              4
30 March 2020                     Author to whom any correspondence should be addressed
ACCEPTED FOR PUBLICATION      E-mail: sekim@chapman.edu
9 April 2020
PUBLISHED
                              Keywords: Facebook disaster maps, crowdsourced data, social media, Mann-Kendall trend, anomaly analysis, wildfires, California
2 July 2020

Original content from
                              Abstract
this work may be used         The Facebook Disaster Maps (FBDM) work presented here is the first time this platform has been
under the terms of the
Creative Commons              used to provide analysis-ready population change products derived from crowdsourced data
Attribution 4.0 licence.
Any further distribution
                              targeting disaster relief practices. We evaluate the representativeness of FBDM data using the
of this work must             Mann-Kendall test and emerging hot and cold spots in an anomaly analysis to reveal the trend,
maintain attribution to
the author(s) and the title   magnitude, and agglommeration of population displacement during the Mendocino Complex and
of the work, journal
citation and DOI.
                              Woolsey fires in California, USA. Our results show that the distribution of FBDM pre-crisis users
                              fits well with the total population from different sources. Due to usage habits, the elder population
                              is underrepresented in FBDM data. During the two mega-fires in California, FBDM data effectively
                              captured the temporal change of population arising from the placing and lifting of evacuation
                              orders. Coupled with monotonic trends, the fall and rise of cold and hot spots of population
                              revealed the areas with the greatest population drop and potential places to house the displaced
                              residents. A comparison between the Mendocino Complex and Woolsey fires indicates that a
                              densely populated region can be evacuated faster than a scarcely populated one, possibly due to
                              better access to transportation. In sparsely populated fire-prone areas, resources should be
                              prioritized to move people to shelters as the displaced residents do not have many alternative
                              options, while their counterparts in densely populated areas can utilize their social connections to
                              seek temporary stay at nearby locations during an evacuation. Integrated with an assessment on
                              underrepresented communities, FBDM data and the derivatives can provide much needed
                              information of near real-time population displacement for crisis response and disaster relief. As
                              applications and data generation mature, FBDM will harness crowdsourced data and aid first
                              responder decision-making.

                              1. Introduction                                                     movements in a timely manner and assist dis-
                                                                                                  aster relief. Crowdsourced geolocation data through
                              Abrupt population displacement is a common emer-                    location-based services are sensitive to the fluctuation
                              gency response strategy applied before or during                    of users’ position change and respond promptly to the
                              a natural disaster. Evaluating the effectiveness of                 spatial movement and formation of clusters. For the
                              this strategy and obtaining useful information for                  most popular social media platforms like Twitter and
                              disaster relief during a large population displace-                 Facebook, their crowdsourced geolocation data can
                              ment is of great interest to both policy-makers                     serve as proxies of population distribution to answer
                              and researchers. The accessibility of cellular tower                the most basic yet important question for any crisis
                              transmission data with geospatial signature has                     response task: ‘Where are the people?’
                              been greatly constrained amid the concern of data                        Studies and actual practices have been carried out
                              abuse and privacy preservation [1, 2]. Therefore,                   using the geotagged Tweets and Flickr picture uploads
                              many researchers and practitioners have turned to                   to track and reveal the change and distribution
                              geolocation data that are crowdsourced through lead-                of population during natural disasters and pub-
                              ing social media platforms to assimilate population                 lic safety crises [3–8]. These successful applications

                              © 2020 The Author(s). Published by IOP Publishing Ltd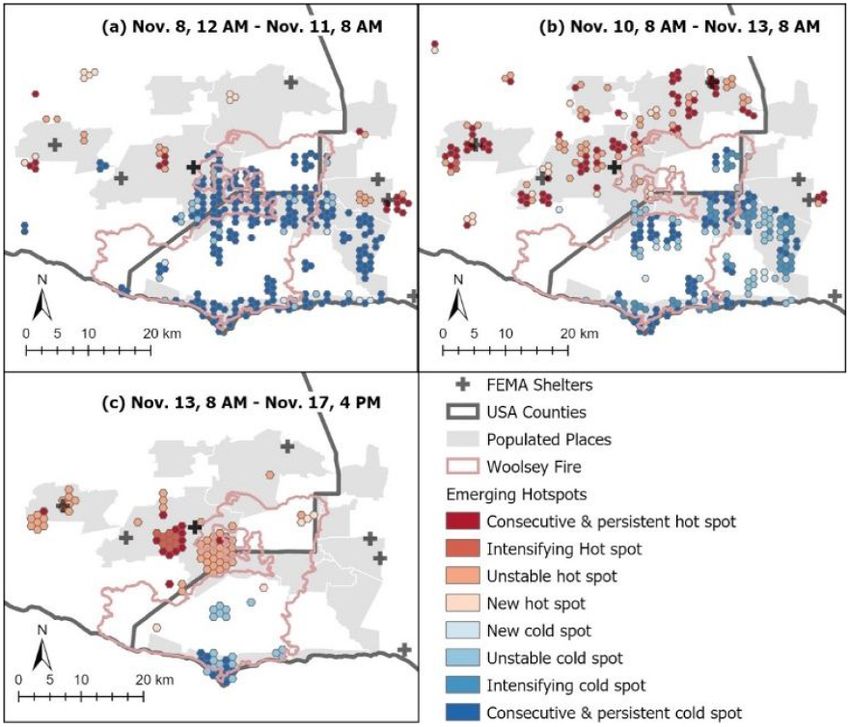
Environ. Res. Lett. 15 (2020) 074029                                                                           S Jia et al

also motivated the leading social media platforms to         to identify disaster-prone communities and plans for
develop their official crisis response tools. Such efforts   effective mitigation strategies.
have greatly increased the popularity of crowdsourced            In this paper, we use the FBDM population
data in time-sensitive situations for urgent emergency       change data to analyze the spatio-temporal patterns
actions, with natural disasters being prime examples.        of population displacement during the Mendocino
While the representativeness of the social media pop-        Complex and the Woolsey fires, two mega-fires which
ulation has been questioned [4, 9, 10], the steadily         occurred in California, USA, in 2018. Our study first
increasing pool of active users of these platforms [11]      evaluates the representativeness of FBDM popula-
has helped capture a more accurate picture of human          tion, then calculates a series of derivatives from the
activities [12].                                             basic FBDM population change data to reveal the
    Current limitations to advance the use of crowd-         spatio-temporal pattern of population change as well
sourced data in emergency response can be framed             as hot spots. Furthermore, this study assesses the ver-
into three major points. First, most studies using           satility of these derivatives by comparing the out-
crowdsource data from social media, especially               comes between mega-fires occurred in scarcely and
Twitter [5], were focused on the development of              densely populated regions.
algorithms and pipelines to effectively retrieve and
clean the raw data from platforms but could not              2. Mendocino Complex fire and Woolsey
derive meaningful metrics to support decision-               fire
making [13–15]. Second, pipelines of data processing
applied by different teams sometimes varied, caus-           The Mendocino Complex (459 000 acres) and Wool-
ing difficulties to compare the derived outcomes.            sey fires (96 949 acres) were selected due to their
Third, a knowledge detachment occurred between               exceptionally large perimeter and damage in Califor-
data analysts and first responders due to the different      nia during the 2018 fire season, the first full-length
backgrounds and focus of interest [16].                      fire season after the launch of FBDM. These two fires
    These limitations can partly be alleviated by            also represented the environmental and social settings
developing a universal and analysis-ready dataset            of fire-prone areas in less populated, forest covered
of population movements for major disasters and              Northern California versus heavily populated, shrub-
emergencies across different parts of the world.             land dominated Southern California.
Such a dataset can relieve analysts the complex pre-              As the largest wildfire recorded in California’s his-
processing of crowdsourced data and support imme-            tory, the Mendocino Complex fire started on 27 July
diate analyses to decision-making as well as it can          2018 and was not fully contained until 7 Novem-
be compared across different situations. The launch          ber 2018. This fire complex consists of two fires, the
of Disaster Maps by Facebook in 2017 is a major              smaller, earlier contained River fire and the larger
effort to address this need. As a part of Facebook           Ranch fire (figure 1(a)). Mandatory evacuations ini-
Data for Good (dataforgood.fb.com) initiative, Face-         tiated and ended on different days near the perimet-
book Disaster Maps (FBDM) tool provides popula-              ers of the River and Ranch fires (figure 2(a)). For the
tion displacement information every 8 h in a 1 km            River fire, mandatory evacuation orders were placed
grid during any major natural disaster across the            shortly after its ignition on July 27 and lifted on July
globe [17]. Anonymized and aggregated based on the           31, which was before the situation escalated and the
crowdsourced data from Facebook App and Facebook             release of FBDM dataset. For the Ranch fire, mandat-
Safety Check App usage with location service enabled,        ory orders were in place from August 3 to August 7
FBDM not only provides population count changes              for the neighborhoods on the west side of the down-
over the period of natural disasters, but also gen-          wind direction. The burned area has a low popula-
erates metrics to capture population anomaly com-            tion density at 76 people per km2 , thus causing less
pared with a pre-crisis situation. In addition, FBDM         impacts than fires with similar size (table 1).
offers network and power coverage maps to illustrate              In contrast, the Woolsey fire broke out in a heav-
the Internet and power connectivity of users, based          ily populated wildland urban interface (WUI) close
on the anonymized connection data through cellular           to major metropolitan areas of Los Angeles and Ven-
network to Facebook server and the information of            tura County in Southern California (figure 1(b)), and
device charging from users [17]. For the first time, an      destroyed many more properties than the Mendo-
analysis-ready and near real-time population change          cino Complex fire (table 1). The fire quickly expan-
product has become available to assist disaster relief       ded southbound towards the Pacific coast by the
works, including identifying the places of population        strong Santa Ana winds over the shrubland. Mandat-
aggregation during a disaster [18], retrieving the dir-      ory evacuation orders were placed on 8 November
ections of population displacement [19], and evaluat-        2018 for inland and coastal cities but were lifted at dif-
ing the degree of resource needs during a disaster [20].     ferent times (figure 2(b)). The inland cities near the
Leveraging this dataset with precaution considera-           origin of fire lifted the mandatory evacuation orders
tions of privacy preservation not only assists disaster      on November 10, while cities located in the downward
relief works during particular disasters but also helps      wind direction and the outskirts of fire perimeter kept

                                                2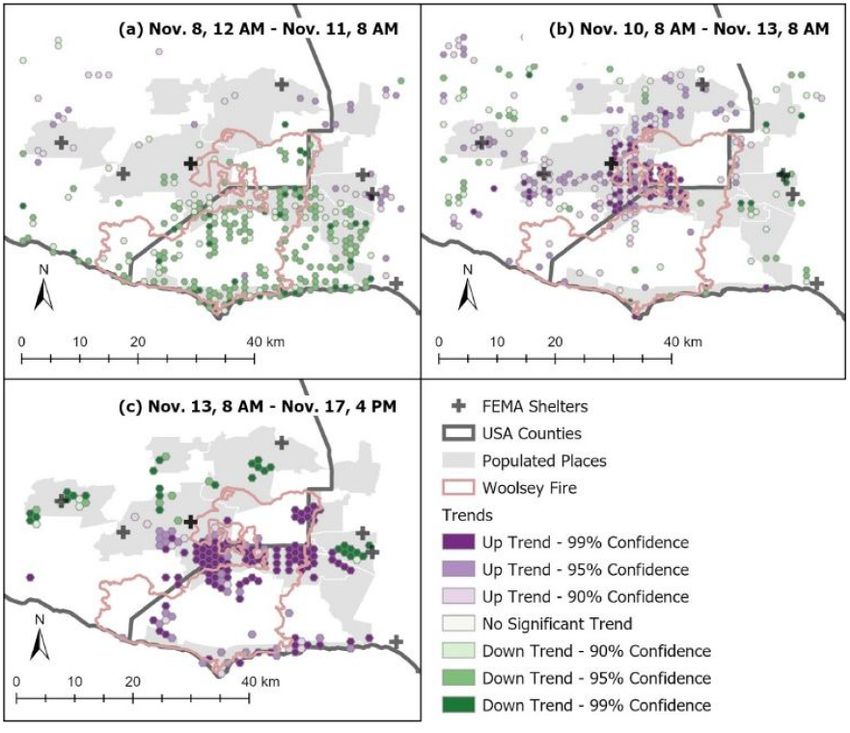
Environ. Res. Lett. 15 (2020) 074029                                                                                                           S Jia et al

   Figure 1. Progression and final perimeters of the Mendocino Complex fire (a) and the Woolsey fire (b). The change of fire
   perimeters as the burning continued is illustrated using boundaries with different colors and labels of dates. Note that maps are
   shown in different scales.

   (a) Mendocino Complex fire

                                     7/27                             7/31         8/1       8/3                               8/7     8/8     8/9
               River Fire
      Ranch Fire Downwind East
     Ranch Fire Downwind West
       FBDM Data Availability        ×       ×         ×     ×       ×         √         √   √       √       √        √        √       √        √

   (b) Woolsey fire

                                     11/9      11/10                  11/13                                          11/19
        Near the origin of fire
            Outskirts of fire
       FBDM Data Availability         √       √        √        √     √        √         √   √        √      √         √

                                                                                                          √                                ×
                Evacuation                   Evacuation                   Evacuation                   FBDM                          FBDM Data
                  Start                     Order Active                  Order lifted              Data Available                   Not Available

   Figure 2. Timeline of fire progression and the placing/lifting of evacuation orders in and near the perimeters for Mendocino
   Complex fire (a) and Woolsey fire (b). Facebook Disaster Maps (FBDM) data availability is shown at the bottom of panel a and b.

                         Table 1. Basic information of Mendocino Complex fire and Woolsey fire (citation of data).

                                                  Burned                                         Property                             Population
Fire name                Dates                    area              Land cover                   destroyed       Fatalities           Density

Mendocino                Jul. 27-7                1858 km2          Temperate and                  280                     1          16 per km2
Complex                  November 2018                              boreal forest
Woolsey                  Nov. 8-21                392 km2           Shrubland                      1643                    3          335 per km2
                         November 2018

the evacuation orders active until November 13 or                             geographical location and a given time of the day
later.                                                                        over 5–13 weeks of the pre-crisis situation [17]. Z-
                                                                              score is a standardized and unit-less metric derived
3. Data and method                                                            to measure the departure of crisis population from
                                                                              the pre-crisis situation [18]. Signs of z-score indic-
3.1. Data                                                                     ate the departure below (negative) or above (posit-
In this study, we focus on two key FBDM metrics,                              ive) the pre-crisis level. Z-score is comparable across
the Facebook baseline population (FBP) for pre-crisis                         the geographical location and time. A greater abso-
situation and Facebook population z-score for anom-                           lute value of z-score indicates a larger departure from
alies during crisis. FBP is calculated based on the                           the pre-crisis level. Both FBDM metrics are available
multi-day average login and usage of Facebook at a                            every 8 h during the major disasters and posted in
                                                            3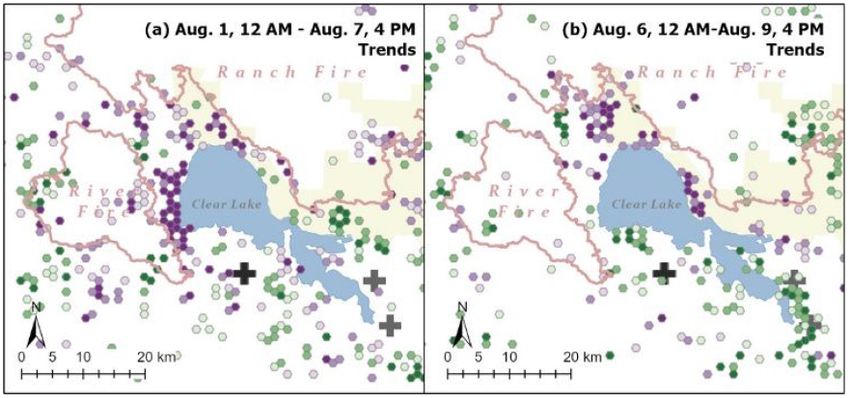
Environ. Res. Lett. 15 (2020) 074029                                                                        S Jia et al

1-km grids to aggregate and anonymize the individual        the evolution of the clusters. We construct the space-
users [18]. More information about FBDM data gen-           time cube by laying over the z-score map of every time
eration and accessibility is included in supplemental       stamp from the earliest to the latest.
information section 2.                                           Wildfire emergencies usually involve multiple
    In order to assess the representativeness of FBDM       critical events like the initiation and termination of
data, we employed two products of total population,         mandatory evacuation orders. To reveal the change of
the 2018 American Community Survey (ACS) pop-               population toward each of these events, we separate
ulation estimates at the zip code level from the U.S.       the z-score time series into sections based on the tim-
Census as well as the Gridded Population of the World       ing of these events and calculate the trend of z-score
(GPW) version 4 (1-km grid) of the Columbia Uni-            time series for each section using Mann-Kendall test,
versity [21].                                               one of the widely used distribution-free tests of trend
    We obtained the progression of fires and final          in time series analysis to reveal monotonic trend [23–
fire perimeters from the USGS Geospatial Multi-             25]. We also examine the temporal change of z-score
Agency Coordination (GeoMAC) and the California             over the entire space-time cube and detect the tipping
Department of Forestry & Fire (CAL FIRE). Inform-           points when the direction of trend changed. We then
ation of local government announcements on evac-            compare the detected tipping points with the official
uation orders was from CAL FIRE and InciWeb                 timing of the placing and lifting of evacuation orders.
(https://inciweb.nwcg.gov/). Geographical boundar-          Such analysis is conducted for the z-score time series
ies from U.S. Census TIGER were used to assist the          at each 1-km hexagon in the fire affected area to reveal
analysis.                                                   detailed spatial similarity or difference of population
                                                            displacement, which can only be made possible with
3.2. Calculating the penetration rate of Facebook           the crowdsourced data. If population change during
users                                                       the crisis presents as clusters in space, we calculate
To assess the reliability of results drawn from FBDM        average z-score over each cluster to identify the intra-
data, we first evaluated the data representativeness        cluster similarity and inter-cluster distinction.
using the penetration rate of Facebook service into the          We conducted emerging hot spot analysis to
total population. Penetration rate is defined as below      detect trends in the clustering of z-score. The clus-
(equation (1)).                                             tering is represented as hot and cold spots, or the
                                                            aggregation of high and low population grids in space.
                         Number of regular Facebook users   During wildfires, such clustering in space might grow
Penetration Rate =
                               Total population             or shrink, indicating the dynamic of population dis-
                        × 100%                        (1)   placement in space and time. To account for this
                                                            process, we calculated the Getis-Ord Gi∗ statistics
     In this study, we calculate two sets of penetration    [26, 27] to detect hot and cold spots over the 1-km
rates using different total population data, GPW in         resolution z-score map at each time slice. Then we
a 1-km grid and ACS population estimates at the zip-        conduct the Mann-Kendall trend test for the Gi∗
code level. For the penetration rate based on GPW, we       statistics of all time slices at each 1-km grid. The
resample the GPW data to the grid footprint of FBP          Mann-Kendall trend of Gi∗ is calculated to categor-
to ensure the two datasets were co-registered. For the      ize each 1-km grid as a new, unstable, or stable hot
penetration rate based on ACS estimates, we identify        and cold spot, or no significant spatial aggregation.
FBDM grids inside each zip code and sum total the           Such analysis replicates the Emerging Hot Spot Ana-
FBP values as the number of regular Facebook users.         lysis from the Space Time Pattern Mining Toolbox of
Penetration rates were calculated for all 36 time slices    ArcGIS [28].
from the FBDM Woolsey fire dataset. We also calcu-
late the zip code-level average for GPW-based penet-
ration rate to better compare it with the ACS-based         4. Results
counterpart. We average the penetration rate of all
time slices and every time stamp to reveal the over-        4.1. Representativeness of Facebook disaster maps
all penetration level of Facebook usage and its diurnal     population data
cycle.                                                      The penetration rate of Facebook usage varied
                                                            by region. Regardless of the total population data
3.3. Deriving trends and emerging hotspots for              source used in calculation, the penetration rate
Facebook population z-score                                 was higher in densely populated areas, especially
We incorporated the space-time cube [22], a data            along the major transportation corridors (figure 3).
structure designed to store spatial and temporal            In less populated and remote areas near moun-
information to facilitate the analysis of population        tains and forests, the penetration rate of Facebook
displacement pattern in space and time, including           users was much lower. However, some spuriously
temporal trend, clustering of high and low values, and      high penetration grids also are present in remote

                                                 4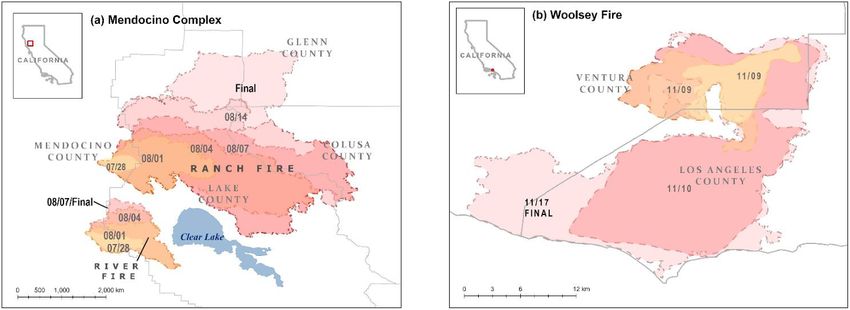
Environ. Res. Lett. 15 (2020) 074029 S Jia et al
(a) Gridded Population of World (GPW)
3,000
2,500
Average FBP
2,000
1,500
1,000
500
0
0 10,000 20,000
Gridded Population of World (GPW)
(b) ACS 2018 Estimates (Zip Code Level)
12,000
10,000
Average FBP
8,000
6,000
4,000
2,000
0
0 50,000 100,000 150,000
ACS 2018 Population (Zip Code Level)
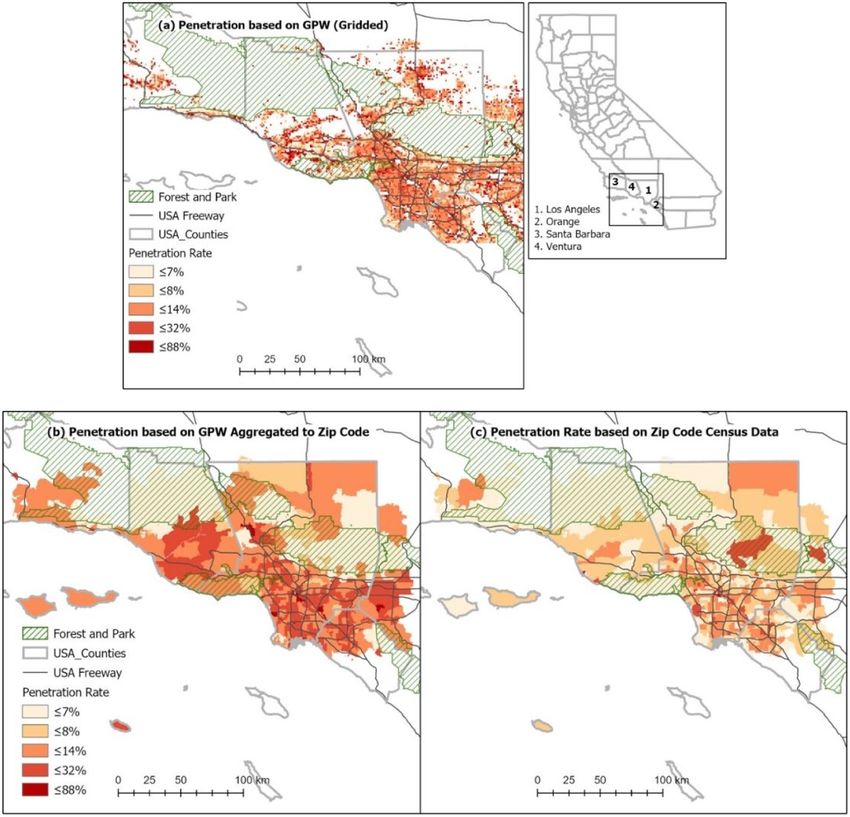
Figure 3. Spatial distribution of Facebook penetration rate based on the Facebook Disaster Maps (FBDM) Woolsey fire dataset.
Panel a represents the penetration rate calculated based on GPW posted to 1 km grids. Panel b shows the zip code level average
penetration rate based on GPW. Panel c shows the penetration rate calculated based on zip code level ACS 2018 population.
areas (figure 3(a)) due to the noise in the ori- 4.2. Overall and regional population dynamics
ginal FBP data. Such an uncertainty needs to be We found that the overall and regional average
considered while interpreting results derived for z-score captured the tipping points of population
studies about wildfires, which often affect remote when relevant communities responded to the pla-
and less populated areas. In addition, areas with a cing and lifting of mandatory evacuation orders in
higher proportion of younger population shows a both cases. The dynamics of z-score involved three
higher penetration rate of Facebook users, indicat- stages: 1) drastic decrease after the evacuation order,
ing a sampling bias of the FBDM data (SI figure 1 with some significant increase near open shelters or
https://stacks.iop.org/ERL/15/074029/mmedia). The nearby towns, 2) prominent increase after the lift-
penetration rate of Facebook usage also indicates ing of evacuation order, and 3) slowing increase
a diurnal cycle, which plunged after midnight and until z-score reached zero. The speed and mag-
peaked in the mid-morning (SI figure 2). nitude of changes during each stage varied by loc-
FBP shows a high correlation with the total pop- ation. During the Mendocino Complex fire, z-score
ulation. In the FBDM Woosley fire dataset, the R2 took 9 time steps (i.e. 72 h, time step 3 to 11) to
between the average FBP and the total population decrease to its lowest since the placing of evacu-
from GPW and ACS 2018 estimates was 0.8322 and ation order (figure 5, blue line). For the Woolsey
0.8171, respectively (figure 4). The average penetra- fire, such time was much shorter (32 h, time step
tion rate, shown as the slope of the linear fit equation 5 to 9) (figure 5, orange line). The lowest z-score
in figure 4, indicated that FBP sampled 11.89% from might stay for several time steps, depending on how
the GPW and 7.91% from the ACS 2018 population soon the evacuation orders were lifted. Upon the
estimates in the FBDM Woolsey fire dataset. GPW- lifting of evacuation orders, z-score climbed up in
based penetration rate was higher than the ACS-based a slower pace than its decrease to reach zero (fig-
rate, due to a systematical underestimation of popu- ure 5), representing overall situation of population
lation in GPW [29]. distribution.
5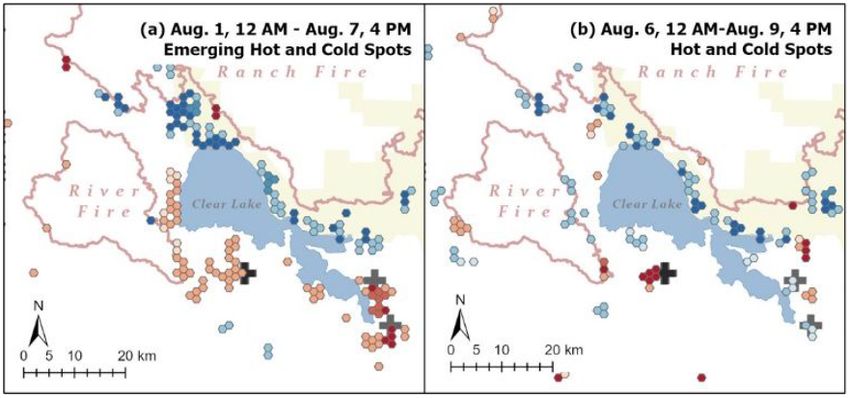
Environ. Res. Lett. 15 (2020) 074029                                                                                                                                        S Jia et al

   Figure 4. Average Facebook baseline population (FBP) from the FBDM Woolsey fire dataset and the total population. GPW 1 km
   population and ACS 2018 zip code level estimates were used in panel a and b as the total population.

                                          1                                                                                    0
                                       0.8                                 Mendocino
                                                                                                                               -0.05
                                                                                                                                       Z Score (Mendocino Complex

                                       0.6
                                                                         Complex Fire:
              Z Score (Woolsey Fire)

                                                                     Evacuation order                                          -0.1
                                       0.4
                                                                                                                                                                    Fire)

                                                                     lifted (8/7/2018)
                                       0.2
                                                                                                                               -0.15
                                          0
                                              Woolsey Fire:                                                                    -0.2
                                       -0.2
                                       -0.4   1st Evacuation
                                                                                   Woolsey Fire:                               -0.25
                                                 order lifted
                                       -0.6                                        2nd Evacuation
                                              (11/10/2018)                                                                     -0.3
                                       -0.8                                        order lifted
                                         -1                                        (11/13/2018)                                -0.35
                                              1 2 3 4 5 6 7 8 9 1011121314151617181920212223242526272829303132 33 34

                                                                  Time Step Since the Occurrence of Wildfire
                                                  Z Score (Woolsey Fire)                    Z Score (Mendocino Complex Fire)

   Figure 5. Facebook Disaster Maps (FBDM) z-score dynamics inside the entire region of interest affected by fire during the fire
   progression. Blue and orange lines represent the Mendocino Complex fire and the Woolsey fire, respectively. Red circles indicate
   the issue of an evacuation order. Green circles indicate evacuation order lifting. Z-scores are presented in an 8-hour time step.
   Positive z-score indicates that Facebook users are above the pre-crisis average, while negative z-score indicates that Facebook users
   are below the pre-crisis average.

                                                                            6
Environ. Res. Lett. 15 (2020) 074029 S Jia et al
The average z-score also captured the spatial showed significant increase of z-score while areas to
difference emerging from the differing time of the south of the Ranch fire was undergoing a popula-
evacuation orders placing and lifting by places. Dur- tion decrease after the newly placed evacuation order
ing the Woolsey fire, evacuation orders were lifted (figure 8(a)). When the evacuation orders near Ranch
much sooner for neighborhoods near the fire ori- fire were lifted, positive trend occurred in parallel to
gin than elsewhere. Such a difference resulted in the z-score decrease near the two OPEN shelters in
three prominent types of population dynamic pat- the southeast corner of Clear Lake (figure 8(b)). Over-
terns in the fire-affected region, including area of all, the trend straightforwardly showed the most act-
quick return, slow return, and flash increase (fig- ive areas of population decrease and increase during
ure 6). A subtle yet distinguishable difference within wildfire emergencies, providing insights on popula-
each type also indicates the linkage between the size tion displacement.
of area affected and the magnitude of population
movement. With a much smaller area and fraction 4.4. Changing hot and cold spots of population
of residents affected by the mandatory evacuation, displacement
Thousand Oaks showed a less drastic change of z- As spatial clustering of population anomaly, hot and
score than other neighborhoods in the quick return cold spots of z-score might expand, persist, shrink,
group, where the majority of the neighborhood was or disappear as a wildfire emergency unfolds. Record-
evacuated (figure 6(b)). A greater area exposed to ing the rise and fall of them not only documents the
wildfire progression and evacuation meant greater degree of population displacement but also identi-
damage and longer road closure. Such inconveni- fies the temporal places of the population. During
ences resulted in the low possibility and willingness an active evacuation period, cold spots were consec-
to return, therefore led to a more gradual z-score utive and persistent across the evacuated area, with
recovery (Calabasas and Hidden Hills) or even no new cold spots popping up near its outskirt (figures
recovery at all (Malibu) (figure 6(c)). Aside from the 9(a) and 10(a)). When the evacuation orders were
decline of population, z-score also pinpointed pos- lifted, cold spots either became less stable or disap-
sible destinations of the displaced people. Z-score peared (figures 9(b) and 10(b)), which was consist-
increased slightly in November 9 outside the north- ent with the increasing trend of z-score (figures 7(b)
ern boundary of fire perimeters and quickly declined and 8(b)). When most residents returned home, a
after November 10 (figure 6(d)), in parallel to the pla- large number of cold or hot spots became unstable or
cing and lifting of the evacuation orders in Thousand even disappeared (figures 7(c) and 8(b)), indicating
Oaks and nearby neighborhoods (figure 6(b)). As the the end of the anomalous population change arising
closest populated area not affected by the Woolsey fire from the displacement. Compared to cold spots, hot
in this region, these neighborhoods became potential spots were less common while the population dis-
destinations to accommodate the displaced people placement was active. Yet, they represented possible
from Thousand Oaks and nearby places. places where displaced people were housed, provid-
ing crucial information for disaster relief works. A
4.3. Grid-level trends in different stages of wildfire series of stable hot spots arose at or near the open
emergencies shelters and towns not affected by the fire while the
Trends of z-score at each grid showed a consistent evacuation orders were in place (figures 9(a), (b) and
pattern with the overall and regional average val- 10(a)). New and unstable hot spots appeared in areas
ues. During the Woolsey fire, trends showed a more experiencing a strong wave of population return after
homogeneous pattern in space as the evacuation ini- evacuation ended (figures 9(c) and 10(a) near the
tiated concurrently across the region and terminated River fire). Meanwhile, some consecutive and persist-
simultaneously within nearby neighborhoods. Most ent hot spots near open shelters disappeared as people
areas affected by the Woolsey fire showed a signi- housed in these facilities and neighborhoods left for
ficant decrease of z-score while people were fleeing home (figure 10(b)). The rise and fall of hot spots near
the evacuated area, with scattered increasing grids open shelters were more prominent during the Men-
near some open shelters (figure 7(a)). When the lift- docino Complex fire, partly due to the fewer options
ing of evacuation order started, the spatial aggrega- people have in this less populated, relatively isolated
tion of increased z-score was prominent (figure 7(b)). region in Northern California.
Such increase expanded as the lifting continued (fig-
ure 7(c)). In contrast, open shelters showed a sig- 5. Discussion and conclusions
nificant decrease as the lifting of evacuation contin-
ued (figures 7(b) and (c)). For the Mendocino Com- FBDM data could reveal the trends, magnitude, and
plex fire, the trend of z-scores also captured the pop- spatial clustering of population displacement in a
ulation changes in areas undergoing different types timely manner with adequate representativeness out
of population displacement. As evacuation orders of the total population in area with intensive usage
to the west of the River fire perimeter were lifted such as California. Though biased in age and other
before the FBDM data became available, this area demographic factors, FBDM promptly captured the
7Environ. Res. Lett. 15 (2020) 074029 S Jia et al
Figure 6. Facebook Disaster Maps (FBDM) z-score change of every 8 h during the progression of Woolsey Fire for different
locations due to the different fire progression extent. Green, blue, yellow indicated neighbourhoods with quick return, slow
return, and no evacuation. Line charts from panel b to d represent the temporal change of z-score the three types of
neighbourhoods mentioned above. Error bars are plotted using ±standard error. Positive z-score indicates that Facebook users
are above pre-crisis level, while negative z-score indicates that Facebook users are below pre-crisis level.
Figure 7. Significant trend of z-score in and adjacent to the Woolsey fire perimeter when communities responded to evacuation
placing and lifting. Panels illustrate three stages during the fire emergency: (a) during the significant population drop after the
placing of evacuation order, (b) while the evacuation orders were active or partly lifted, and (c) after evacuation orders were
completely lifted (c).
abrupt population displacement when the placing resulted from the displacement. The timely response
and lifting of mandatory evacuation orders occurred. from the platform and the provision of compar-
The dataset was sensitive not only to the prominent able and analysis-ready products provides a found-
decrease of population in the evacuated area but also ation for trend analysis and spatial pattern detec-
to the significant and flashy increase of population tion to support decision making. State and local
8Environ. Res. Lett. 15 (2020) 074029 S Jia et al
Figure 8. Significant trend of z-score in and adjacent to the Mendocino Complex fire perimeter when communities responded to
evacuation placing and lifting. Panels illustrate two stages during the fire emergency: (a) while the evacuation orders were active
or partly lifted and (b) after evacuation orders were completely lifted. Legend is the same as figure 7.
Figure 9. Emerging hot and cold spots of the Woolsey fire when communities responded to evacuation placing and lifting. Panels
illustrate three stages during the fire emergency: (a) during the significant population drop after the announcement of evacuation
order, (b) while the evacuation orders were active or partly lifted, and (c) after evacuation orders were completely lifted.
Figure 10. Emerging hot and cold spots of the Mendocino Complex fire when communities responded to evacuation placing and
lifting. Panels illustrate two stages during the fire emergency: (a) while the evacuation orders were active or partly lifted and (b)
after evacuation orders were completely lifted. Legend is the same as figure 9.
9Environ. Res. Lett. 15 (2020) 074029 S Jia et al
agencies design information products that could be the first platform to provide analysis-ready products
used for monitoring local events like wildfires. We from crowdsourced data for disaster relief in a timely
believe FBDM can improve usability of the platform manner. We have found that FBDM population z-
by increasing the frequency at which data are released score is a useful metric to reveal the temporal trend
and by partnering with organizations who can pro- and spatial clustering during the massive popula-
duce actionable information products. tion displacement arising from major disasters such
Distilling map series of population into mean- as mega-fires. Derivatives from z-score, such as the
ingful secondary derivatives was necessary to harness Mann-Kendall trend, hot/cold spots, and the change
the power of FBDM data. In this study, we calcu- of hot/cold spots can provide insightful informa-
lated the Mann-Kendall trend and derived emerging tion to evaluate the progress of population evacu-
hot and cold spots of Facebook population z-score ation and return, identify agglomeration of displaced
to reveal the spatio-temporal pattern of population population, and assess the effectiveness of disaster
displacement. The rise of persistent and intensify- relief strategy. With an uncertainty evaluation on
ing hot spots near open shelters during the evacu- the underrepresented groups, an improved workflow,
ation was crucial information for disaster relief prac- and a coupled analysis with auxiliary products (move-
tice and post-disaster strategy. The analytical pipeline ment vectors, mobile connectivity), FBDM popu-
is highly transferrable to other disasters or emergen- lation can help first responders deliver assistance
cies with a better predictability, such as tornadoes, to much needed communities and assist decision-
hurricanes and planned power outage amid extreme makers to mitigate the disorder and chaos during
wildfire risk exacerbated by urbanization. crisis response. As illustrated in this paper, the FBDM
Comparability, a crucial feature of FBDM data, is method is versatile and thus adaptable to extreme
critical for post-disaster reflection and future plan- wildfire situations such as the recent bushfires in Aus-
ning improvements. The same protocol of data gen- tralia that have caused record-breaking population
eration enables the intercomparison between fires displacement [34]. In short, future research should
occurring in regions with varying social and environ- focus on providing FBDM in ‘the right format, to
mental settings. In this study, we found that the evac- the right people, at the right time’ in order to allow
uation in densely populated fire-prone area was faster decision-makers and first responders to enhance out-
due to the size of geographical area involved and the comes for survivors.
connectivity to transportation network. Population Regarding future research, together with FBDM
density affects the needs of resources and a less popu- or similar crowdsourced data and independent
lated region might need resources prioritized to open remote sensing observations, the method presented
shelters. In contrast, open shelters were not identified in this paper can be adapted for applications to bio-
as hot spots in densely populated regions, as the dis- logical disasters in assessing the efficacy of emergency
placed residents may have alternative options for tem- measures, such as the quarantine or lockdown orders
porary stay by exploiting their social connections [30] amid the COVID-19 pandemic [35].
in nearby communities.
FBDM under-samples the elder population due
Acknowledgments
to the relatively low popularity of Facebook in these
age groups. Although such bias does not signific-
We thank Alex Pompe and Lauren McGorman from
antly affect the detection of the overall displacement
Facebook Data for Good for granting the access to
trend and pattern, it could overlook the communities
Facebook Disaster Maps to conduct this study. We
demanding more assistance yet failing to voice them-
also thank Andrew Schroeder from Direct Relief for
selves out in the FBDM data. An analysis of social vul-
his input on conceptualizing the research ideas. The
nerability based on the latest demographic data would
research, including urbanization impacts and pop-
be necessary [31] to identify the underrepresented
ulation dynamics, carried out at the Jet Propulsion
but highly vulnerable communities. Such a discrep-
Laboratory, California Institute of Technology, was
ancies should be taken into consideration while using
supported by the National Aeronautics and Space
FBDM data to evaluate whether a neighborhood has
Administration (NASA) Land-Cover and Land-Use
been sufficiently evacuated and advising first respon-
Change (LCLUC) Program.
ders to target the most vulnerable neighborhoods. In
addition, the Internet connectivity can be disrupted
Data availability statement
during emergency situations, leading to an under-
estimation of human activities [32]. The connectiv-
Data sharing is not applicable to this article as no new
ity of mobile network map from FBDM [17] should
data were created or analysed in this study.
be employed to account for such uncertainty and
identify places with a higher possibility for a false sig-
References
nal of population patterns.
Challenging the so-called ‘The Tyranny of the [1] Deville P, Linard C, Martin S, Gilbert M, Stevens F R,
Tweet’ [33] in a crisis response sector, FBDM is Gaughan A E et al 2014 Dynamic population mapping using
10Environ. Res. Lett. 15 (2020) 074029 S Jia et al
mobile phone data Proc. Natl. Acad. Sci. Study on the Mendocino Complex Fire with Disaster Maps
111 15888–93 by Facebook. AGU Fall Meeting Abstracts
[2] Blondel V D, Decuyper A, and Krings G 2015 A survey of 2018 pp NH23C–0856
results on mobile phone datasets analysis Epj Data Sci. 4 1 [19] Esri 2019 Location analytics supports nonprofit’s wildfire
[3] Reuter C, Hughes A L, and Kaufhold M A 2018 Social media relief efforts (https://www.esri.com/en-us/landing-
in crisis management: an evaluation and analysis of crisis page/product/2019/direct-relief-case-study-v2)
informatics research Int. J. Hum. Comput. Int. 34 280–94 [20] Schroeder A “Data for good” and the new humanitarian
[4] Zou L, Lam N S, Shams S, Cai H, Meyer M A, Yang S et al future 2019 (https://www.directrelief.org/2019/01/data-for-
2019 Social and geographical disparities in twitter use during good-and-the-new-humanitarian-future/)
hurricane harvey Int. J. Digit. Earth 12 1300–18 [21] Center for International Earth Science Information Network
[5] Martín Y, Li Z, and Cutter S L 2017 Leveraging twitter to (CIESIN) Columbia University 2018 Gridded Population of
gauge evacuation compliance: spatiotemporal analysis of the World, Version 4 (GPWv4) Population Count, Revision 11
hurricane Matthew PLoS One 12 e0181701 (Palisades, NY: NASA Socioeconomic Data and Applications
[6] Cai H, Lam -N S-N, Zou L, Qiang Y, and Li K 2016 Assessing Center (SEDAC))
community resilience to coastal hazards in the lower [22] Harris N L, Goldman E, Gabris C, Nordling J, Minnemeyer
mississippi river basin Water 8 46 S, Ansari S et al 2017 Using spatial statistics to identify
[7] Guan X, and Chen C 2014 Using social media data to emerging hot spots of forest loss Environ. Res. Lett. 12 024012
understand and assess disasters Nat. Hazards 74 837–50 [23] Hamed K H 2009 Exact distribution of the Mann-Kendall
[8] Wang Z, and Ye X 2019 Space, time, and situational trend test statistic for persistent data J. Hydrol. 365 86–94
awareness in natural hazards: a case study of hurricane sandy [24] Mann H B 1945 Nonparametric tests against trend
with social media data Cartography Geog. Inf. Sci. Econometrica 13 245–59
46 334–46 [25] Kendall M G 1948 Rank Correlation Methods (London:
[9] Blank G, and Lutz C 2017 Representativeness of social media Oxford University Press)
in great britain: investigating Facebook, Linkedin, Twitter, [26] Getis A, and Ord J K 1992 The analysis of spatial association
Pinterest, Google+, and Instagram Am. Behav. Sci. by use of distance statistics Geog. Anal. 24 189–206
61 741–56 [27] Ord J K, and Getis A 1995 Local spatial autocorrelation
[10] Hargittai E 2015 Is bigger always better? potential biases of statistics: distributional issues and an application Geog. Anal.
big data derived from social network sites Ann. Am. Acad. 27 286–306
Pol. Soc. Sci. 659 63–76 [28] Esri How emerging hot spot analysis works
[11] Clement J 2019 Facebook: number of monthly active users (https://pro.arcgis.com/en/pro-app/tool-reference/space-
worldwide 2008-2019 (https://www.statista.com/statistics/ time-pattern-mining/learnmoreemerging.htm)
264810/number-of-monthly-active-facebook-users- [29] Center for International Earth Science Information Network
worldwide/) (CIESIN) Columbia University 2018 Documentation for the
[12] Crooks A, Pfoser D, Jenkins A, Croitoru A, Stefanidis A, Gridded Population of the World, Version 4 (GPWv4)
Smith D et al 2015 Crowdsourcing urban form and function Revision 11 Data Sets (Palisades NY: NASA Socioeconomic
Int. J. Geog. Inf. Sci. 29 720–41 Data and Applications Center (SEDAC)) 10.7927/H45Q4T5F
[13] Carley K M, Malik M, Landwehr P M, Pfeffer J, and [30] Metaxa-Kakavouli D, Maas P, and Aldrich D P 2018 How
Kowalchuck M 2016 Crowd sourcing disaster management: Social Ties Influence Hurricane Evacuation Behavior Proc.
the complex nature of twitter usage in Padang Indonesia Saf. ACM Hum. Comput. Interact. 2 122
Sci. 90 48–61 [31] Cutter S L, Ash K D, and Emrich C T 2014 The geographies
[14] Liu Z, Du Y, Yi J, Liang F, Ma T, and Pei T 2019 Quantitative of community disaster resilience Glob. Environ. Change
estimates of collective geo-tagged human activities in 29 65–77
response to typhoon Hato using location-aware big data Int. [32] Tyler M C H. 2018 Woolsey, Hill fires cause Spectrum
J. Digit. Earth pp 1–21 internet, cable outages in Ventura County
[15] Lu X, and Brelsford C 2014 Network structure and (https://www.vcstar.com/story/news/2018/11/11/woolsey-
community evolution on twitter: human behavior change in hill-fires-cause-spectrum-outages-ventura-
response to the 2011 japanese earthquake and tsunami Sci. county/1966230002/ (Accessed 11 November
Rep. 4 6773 2019)
[16] Wang Z, and Ye X 2018 Social media analytics for natural [33] Palen L, and Anderson K M 2016 Crisis informatics-new
disaster management Int. J. Geog. Inf. Sci. 32 49–72 data for extraordinary times Science 353 224–5
[17] Maas P, Iyer S, Gros A, Park W, McGorman L, and Nayak C [34] Pickrell J 2019 Massive Australian blazes will ‘reframe our
2019 Facebook disaster maps: aggregate insights for crisis understanding of bushfire’: science news (available at:
response & recovery Proc. of the 25th ACM SIGKDD Int. https://www.sciencemag.org/news/2019/11/massive-
Conf. on Knowledge Discovery & Data (May 2019 Valencia, australian-blazes-will-reframe-our-understanding-bushfire)
Spain) pp 3173 [35] Buckee C O, Balsari S, Chan J, Crosas M, Dominici F, Gasser
[18] Jia S, Kim S, Nghiem S, and Kafatos M eds 2018 Near-real U et al 2020 Aggregated mobility data could help fight
time population movement during an emergency A Case COVID-19 Science 368 145–6
11You can also read