OPTIMo: Online Probabilistic Trust Inference Model for Asymmetric Human-Robot Collaborations
←
→
Page content transcription
If your browser does not render page correctly, please read the page content below
OPTIMo: Online Probabilistic Trust Inference Model for
          Asymmetric Human-Robot Collaborations ∗

                                        Anqi Xu                                                     Gregory Dudek
                                 McGill University                                                   McGill University
                                 Montreal, Canada                                                    Montreal, Canada
                           anqixu@cim.mcgill.ca                                                 dudek@cim.mcgill.ca

ABSTRACT                                                                             asymmetric human-robot teams, where the operator occa-
We present OPTIMo: an Online Probabilistic Trust Infer-                              sionally intervenes to aid the autonomous robot at its given
ence Model for quantifying the degree of trust that a human                          task. We conducted a large observational study with diverse
supervisor has in an autonomous robot “worker”. Repre-                               roboticists belonging to a nation-wide field robotics network,
sented as a Dynamic Bayesian Network (DBN), OPTIMo                                   to gather both empirical data as well as pragmatic insights
infers beliefs over the human’s moment-to-moment latent                              towards the development of our trust model. The result-
trust states, based on the history of observed interaction                           ing Online Probabilistic Trust Inference Model (OPTIMo)
experiences. A separate model instance is trained on each                            formulates Bayesian beliefs over the human’s moment-to-
user’s experiences, leading to an interpretable and person-                          moment trust states, based on the robot’s task performance
alized characterization of that operator’s behaviors and at-                         and the operator’s reactions over time. Our empirical anal-
titudes. Using datasets collected from an interaction study                          yses demonstrate OPTIMo’s great performance in a broad
with a large group of roboticists, we empirically assess OP-                         range of settings, and also highlight improvements in both
TIMo’s performance under a broad range of configurations.                            accuracy and responsiveness over existing trust models.
These evaluation results highlight OPTIMo’s advances in                                 The end-goal of our research is to develop trust-seeking
both prediction accuracy and responsiveness over several                             adaptive robots: these robots will be able to sense when the
existing trust models. This accurate and near real-time                              human has low trust, and adapt their behaviors in response
human-robot trust measure makes possible the development                             to improve task performance and seek greater trust. In this
of autonomous robots that can adapt their behaviors dynam-                           work we address an essential component of this trust-seeking
ically, to actively seek greater trust and greater efficiency                        methodology, by developing a trust model that can accu-
within future human-robot collaborations.                                            rately and responsively quantify the human’s trust states
                                                                                     during interactions. Our ongoing research aims to integrate
                                                                                     this online trust measure with our interactive robot behav-
Categories and Subject Descriptors                                                   ior adaptation methods [15], towards the ultimate vision of
H.1.2 [Models and Principles]: User/Machine Systems—                                 synergistic and trust-maximizing human-robot teams.
software psychology                                                                     This work’s main contribution, OPTIMo, is a personal-
                                                                                     ized trust model that can accurately infer human-robot trust
                                                                                     states at various interaction time scales. OPTIMo has the
General Terms                                                                        unique ability to estimate the operator’s degree of trust in
Algorithms, Experimentation                                                          near real-time, whereas existing models operate on the or-
                                                                                     ders of minutes or longer [7, 2, 14]. Also, OPTIMo combines
1.     INTRODUCTION                                                                  the two dominant trust modeling approaches in the litera-
                                                                                     ture, namely through causal reasoning of updates to the
   Trust – one’s belief in the competence and reliability of
                                                                                     robot’s trustworthiness given its task performance, and us-
another – is the cornerstone of all long-lasting collabora-
                                                                                     ing evidence from direct experiences to describe a human’s
tions. We present the design, development, and evaluation
                                                                                     actual amount of trust. Our empirical results substantiate
of a personalized dynamics model for a human operator’s
                                                                                     OPTIMo’s diverse utilities, through accurate and responsive
degree of trust in a robot teammate. This work focuses on
                                                                                     predictions of each user’s trust states and trust-dependent
∗This document is a preprint of the Definitive Version:                              behaviors, and also capturing interpretable characterizations
http://dx.doi.org/10.1145/2696454.2696492.                                           of the operator’s trust tendencies.

                                                                                     2.   BACKGROUND
Permission to make digital or hard copies of all or part of this work for               Trust is a rich and multi-faceted construct, studied across
personal or classroom use is granted without fee provided that copies are            many disciplines [8, 5], given its critical role in healthy and
not made or distributed for profit or commercial advantage and that copies           effective human relationships. This section explores domi-
bear this notice and the full citation on the first page. To copy otherwise, to      nant aspects of trust applicable to human-robot collabora-
republish, to post on servers or to redistribute to lists, requires prior specific   tions, and in particular to asymmetric teams. We highlight
permission and/or a fee.
HRI ’15, March 02-05 2015, Portland, OR, USA                                         important assumptions about human-robot trust, towards
Copyright 2015 ACM 978-1-4503-2883-8/15/03 ...$15.00.                                establishing a coherent mathematical model.
2.1 Trust Characterization
Lee and See surveyed the many dimensions used to char-
acterize the basis of trust in automation [8]. These broadly
fall under two categories: those based on the automation’s
task performance, and those based on its honest integrity.
As is typical in robotics research [2, 14, 10, 11], our work as-
sumes that integrity-centric bases are given, i.e. our robots
are obedient and never deceptive. We henceforth assume
a performance-centric definition of trust, namely one that
relates solely to the robot’s task efficiency and competence.
Many representations have been proposed to quantify the
degree of trust in a robot or a piece of automation. These
include binary [3] and continuous [7] measures that charac-
terize the robot’s trustworthiness caused by its task perfor-
mance, as well as ordinal scales [9, 4] used to elicit evidence
of a person’s actual amount of trust. This work incorpo-
rates both the causal and evidential modeling approaches in
the literature. We employ a continuous, interval trust repre-
sentation, spanning between complete distrust and absolute
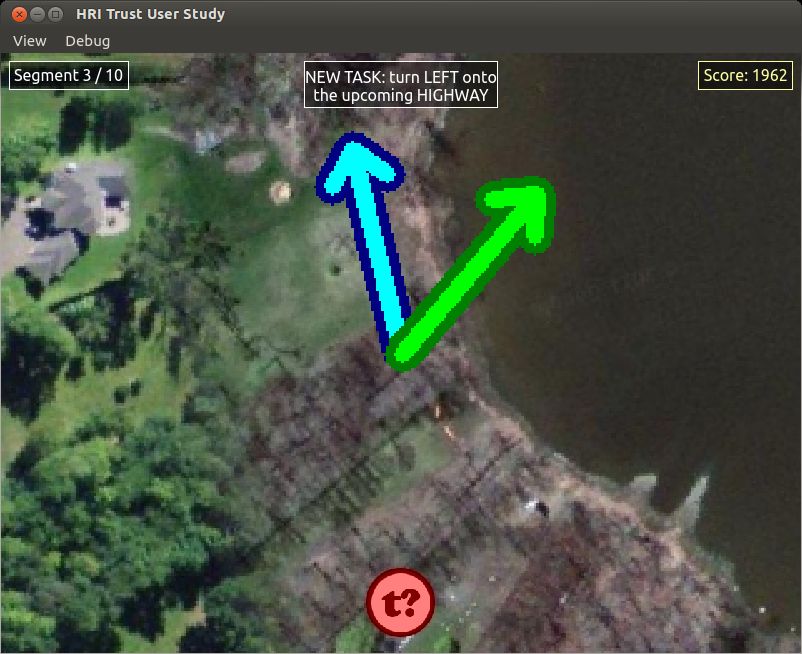
trust. Our model further quantifies the uncertainty in its Figure 1: Live camera feed from an aerial robot
estimated trust states, by maintaining Bayesian beliefs over overlaid with an autonomous boundary tracker’s
the human’s moment-to-moment degrees of trust. steering command (blue arrow), and the human’s
Multiple studies described human-robot trust through cor- interventions (green arrow). Additional overlays are
relations to interaction experiences and subjective assess- pertinent to our observational study (see Sec. 3).
ments [9, 4], although few are capable of predicting a hu-
man’s trust state. Lee and Moray presented a temporal
model for relating trust assessments to task performance fac-
tors in a human-automation context, using an Auto-Regressive 3. METHODOLOGY
and Moving Average Value regression approach (ARMAV) [7]. Our performance-centric trust modeling approach is pred-
We proposed a similar linear model in recent work [14], to icated on two simple observations of asymmetric human-
predict event-based changes in trust, by relating to expe- robot collaborations. Firstly, the robot’s trustworthiness
rience factors such as the robot’s task failure rate and the arises due to its task performance: efficient progress lead to
frequency of human interventions to correct these failures. greater trust, whereas low reliability induces losses in trust.
Desai and Yanco [2] conducted a series of robotic search and Secondly, whenever the human intervenes, it often reflects a
rescue experiments, during which users were asked to reg- lapse in trust due to the robot’s task failures.
ularly report whether their trust has increased, decreased, Formally, the goal of this work is to estimate the degree
or remained unchanged. These signals were quantified as of trust tk ∈ [0, 1] felt by a human towards a robot, at time
{+1, −1, 0} and integrated over time to obtain the Area steps k = 1 : K during their interactions. We tackle this
Under Trust Curve (AUTC) measure. We will compare OP- problem by relating the human’s latent trust states to ob-
TIMo against each of these existing trust models in Sec. 5.3. servable factors of the interaction experience. In particular,
the well-studied link between trust and the robot’s task per-
2.2 Interaction Context formance p is often quantified through the failure rate of
We focus on asymmetric, supervisor-worker style human- its autonomous system [7, 2]. In addition, human inter-
robot teams, in which an autonomous robot “worker” is ventions i, i.e. switches between autonomous and manual
chiefly responsible for handling an assigned task. The hu- control modes, are known to be strong evidential predictors
man “supervisor” has the ability to intervene and take over for trust [2, 14]. We further consider extrinsic factors e that
control, but should only do so when necessary, for example cause the operator to intervene irrespective of trust, for in-
to correct the robot’s mistakes, or to switch to a new task stance when steering along a new terrain boundary to train
objective. The human’s interventions are assumed to always our boundary-tracking robot to follow an updated target.
take precedence over the robot’s autonomous controller. We conducted an observational study to collect interac-
The trust model developed in this work generalizes readily tion experiences towards modeling trust relationships. This
to human-robot teams in arbitrary domains. Nevertheless, study further yielded pragmatic insights about trust and its
our work focuses on visual navigation contexts, where an related constructs, for asymmetric human-robot teams.
aerial robot is autonomously driven by an adaptive, visual
boundary tracking algorithm [15]. This robot can learn to 3.1 Robot Interface
follow diverse terrain contours, such as the coastline target While supervising the boundary-tracking aerial robot, the
shown in Fig. 1. We investigate scenarios where an operator human operator is presented with an interface showing the
collaborates with this robot, and model the evolution of the live onboard camera feed, as seen in Fig. 1. The operator
human’s trust in the robot’s abilities to reliably follow the can take over control of the vehicle at any time, by moving
designated boundary targets. Visual navigation tasks are an analog stick on a gamepad. Even during these periods
appealing because humans innately excel at them, whereas of manual interventions, the boundary tracker continues to
the necessary complexity in autonomous solutions [2, 15] process the camera stream and displays its generated head-
leads to uncertainty, and thus warrants the need for trust. ings. This feedback aids the human in deciding if the robotis capable of performing the task on its own, or if further This study was conducted in a fully automated manner.
assistance is needed when the tracker is behaving poorly. Following a demographics survey, a short slide-show elabo-
rated on the study and its interface. Next, the user worked
3.2 Trust Assessment Elicitation through an interactive tutorial and 2 practice sessions, to
In addition to logging performance p and intervention i, e familiarize with the tasks and trust feedback queries. After-
factors that are available in typical interaction experiences, wards, a 3-session interaction scenario and another 2-session
our study also queried the human’s trust assessments oc- scenario were each administered twice, for a total of 10
casionally. These factors are used to train personalized in- recorded sessions. All users in this observational study un-
stances of our trust model, and to evaluate their prediction derwent the task sessions in the same order, since the study
accuracies. Importantly, after the training period, our model was primarily aimed at collecting various interaction expe-
can operate without such assessment data, although their riences. This is in contrast to our previous controlled trust
availabilities will strengthen the resulting trust predictions. experiments, which quantified event-related effects [14].
3.4 Observational Study Results
The final form of the observational study resulted from
iterative refinements following a series of pilot runs. We
recruited 21 roboticists from 7 universities during a nation-
Figure 2: Post-session trust feedback questionnaire. wide field robotics gathering to take part in this study. Par-
ticipants were predominantly graduate students (86%), and
Our study is divided into multiple interaction sessions. Af- the average age of users was 27 (σ = 4). A typical study
ter each session, the user is asked to provide an assessment of run entailed 30 minutes of interaction with the boundary
their trust state, based on the cumulative interaction expe- tracking robot, operating at a 15 Hz frame rate.
rience. These trust feedback f are queried using a modified The 2 interaction scenarios were administered twice to
Visual Analog Scale (VAS) [12], as shown in Fig. 2. Multiple assess whether users behaved consistently in similar situa-
anchor points are introduced to this interval scale to reduce tions. We found no significant differences in the rate of hu-
end-aversion bias [1]. This format also addresses concerns man interventions i per matching sessions (2-tailed paired
reported by several pilot study users, regarding difficulties in t104 = 1.49, p = 0.14). The numerical sum of reported trust
quantifying their trust updates based on end-anchors only. changes c across paired session instances also did not reveal
It is important to minimize the number of trust feedback any significant differences (2-tailed paired t104 = −0.43, p =
queries, both to reduce interaction interrupts, and to mit- 0.67). In contrast, trust feedback f were found to be sig-
igate added mental strain. As an additional form of trust nificantly different when users repeated the same scenarios
evidence, each user is asked to report salient changes in their (1-tailed paired t104 = −4.85, p
0.01). We conclude that
trust states, by pressing buttons on the gamepad indicating users reacted consistently to similar events, yet their trust
whether trust has been gained, lost, or remained unchanged, assessments changed over time as they accumulated more
i.e. c = {+1, −1, 0}. Similar to previous studies [2], we en- interaction experiences. These results thus substantiate the
courage periodic reporting of c by prompting 5 seconds after need to model the temporal dynamics of human-robot trust.
each button press, both using visual feedback (with a “t?” A linear regression on trust feedback f was performed to
icon in Fig. 1) and by vibrating the gamepad. identify significant covariates from interaction experience.
An analysis of variance revealed that both the user iden-
3.3 Observational Study Design tifier (F20,188 = 17.4, p
0.01) and the ratio of user in-
Our study involved two interaction scenarios that required terventions i per session (F1,207 = 76.2, p
0.01) were
the human-robot team to follow sequences of different bound- significantly related to trust feedback f , whereas the ra-
ary targets. Each scenario is separated into 1-2 minute-long tio of AI failures per session was related to a lesser degree
sessions, to facilitate periodic queries for the user’s trust (F1,207 = 3.02, p = 0.08). The strong user dependence on
feedback f . The first scenario involved patrolling along a trust feedback supports the need for a personalized model
highway stretch, a forest path, and a coastline, whereas the of trust, which is consistent with findings in our previous
second scenario surveyed the hill-sides and shores of a fjord. study [14]. Also, the stronger trust correlation of user inter-
This study was carried out using a simulated environment ventions over AI failures is captured by the structure of our
to enforce repeatability, and to have ground truth in the dynamic Bayesian trust model, to be discussed in Sec. 4.1.
form of the ideal target boundary paths. In order to ensure Users of our study further provided a number of quali-
similar experiences across users, the interface provided vi- tative remarks, reflecting vital insights about the evolution
sual warnings whenever the robot deviated away from the of their trust in the robot’s task performance. Several users
designated boundary. If the user failed to recover in a timely reported that their “trust changed when the robot did some-
manner, the interaction then reset to a previous state. thing unpredictable”, which suggests a dependency between
Every time the boundary tracker processed a camera frame, the trust state tk at time k and the change in the robot’s
we recorded whether it had failed to detect any boundaries recent task performance, i.e. pk − pk−1 . Others said that
(i.e. AI failures reflecting task performance p ∈ {0, 1}), and their “trust fluctuated a lot initially”, given the lack of prior
the human’s intervention state i ∈ {0, 1} at that time. We experiences with the robot. This suggests that it is sensible
also noted frames in proximity to a change-over between to assume a uniform prior belief on each user’s initial degree
boundary targets, which constituted extraneous intervention of trust when interacting with a new robotic system.
causes e ∈ {0, 1}. We further recorded button presses re- During pilot runs of the study, users frequently pressed the
flecting trust changes c ∈ {−1, 0, +1}, and logged the user’s ‘trust gained’ and ‘trust lost’ buttons unintentionally when
absolute trust feedback f ∈ [0, 1] following each session. prompted for c. Consequently, the slide-show in the revisedstudy explicitly encouraged participants to press the ‘trust change in task targets at time step k, and is added as a
unchanged’ button as a default. Nevertheless, multiple par- parent link to ik . Finally, sign-aggregated trust change re-
ticipants reported that they found it “hard to suppress the ports ck ∈ {−1, 0, +1, ∅} and absolute trust feedback fk ∈
urge to hastily press ‘trust gained’ or ‘trust lost’”, and re- {[0, 1], ∅} help to ground the model’s estimates for latent
called making multiple accidental misclicks. We will model trust states tk as further evidence. Since these trust assess-
this idling bias into the relationship between a user’s latent ments occur sporadically during interactions, ∅ is used to
trust state tk and their trust change reports c. denote their non-occurrences at different time steps.
Links to each factor in this discriminative Bayesian model
are quantified as a conditional probability distribution (CPD).
4. HUMAN-ROBOT TRUST MODEL The amount for which trust tk is expected to change given
In this section, we present the Online Probabilistic Trust the robot’s recent and current task performances, pk−1 , pk ,
Inference Model (OPTIMo) for asymmetric human-robot is reflected by a linear Gaussian CPD:
teams. OPTIMo treats the degree of human-robot trust
tk at each time step k as a random variable, and maintains
belief distributions for these performance-centric trust mea- P(tk ,tk−1 , pk , pk−1 ) := P rob(tk |tk−1 , pk , pk−1 ) ≈ ∗ (1)
sures, based on various factors of the interaction experience. N (tk ; tk−1 + ωtb + ωtp pk + ωtd (pk − pk−1 ) , σt )
This probabilistic representation is useful for inferring the
human’s expected trust state at a given time, as well as the
2
amount of uncertainty of each such estimate. where N (x; µ, σ) := √2πσ 1
exp −(x−µ)
2σ 2
denotes a Gaus-
OPTIMo is represented as a Dynamic Bayesian Network sian distribution for the random variable x, with mean µ
(DBN) [6], as shown in Fig. 3. This graph structure effi- and standard deviation σ. The expression for this Gaussian
ciently encodes both causal and evidential relationships be- CPD’s mean represents the expected update to trust tk from
tween trust and other factors, as well as the evolution of trust its previous state tk−1 , as a weighted sum of a bias term (i.e.
states over time. In addition, the Bayesian model incorpo- propensity to trust), and performance-induced factors. The
rates variable-rate sources of information in a probabilistic personalized parameters ωtb , ωtp , ωtd reflect the relative im-
sound manner, and can further accommodate an arbitrary pacts on each user’s trust updates, of the bias, the current
belief for prior trust t0 . Finally, OPTIMo combines the task performance, and the difference in the robot’s perfor-
two main approaches used by existing trust models, namely mance. The propagation uncertainty parameter σt quanti-
through causal reasoning on updates to the robot’s trust- fies the variability in each user’s trust update dynamics.
worthiness given its task performance [7, 10], and evidential OPTIMo explains the probability of interventions ik by its
factor analyses of each user’s actual degree of trust [2, 14]. diverse causes, such as the current trust state tk , a recent
change in trust ∆tk := tk − tk−1 , and extraneous factors ek .
These linkages are modeled as a logistic CPD:
Oi (tk = 1,tk−1 , ik , ek ) := P rob(ik = 1|tk , tk−1 , ek ) = (2)
S (ωib + ωit tk + ωid ∆tk + ωie ek )
P rob(ik = 0|tk , tk−1 , ek ) = 1 − P rob(ik = 1|tk , tk−1 , ek )
where S(x) := (1 + exp (−x))−1 is the sigmoid distribu-
tion for the binary random variable x. The parameters
(a) first time step (b) general form
ωib , ωit , ωid , ωie quantify the bias and weights of the vari-
ous causes explaining the intervention state ik .
Figure 3: Dynamic Bayesian structure of the On- During time steps when the user reports trust changes
line Probabilistic Trust Inference Model (OPTIMo). ck ∈ {−1, 0, +1}, these are accounted as evidence to ground
Dashed factors are not observed on all time steps k, the latest update to latent trust, ∆tk . Reports of ‘trust
and are not mandatory for inferring trust states tk . gains’ and ‘trust losses’ are modeled as sigmoid CPDs:
4.1 Local Trust Relationships Oc (tk , tk−1 , ck ) :=P rob(ck |tk , tk−1 )
As seen in Fig. 3, OPTIMo relates the human’s latent P rob(ck = +1|tk , tk−1 ) =βc + (1 − 3βc ) · S (κc [∆tk − oc ])
trust state tk causally to the robot’s task performance p, and P rob(ck = −1|tk , tk−1 ) =βc + (1 − 3βc ) · S (κc [−∆tk − oc ])
also uses several sources of trust-induced evidence, including
P rob(ck = 0|tk , tk−1 ) =1 − P rob(ck = +1|tk , tk−1 ) (3)
human interventions i, trust change reports c, and absolute
trust feedback f . This model considers a continuous period − P rob(ck = −1|tk , tk−1 )
of interaction as a sequence of K non-overlapping time win-
This CPD parameterizes the nominal offset oc in a change to
dows, k = 1 : K, each lasting W seconds. We define the
latent trust ∆tk that is required to cause the user to report
window-aggregated state of task performance, pk ∈ [0, 1], as
a non-zero ck , along with the variability κc in the reporting
the ratio of frames within the k-th time window for which the
likelihoods. In addition, the uniform error term βc captures
robot’s autonomous controller failed to produce any com-
mands. Similarly, ik ∈ {0, 1} reflects whether the operator ∗
Since tk ∈ [0, 1] is bounded, the cumulative Gaussian den-
had intervened or not during its time window k. The ex- sities below tk = 0 and above tk = 1 must be added to these
traneous cause state ek ∈ {0, 1} records the presence of a end-states, enforcing a proper probability density function.the idling bias observed during our study, where users some- factors ik , ck , fk . Using the intervention factor ik as an ex-
times reported erroneous trust changes when prompted. ample, we can remove all of its instances i1:k , and predict
Finally, OPTIMo uses a zero-mean Gaussian CPD to quan- the likelihood of observing a given state at time step k as:
tify the uncertainty σf in each user’s absolute trust feedback
fk with respect to their true latent trust state tk :
P rob(ik |p1:k , e1:k , c1:k , f1:k ) =
†
RR
Of (tk , fk ) := P rob(fk |tk ) ≈ N (fk ; tk , σf ) (4) Oi (tk , tk−1 , ik , ek ) · bel(tk , tk−1 ) dtk dtk−1
RR (8)
bel(tk , tk−1 ) dtk dtk−1
All of these trust relationships have been corroborated by Please refer to [13] for derivations and examples of filtering,
prior literature [7, 2, 14], and were further supported by smoothing, and prediction for Dynamic Bayesian Networks.
results of our observational study. In particular, analyses
in Sec. 3.4 found that user interventions i were much more 4.3 Histogram Inference Engine
strongly correlated to trust than the robot’s task perfor-
We implemented OPTIMo using a histogram-based infer-
mance p. Consequently, this temporal Bayesian model uses
ence method, which approximates continuous belief densi-
pk to causally propagate the trust belief tk to a set of plau-
ties as discrete vectors of probability masses. Specifically,
sible next states, and then uses trust-induced evidences ik ,
we discretized the trust range [0, 1] into B equally-spaced
ck , and fk to exclude inconsistent hypotheses. OPTIMo’s
bins, and approximated the likelihood of tk taking on a par-
graph structure also arises naturally as the causal depiction
ticular value τ as the probability mass of the nearest bin
of the human’s trust-driven decision process.
center. The precision of this histogram approximation im-
4.2 Inference, Personalization, and Prediction proves when using larger bin sizes B, at the cost of additional
computations. A similar approximation is used when pre-
This model can be used to estimate the probabilistic belief dicting trust feedback, where the distribution for fk ∈ [0, 1]
that the user’s trust state tk ∈ [0, 1] at time step k takes on is discretized into 100 bins, and each bin center’s probability
any particular value. Trust inference can be carried out in 2 mass is computed using a form similar to Eqn. 8.
different contexts: firstly, given a history of past experience We personalized model instances using EM with multiple
data, we can query the filtered belief at the current time k, restarts, to avoid convergence to local optima. In each EM
belf (tk ) = P rob(tk |p1:k , i1:k , e1:k , c1:k , f1:k , t0 ). Separately, run, model parameters Θ are initiated from hand-selected
we can compute the smoothed belief at any time step k ∈ or random values, and then iteratively improved using con-
[0 : K] within a previously recorded interaction dataset with strained least squares optimization. An EM run is ter-
K time steps, bels (tk ) = P rob(tk |p1:K , i1:K , e1:K , c1:k , f1:k , t0 ). minated when parameters have stabilized within expected
OPTIMo’s graph structure allows both types of trust beliefs tolerances, or after a maximum number of iterations have
to be updated through efficient recursive forms [13]: lapsed. See [13] for algorithmic examples of histogram infer-
ence and model training for Dynamic Bayesian Networks.
bel(tk , tk−1 ) := O(tk , tk−1 , ik , ek , ck , fk )
· P(tk , tk−1 , pk , pk−1 ) · belf (tk−1 ) (5) 5. EVALUATION OF TRUST MODEL
R
bel(tk , tk−1 ) dtk−1 This section describes empirical assessments of OPTIMo
belf (tk ) = RR (6) under diverse settings for its non-trainable parameters, and
bel(tk , tk−1 ) dtk−1 dtk
Z compares it to several existing temporal trust models. Since
bel(tk , tk−1 ) our approach assumes that the human’s trust state tk is la-
bels (tk−1 ) = R · bels (tk ) dtk (7)
bel(tk , tk−1 ) dtk−1 tent and thus never observable, we quantify the performance
of each model by its ability to predict trust-induced behav-
where O(tk , tk−1 , ik , ek , ck , fk ) denotes the product of one iors and assessments. These include user interventions ik ,
or more observation CPDs Oi (·) , Oc (·) , Of (·) at each time trust change reports ck , and absolute trust feedback fk .
step k, based on whether ck , fk are available, i.e. ck 6= Each evaluation run begins by aggregating raw interaction
∅, fk 6= ∅. We also assume a uniform prior trust belief, datasets into W -second time windows. We personalize OP-
P rob(t0 ) = 1, when users begin to interact with a new robot. TIMo instances using training sets consisting of each user’s
In order to personalize OPTIMo to a particular user’s be- experiences during the first 5 study sessions, while assum-
haviors and trust tendencies, we use the hard-assignment ing uniform prior trust. After optimizing model parameters
Expectation Maximization (EM) algorithm [6] to find opti- to capture each operator’s trust tendencies, we compute the
mized model parameters Θ∗ (e.g. ωtb , σt , ...) given a training filtered trust belief at the end of the 5 training sessions.
set of interaction experiences. Hard-assignment EM jointly This belief is used as the prior trust for the test set, com-
optimizes the observational likelihood of all interaction data prising of the remaining 5 repeated sessions. We conduct
and the most likely sequence of latent trust states, as follows: separate prediction assessments for i1:k , c1:k , and f1:k : for
each target variable, first all of its instances in the test set
Θ∗ = arg max max P rob(t1:K , p1:K , i1:K , e1:K , c1:K , f1:K |t0 ) are removed, and then prediction beliefs are computed for
Θ t1:K each omitted occurrence, following the form of Eqn. 8. We
then compute Maximum Likelihood Estimates (MLE) us-
In addition to inferring trust beliefs, OPTIMo can also be
ing the predicted beliefs, and compare the resulting values
used to predict the probability distributions for the observed
against the omitted observed data, i1:k , c1:k , or f1:k .
† The outcomes of each evaluation run consist of predic-
Akin to P(tk , tk−1 , pk , pk−1 ), cumulative densities beyond
the range of fk ∈ [0, 1] must be added to boundary states. tion accuracies for user interventions, acci ∈ [0%, 100%]Session 1 Session 2 Session 3 Session 4 Session 5 Session 6Session 7Session 8 Session 9 Session 10
1 1
0.04 0.04
0.8 0.8
0.03 0.03
bels(tk)
0.6 0.6
belf(tk)
trust
trust
0.02 belf(tk) 0.02
0.4 0.4
bels(tk) fk
0.2 0.01 0.2 0.01
fk MLE pred. fk / ik / ck
0 0 0 0
1 1
pk
pk
0 0
1 1
ek
ek
0 0
1 1
ik
ik
0 0
1 1
ck
ck
0 0
−1 −1
(a) training set sessions (b) test set sessions
Figure 4: Inferences and predictions for a typical trained OPTIMo instance (W = 3.0 s, B = 300 bins, σf = 0.1).
accuracies for trust change predictions accc , and the root- more, the visualization of the inferred trust beliefs highlights
mean-squared-error for absolute trust feedback, RM SEf . OPTIMo’s unique ability in characterizing multi-modal dis-
We also compute the Pearson product-moment correlation tributions for the user’s temporal trust states. These com-
coefficient ρ between matching sets of observed and pre- peting trust hypotheses arise when the human’s actions con-
dicted trust feedback fk . This metric is used to compare tradict recent trust reports, or when the user’s reactions are
OPTIMo against other models that quantify trust on a dif- notably different from prior interaction experiences.
ferent scale. All evaluation metrics presented in this section This OPTIMo instance is personalized through trust prop-
(except Sec. 5.1) are aggregated across all 21 users’ results. agation settings ωtb = 0.0064, ωtp = −0.0153, ωtd = −0.0029,
A few of OPTIMo’s settings cannot be optimized using cause-of-intervention weights ωib = 131.2, ωit = −157.1,
interaction experiences, yet they affect the model’s perfor- ωid = −9887, ωie = 83.84, and trust changes reporting traits
mance. The window duration W determines the time scale oc = 0.0003, κc = 1277, βc = 1.063 × 10⁻⁷ . These set-
of interaction, and also reflects the trust inference latency tings optimize the joint likelihood of all interaction factors
for online model queries. The number of histogram bins B in the training set, and can also be interpreted to quantify
affects the precision of the discrete approximation to the un- the user’s trust tendencies. Specifically, the large cause-of-
derlying continuous trust beliefs. Finally, the uncertainty σf intervention weights suggest that this operator does not in-
in each user’s trust feedback fk captures the relative influ- tervene at a maximal trusting state, but will most certainly
ence of fk on the inferred beliefs for latent trust tk . Sec. 5.2 take over control for medium-to-low trust states (tk < 0.8),
will investigate the effects of each of these non-trainable pa- when trust drops by even 0.004, or to address extraneous fac-
rameters on the resulting models’ performance. tors such as intentional changes to the task target (ek = 1).
Also, the trust propagation settings indicate that between
5.1 Characteristics of a Trained Model consecutive time steps (of W = 3 s), the user’s trust state in-
We begin by highlighting several features of a typical per- creases nominally by 0.0064 if the task performance is good,
sonalized OPTIMo instance under sensible settings: W = drops by 0.0118 initially upon an AI failure, and continues
3.0 s, B = 300 bins, σf = 0.1. Fig. 4(a) depicts the Bayesian- to decrease by 0.0089 throughout a contiguous period of fail-
smoothed trust beliefs bels (tk ) during the training sessions, ures. We deduce that this operator penalizes robot failures
after model parameters Θ have been optimized to best match with 38% more trust loss, when compared to trust gains
the training dataset. Fig. 4(b) shows the Bayesian-filtered during competent operations. This quantifies the common
beliefs belf (t) inferred during the test sessions, as well as adage that “it is easy to lose trust, but hard to regain it”.
MLE predictions (blue circles) for trust feedback fk , user
interventions ik , and trust change reports ck . The switch to 5.2 Effects of Non-Trainable Parameters
filtered trust beliefs ensures that model evaluation is carried Fig. 5(a) illustrates the effects of the time window dura-
out in an online manner, as if predictions were obtained live tion W on OPTIMo’s performance. The prediction errors for
during the latter 5 sessions. trust feedback, RM SEf , consistently decrease as the win-
The inferred trust beliefs, depicted as vertical color-coded dow duration widens. This trend arises due to having more
slices in Fig. 4, reflect a precise characterization of this spe- frequent fk observations at coarser time scales, which allows
cific user’s trust tendencies. This can be seen from accurate the trained model to more accurately predict fk using beliefs
prediction results for various evidence factors in the test set: for latent trust tk . In contrast, prediction accuracies for ik
RM SEf = 0.09, acci = 72.41%, accc = 70.00%. Also, de- and ck drop slightly as W increases from 0.5 s to 20 s, since
spite the small number of trust feedback (e.g. 5 in each of occurrences of per-frame i and per-report c values are col-
the training and test sets), test-set predictions of fk yielded lapsed into fewer window-aggregated factors at coarser time
highly significant correlations ρ = 0.91 (p < 0.01). Further- scales. The high prediction accuracies at session-level timeAvg prediction accuracies acci / accc
Avg prediction accuracies acci / accc
0.9 1 0.26 1
RMSEf
Avg prediction error RMSEf
Avg prediction error RMSEf
0.8 0.9 0.24
acci RMSEf 0.9
0.7 0.8
accc 0.22 acci
0.6 0.7 0.8
0.2 accc
0.5 0.6
0.18 0.7
0.4 0.5
0.3 0.4 0.16
0.6
0.2 0.3 0.14
0.1 0.2 0.12 0.5
0.5s 1s 2s 3s 6s 10s 20s 40s 75s 150s 0 100 200 300 400 500 600 700 800 900 1000
Window duration W (on log10 scale) (B=300 bins, σf=0.1) Number of histogram bins B (W=3.0s, σf=0.1)
(a) time window duration W (b) number of histogram bins B
Figure 5: Effects of non-trainable model parameters on the prediction performance of OPTIMo.
scales of W = 150 s is similarly explained by statistical de- and the Area Under Trust Curve (AUTC) metric [2]. We
generacy caused by very few samples of ik and ck , although personalized two families of OPTIMo variants with B = 300
even in these cases the model yields excellent performance. bins, σf = 0.1, at different time scales, i.e. OP T IM of ine
The opposite effects that W has on predictions for fk , with W = 3 s, and OP T IM ocoarse with W = 150 s.
versus those for ik and ck , supports the contrast between The ARMAV model [7] associates trustworthiness in an
absolute trust assessments for summarizing cumulative ex- automated software system as a linear function of its task
periences, and the reactive natures of user interventions and performance and internal failure rate, at the current and last
trust change reports. The fact that our results capture this time steps. We implemented three variants of this first-order
contrast demonstrates OPTIMo’s versatility. Furthermore, lag system, including ARM AVreal , which solely considers
despite having poor RM SEf for sub-second time windows, recent AI failure rates pk , pk−1 , and ARM AVperf , which
e.g. W = 0.5 s, competent prediction accuracies for ik and further adds an external task performance metric, measured
ck reflect the usefulness of OPTIMo’s inferred trust beliefs as the ratio of frames for which the target boundary was
at these extremely fine time scales. This degree of predic- completely out of the robot’s view. This latter variant is
tion responsiveness is unseen in existing trust models, which expected to be more accurate, although it requires a perfor-
operate at much coarser scales of minutes or longer [7, 2, 14]. mance metric that is typically not available for many fami-
Fig. 5(b) shows the effects of using histograms with differ- lies of tasks (and is thus not used by OPTIMo). Both model
ent bin sizes B. Prediction results are varied among small variants were personalized using each user’s data from the
bin sizes (B < 200). These unreliable accuracies are likely 5 training sessions, similar to OPTIMo’s training process.
caused by under-sampling of the underlying continuous trust We further computed a user-aggregated regression variant,
beliefs. For example, the trained model in Sec. 5.1 indicates ARM AVaggr , using both AI failure and external perfor-
that the user’s latent trust tk increases nominally by 0.0064 mance data from all users’ training sessions, to faithfully
between time steps under typical operations; this requires replicate the model form used by the original authors.
at least B > 156 bins to represent faithfully. Beyond these In prior work [14] we derived a similar linear regression
under-sampling errors, our empirical results indicate that model, but for predicting changes in trust before and after a
using many bins does not lead to greater performance. We period of interaction. In addition to linking trust to AI fail-
therefore conclude that a histogram with B = 300 bins sen- ures pk , this dTrust model also relates trust to user interven-
sibly captures beliefs of a typical robotict’s trust dynamics. tions ik , and to the robot’s instantaneous task performance,
In general, it is difficult to estimate the amount of vari- represented as the distance from the ground truth target
ability of a human’s reports on an unmeasurable sentiment trajectory. Since this metric is typically not available during
such as trust. Since we employed a 5-anchors format to elicit online operations, we computed per-user regression variants
trust feedback tk ∈ [0, 1] (see Fig. 2), a conservative estimate that both ignored (dT rustreal ) and included (dT rustgt ) this
of variability is on the scale of consecutive anchor points, e.g. ground truth data. Furthermore, a user-aggregated vari-
σf ≈ 0.1. We trained model instances with varying variabil- ant dT rustaggr incorporates interaction experiences from all
ity values σf , and found that this parameter had minimal users, and best reflects the originally-proposed model form.
effects on OPTIMo’s performance. For instance, under rea- During model evaluation, we computed all predicted trust
sonable settings W = 3 s, B = 300 bins, results assuming ex- changes for the 5 test sessions, and integrated the updated
tremely precise trust feedback (σf = 0.001), acci = 69.43%, trust states starting from the final trust feedback at the end
accc = 51.52%, RM SEf = 0.21, are not noticeably different of the training sessions.
from performance assuming severely unreliable assessments In the experiments conducted by Desai and Yanco [2],
(σf = 0.3), acci = 71.41%, accc = 55.81%, RM SEf = 0.29. users were asked to report their trust changes c ∈ {−1, 0, +1}
at regular intervals through button presses. The cumulative
5.3 Comparison with Existing Trust Models sums of these values were used to characterize trust states at
We contrasted OPTIMo’s trust prediction performance different times, and is termed the Area Under Trust Curve
against those of several existing models. These include the (AUTC) metric. We computed AUTC values at the end
Auto-Regressive Moving Average Value (ARMAV) model of each test session, and compared Pearson’s ρ correlations
for quantifying human-automation trust [7], a stepwise re- between these unscaled predictions and trust feedback fk .
gression model for predicting changes in trust (dTrust) [14], Table 1 summarizes RMSE and Pearson’s ρ statistics fortrained models to predict trust states of novel users, while
Table 1: Model comparison of trust prediction er- requiring minimal amounts of personalization data. We are
rors and Pearson’s ρ. Dark & light shades highlight also investigating the use of Monte Carlo approximate in-
best and second best results for each metric. Statis- ference techniques, with the aim of further speeding up the
tics for personalized models were across all users. trust inference process. Finally, we have begun integrat-
avg (std) % sign ρ avg (std) avg
RM SE (α < 0.10) sign RM SE sign ρ ing OPTIMo with our interactive robot behavior adapta-
OP T IM of ine 0.13 (0.12) 33.33% 0.11 (0.14) 0.88 tion methods [15], towards our research end-goal of building
OP T IM ocoarse 0.10 (0.09) 33.33% 0.09 (0.10) 0.90 robots that can actively seek to maximize the user’s trust.
ARM AVreal [7] 0.32 (0.42) 9.52% 0.52 (0.05) 0.86
ARM AVperf [7] 0.27 (0.21) 9.52% 0.12 (0.04) 0.85
ARM AVaggr [7] 0.14 — — 0.64 7. ACKNOWLEDGMENTS
dT rustreal [14] 0.76 (1.68) 9.52% 0.17 (0.10) 0.92 We would like to thank all participants of our observa-
dT rustgt [14] 0.36 (0.32) 14.29% 0.17 (0.07) 0.93 tional study, which was sanctioned by McGill University’s
dT rustaggr [14] 0.19 — — 0.73
AU T C [2] — 38.10% — 0.90 Research Ethics Board (#183-1112). This work was funded
by the NSERC Canadian Field Robotics Network (NCFRN).
trust predictions for the various models. OPTIMo yielded 8. REFERENCES
prediction accuracies and correlations comparable to the [1] J. A. Cowley and H. Youngblood. Subjective response
best variants of all existing trust models. Focusing on a differences between visual analogue, ordinal and
session-wide scale, OP T IM ocoarse produced notably more hybrid response scales. Proc. of the Human Factors
accurate trust predictions against other models using simi- and Ergonomics Society Annual Meeting, 2009.
lar information, i.e. ARM AVreal , dT rustreal , AU T C. Even [2] M. Desai. Modeling Trust to Improve Human-Robot
when other models incorporated additional sources of data, Interaction. PhD thesis, Computer Science
OPTIMo’s performance remained competitive. Department, University of Massachusetts Lowell, 2012.
Our approach is able to infer the user’s dynamic trust [3] R. J. Hall. Trusting your assistant. In
state with greater fidelity than existing methods, and at Knowledge-Based Soft. Eng. Conf. (KBSE’11), 1996.
much finer time scales on the order of seconds. This is [4] J.-Y. Jian, A. M. Bisantz, and C. G. Drury.
achieved by relating the user’s latent trust state to observed Foundations for an empirically determined scale of
factors of the interaction experience. OPTIMo’s use of a trust in automated systems. Cog. Ergonomics, 2000.
probabilistic trust representation captures additional state
[5] A. Jøsang, R. Hayward, and S. Pope. Trust network
information, such as multi-modal hypotheses and the un-
analysis with subjective logic. In Australasian Comp.
certainty in trust estimates. The fact that trained OP-
Sci. Conf. (ACSC’06), pages 85–94, 2006.
TIMo instances accurately predict trust-induced behaviors
[6] D. Koller and N. Friedman. Probabilistic Graphical
and attitudes in near real-time, without requiring users to te-
Models: Principles and Techniques. MIT Press, 2009.
diously provide trust feedback every few seconds, highlights
the unique value of this online human-robot trust model. [7] J. Lee and N. Moray. Trust, control strategies and
allocation of function in human-machine systems.
Ergonomics, 35(10):1243–1270, 1992.
6. CONCLUSION [8] J. D. Lee and K. A. See. Trust in automation:
We introduced the Online Probabilistic Trust Inference Designing for appropriate reliance. H. Factors, 2004.
Model (OPTIMo): a personalized performance-centric trust [9] B. M. Muir. Operators’ trust in and use of automatic
model that is capable of inferring a human operator’s de- controllers in a supervisory process control task. PhD
gree of trust in an autonomous robot. OPTIMo incorpo- thesis, University of Toronto, 1989.
rates the two dominant modeling approaches in the litera- [10] A. Pierson and M. Schwager. Adaptive inter-robot
ture, namely through causal reasoning of the robot’s trust- trust for robust multi-robot sensor coverage. In Int.
worthiness given its task performance, and using evidence Sym. on Robotics Research (ISRR’13), 2013.
from interaction data to support beliefs about the human’s [11] C. Pippin and H. I. Christensen. Trust modeling in
latent trust state. We conducted an observational study multi-robot patrolling. In Proc. of the IEEE Int. Conf.
on a large group of roboticists, and collected a substantive on Rob. and Auto. (ICRA’14), 2014.
dataset as well as valuable insights that shaped OPTIMo’s
[12] U.-D. Reips and F. Funke. Interval-level measurement
structure. We demonstrated success at accurately predict-
with visual analogue scales in internet-based research:
ing trust-induced behaviors of human operators while col-
Vas generator. Behavior Research Methods, 2008.
laborating with an autonomous boundary following robot,
although OPTIMo’s generic form can be scaled and instan- [13] A. Xu. 2-Step Temporal Bayesian Networks (2TBN):
tiated to suit other task contexts as well. Our empirical filtering, smoothing, and beyond. Technical Report
analyses extensively quantified the strong performance for TRCIM1030, McGill U., 2014. www.cim.mcgill.ca/
many variants of this human-robot trust model. Our re- ˜anqixu/pub/2TBN.TRCIM1030.pdf.
sults further showed that OPTIMo can predict trust assess- [14] A. Xu and G. Dudek. Towards modeling real-time
ments with greater accuracies and at much finer time scales trust in asymmetric human-robot collaborations. In
compared to existing works. These findings highlight the Int. Sym. on Robotics Research (ISRR’13), 2013.
importance and uniqueness of OPTIMo towards developing [15] A. Xu, A. Kalmbach, and G. Dudek. Adaptive
responsive trust-seeking adaptive robots. Parameter EXploration (APEX): Adaptation of robot
In ongoing work we are studying the use of OPTIMo autonomy from human participation. In Proc. of the
for grouping like-minded operators, which would allow pre- IEEE Int. Conf. on Rob. and Auto. (ICRA’14), 2014.You can also read