Genes with high network connectivity are enriched for disease heritability - bioRxiv
←
→
Page content transcription
If your browser does not render page correctly, please read the page content below
bioRxiv preprint first posted online Oct. 13, 2018; doi: http://dx.doi.org/10.1101/442582. The copyright holder for this preprint
(which was not peer-reviewed) is the author/funder, who has granted bioRxiv a license to display the preprint in perpetuity.
                              It is made available under a CC-BY-NC-ND 4.0 International license.

                   Genes with high network connectivity are enriched for disease

                                                            heritability

       Samuel S. Kim1,2,* , Chengzhen Dai1 , Farhad Hormozdiari2 , Bryce van de Geijn2 , Steven
                   Gazal2 , Yongjin Park1 , Luke O’Connor2,6 , Tiffany Amariuta6 , Po-Ru Loh7 , Hilary
                                                                                                             ∗2,3,5,*
                                Finucane3 , Soumya Raychaudhuri7 , and Alkes L. Price

       1
           Department of Electrical Engineering and Computer Science, Massachusetts Institute of
                                                  Technology, Cambridge, MA
       2
           Department of Epidemiology, Harvard T.H. Chan School of Public Health, Boston, MA
               3
                   Program in Medical and Population Genetics, Broad Institute of MIT and Harvard,
                                                           Cambridge, MA
                        4
                            Department of Computer Science, Harvard University, Cambridge, MA
       5
           Department of Biostatistics, Harvard T.H. Chan School of Public Health, Boston, MA
   6
       Program in Bioinformatics and Integrative Genomics, Harvard University, Cambridge, MA
               7
                   Division of Genetics, Department of Medicine, Brigham and Women’s Hospital and
                                           Harvard Medical School, Boston, MA

           ∗
               Corresponding author: sungil@mit.edu, aprice@hsph.harvard.edu

                                                                       1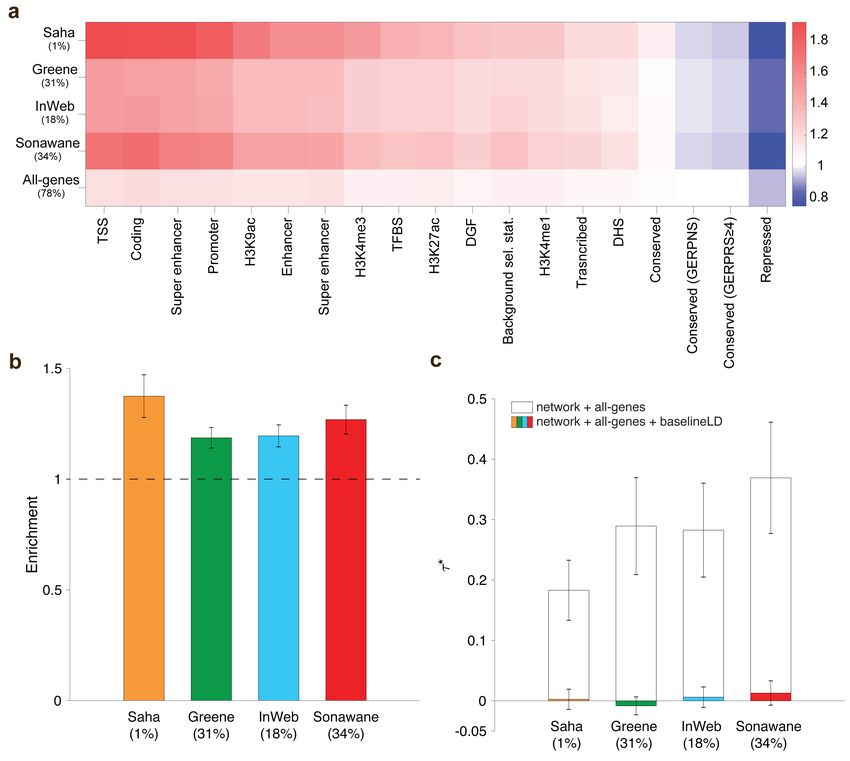
bioRxiv preprint first posted online Oct. 13, 2018; doi: http://dx.doi.org/10.1101/442582. The copyright holder for this preprint
(which was not peer-reviewed) is the author/funder, who has granted bioRxiv a license to display the preprint in perpetuity.
                              It is made available under a CC-BY-NC-ND 4.0 International license.

                                                                                                                                    2

                                                                 Abstract

               Recent studies have highlighted the role of gene networks in disease biology. To formally
           assess this, we constructed a broad set of pathway, network, and pathway+network annotations
           and applied stratified LD score regression to 42 independent diseases and complex traits (average
           N =323K) to identify enriched annotations. First, we constructed annotations from 18,119 bio-
           logical pathways, including 100kb windows around each gene. We identified 156 pathway-trait
           pairs whose disease enrichment was statistically significant (FDR < 5%) after conditioning on
           all genes and on annotations from the baseline-LD model, a stringent step that greatly reduced
           the number of pathways detected; most of the significant pathway-trait pairs were previously
           unreported. Next, for each of four published gene networks, we constructed probabilistic anno-
           tations based on network connectivity using closeness centrality, a measure of how close a gene
           is to other genes in the network. For each gene network, the network connectivity annotation
           was strongly significantly enriched. Surprisingly, the enrichments were fully explained by excess
           overlap between network annotations and regulatory annotations from the baseline-LD model,
           validating the informativeness of the baseline-LD model and emphasizing the importance of
           accounting for regulatory annotations in gene network analyses. Finally, for each of the 156 en-
           riched pathway-trait pairs, for each of the four gene networks, we constructed pathway+network
           annotations by annotating genes with high network connectivity to the input pathway. For each
           gene network, these pathway+network annotations were strongly significantly enriched for the
           corresponding traits. Once again, the enrichments were largely explained by the baseline-LD
           model. In conclusion, gene network connectivity is highly informative for disease architectures,
           but the information in gene networks may be subsumed by regulatory annotations, such that
           accounting for known annotations is critical to robust inference of biological mechanisms.
bioRxiv preprint first posted online Oct. 13, 2018; doi: http://dx.doi.org/10.1101/442582. The copyright holder for this preprint
(which was not peer-reviewed) is the author/funder, who has granted bioRxiv a license to display the preprint in perpetuity.
It is made available under a CC-BY-NC-ND 4.0 International license.
3
Introduction
Human diseases and complex traits are heritable and highly polygenic, potentially involving a large
number of disease genes connected by dense cellular networks (Chen et al., 2008; Barabási et al.,
2011; Menche et al., 2015; Visscher et al., 2017; Boyle et al., 2017). Recent work has employed
several approaches to infer gene interaction networks, including protein-protein interaction networks
(Szklarczyk et al., 2014; Chatr-Aryamontri et al., 2017; Li et al., 2017), tissue-specific co-expression
networks (Greene et al., 2015; Saha et al., 2017), and tissue-specific regulatory networks (Marbach
et al., 2016; Sonawane et al., 2017). An appealing extension of traditional genome-wide association
studies (GWAS) is to identify genes and gene pathways associated with disease by leveraging gene
networks and network connectivity between disease genes (Köhler et al., 2008; Vanunu et al., 2010;
Lee et al., 2011; Califano et al., 2012; Taşan et al., 2015; Greene et al., 2015; Marbach et al.,
2016; Peters et al., 2017; Cowen et al., 2017; Yoon et al., 2018). However, despite considerable
progress on inferring gene interaction networks and applying newly developed methods for network
connectivity-informed GWAS to identify specific genes and gene pathways associated to disease, an
overall assessment and interpretation of the contribution of gene networks to the genetic architecture
of disease has remained elusive. In particular, the extent to which this contribution can be explained
by disease enrichments of known functional annotations (Consortium et al., 2012; Maurano et al.,
2012; Trynka et al., 2013; Kundaje et al., 2015; Finucane et al., 2015; Gazal et al., 2017) is unknown.
Here, we sought to answer three questions. First, what is the contribution of disease-associated
gene pathways (Segrè et al., 2010; Pers et al., 2015; de Leeuw et al., 2015, 2016; Boyle et al., 2017;
Pardiñas et al., 2018; Yoon et al., 2018; Wray et al., 2018; Savage et al., 2018; Zhu and Stephens,
2018; Nagel et al., 2018) to disease heritability, irrespective of network connectivity. Second, what
is the contribution of genes with high network connectivity in known gene networks (Greene et al.,
2015; Saha et al., 2017; Li et al., 2017; Sonawane et al., 2017) to disease heritability. Third, what
is the contribution of genes with high network connectivity to disease-associated gene pathways
to disease heritability. We hypothesized that genes with high network connectivity to disease-
associated gene pathways would be more informative than gene pathways or gene networks alone,
as information in gene networks is orthogonal to information in gene pathways.
To answer these questions, we constructed a broad set of pathway, network, and pathway+networkbioRxiv preprint first posted online Oct. 13, 2018; doi: http://dx.doi.org/10.1101/442582. The copyright holder for this preprint
(which was not peer-reviewed) is the author/funder, who has granted bioRxiv a license to display the preprint in perpetuity.
It is made available under a CC-BY-NC-ND 4.0 International license.
4
annotations. The pathway annotations were constructed from known gene pathways by including
100kb windows around each gene; the network annotations were constructed by quantifying network
connectivity using closeness centrality, a measure of how close a gene is to other genes in the net-
work (Boyle et al., 2018; Li et al., 2018); and the pathway+network annotations were constructed
by annotating genes with high network connectivity to the input pathway, again quantified using
closeness centrality. We applied stratified LD score regression (Finucane et al., 2015; Gazal et al.,
2017) to quantify the contribution of the pathway, network, and pathway+network annotations
to disease heritability. We conditioned our analyses on all genes and on the baseline-LD model,
which includes a broad set of coding, conserved, regulatory and LD-related annotations (Gazal
et al., 2017). In each case, we compared results before and after conditioning on the baseline-LD
model, to assess the extent to which the disease enrichments that we identified could be explained
by known functional annotations.bioRxiv preprint first posted online Oct. 13, 2018; doi: http://dx.doi.org/10.1101/442582. The copyright holder for this preprint
(which was not peer-reviewed) is the author/funder, who has granted bioRxiv a license to display the preprint in perpetuity.
It is made available under a CC-BY-NC-ND 4.0 International license.
5
Results
Overview of methods
We provide an overview of the methods and data used in our three main analyses, in which we
assessed the enrichment of disease/trait heritability in pathway, network, and pathway+network
based genomic annotations, respectively. First, in our pathway analyses, we considered 18,119
sets of protein-coding genes from five sources: 2,118 biological pathways from the BioSystem (BS)
database (Geer et al., 2010), 1,927 biological pathways from the Pathway Commons (PC) database
(Cerami et al., 2011), 7,209 protein-protein interaction gene sets from the InWeb database (Li et al.,
2017), 3,903 mouse phenotype gene sets from the Mouse Genome Informatics (MGI) database (Ep-
pig et al., 2014) (i.e. sets of genes whose orthologs are associated to mouse phenotypes), and 2,961
gene ontology gene sets from the Genome Ontology (GO) database (Ashburner et al., 2000) (see
Methods). We refer to these 18,119 gene sets as “pathways.” We restricted to pathways with 10-
500 genes, as in previous pathway enrichment studies (Pers et al., 2015; Zhu and Stephens, 2018).
The complete list of pathways is provided in Table S1, and a histogram of the number of genes in
pathways from each of the five sources is provided in Figure S1. We applied stratified LD score
regression (S-LDSC) (Finucane et al., 2015; Gazal et al., 2017) to binary pathway annotations con-
structed using ±100kb windows around each gene, as in previous work (Finucane et al., 2018; Zhu
and Stephens, 2018). We analyzed publicly available GWAS summary statistics from 42 indepen-
dent diseases and complex traits, including 30 UK Biobank traits (see URLs and Table S2; average
N = 323K) to evaluate the contribution of each pathway annotation to disease/trait heritability.
We conditioned on the 75 functional annotations from the baseline-LD model (Gazal et al., 2017)
(which includes a broad set of coding, conserved, regulatory and LD-related annotations), as well
as an all-genes annotation representing the set of all 23,987 protein-coding genes (±100kb). For
each of 760,869 pathway-trait pairs (roughly 18,119 pathways x 42 traits; see Methods), we assessed
the statistical significance of the pathway annotations standardized effect size τ ∗ (defined as the
proportionate change in per-SNP heritability associated to a one standard deviation increase in
the value of the annotation, conditioned on other annotations included in the model (Gazal et al.,
2017)) based on global false discovery rate (FDR) < 5%; we also computed the enrichment, de-
fined as the proportion of heritability divided by the proportion of SNPs. Unlike enrichment, τ ∗bioRxiv preprint first posted online Oct. 13, 2018; doi: http://dx.doi.org/10.1101/442582. The copyright holder for this preprint
(which was not peer-reviewed) is the author/funder, who has granted bioRxiv a license to display the preprint in perpetuity.
It is made available under a CC-BY-NC-ND 4.0 International license.
6
quantifies effects that are unique to the focal annotation (see Methods).
Second, in our network analyses, we considered four gene networks: two co-expression networks
(Saha (Saha et al., 2017) and Greene (Greene et al., 2015)), one protein-protein interaction network
(InWeb (Li et al., 2017)), and one regulatory network (Sonawane (Sonawane et al., 2017)). A gene
network is defined by an edge weight (which we normalized to lie between 0 and 1) for each pair
of genes, representing their connectivity in the network; we note that the Sonawane regulatory
network contains nonzero edge weights only for pairs of genes in which at least one of the genes is a
known transcription factor. We further note that the Greene, Saha and Sonawane networks include
tissue-specific networks for 144, 18 and 38 tissues, respectively; the choice of which tissue-specific
network to use for each disease/trait is described below (see Enrichment of disease heritability in
network annotations). For each network analyzed, we computed the closeness centrality (Özgür
et al., 2008) for each protein-coding gene (a measure of network connectivity, i.e. how connected
the gene is to other protein-coding genes in the network) and constructed a probabilistic annotation
by linearly transforming connectivity values to lie between 0 to 1 and including ±100kb windows as
above; we also considered other connectivity metrics (see Methods). For each of 168 network-trait
pairs (4 networks x 42 traits), we applied S-LDSC and assessed the statistical significance of the
network annotations τ ∗ conditioned on other annotations; we also computed the enrichment, which
naturally extends to probabilistic annotations (Hormozdiari et al., 2018).
Third, in our pathway+network analyses, we considered 156 significant pathway-trait pairs
(from our pathway analyses) and four gene networks. For each input pathway and each input
network, we defined a set of candidate genes based on the genes in the input pathway and their
one-degree neighbors in the input network; defined a subnetwork by restricting the input network
to this set of candidate genes; computed the closeness centrality (Özgür et al., 2008) for each
candidate gene in that subnetwork; and constructed a probabilistic annotation by linearly trans-
forming connectivity values to lie between 0 to 1 and including ±100kb windows as above. For
each of 590 (pathway-trait,network) pairs (122 pathway-trait pairs for Saha + 156 pathway-trait
pairs x 3 other networks; see Methods), we applied S-LDSC and assessed the statistical significance
of the pathway+network annotations τ ∗ conditioned on other annotations; we also computed the
enrichment.
We have publicly released all pathway, network and pathway+network annotations, LD scores,bioRxiv preprint first posted online Oct. 13, 2018; doi: http://dx.doi.org/10.1101/442582. The copyright holder for this preprint
(which was not peer-reviewed) is the author/funder, who has granted bioRxiv a license to display the preprint in perpetuity.
It is made available under a CC-BY-NC-ND 4.0 International license.
7
and S-LDSC results (see URLs).
Enrichment of disease heritability in pathway annotations
We sought to identify pathways that are enriched for disease heritability. We applied S-LDSC to
760,869 pathway-trait pairs, spanning 18,119 pathways from five sources (Table S1 and Figure S1)
and 42 independent diseases and complex traits, including 30 UK Biobank traits (average N =
323K; Table S2). We identified 156 pathway-trait pairs (spanning 141 pathways and 34 traits)
that were significantly enriched after conditioning on the baseline-LD model and the all-genes
annotation (FDRbioRxiv preprint first posted online Oct. 13, 2018; doi: http://dx.doi.org/10.1101/442582. The copyright holder for this preprint
(which was not peer-reviewed) is the author/funder, who has granted bioRxiv a license to display the preprint in perpetuity.
It is made available under a CC-BY-NC-ND 4.0 International license.
8
Figure 1. Enriched pathways for three representative traits For (a) Crohns disease, (b) rheumatoid
arthritis and (c) schizophrenia, we report the proportion of heritability explained and proportion of SNPs
for each of 18,119 pathways analyzed. Red points indicate significantly enriched pathways (FDR < 5%), and
grey points indicate non-significant pathways. Numerical results for all 42 diseases and complex traits are
reported in Table S3.
Our results include 8 pathway-trait pairs reported in previous genetic studies (see Table 1 and
Table S4). These include “immune response” for both Crohn’s disease and ulcerative colitis (Jostins
et al., 2012); “T-cell receptor”, “cytokine-mediated signaling pathway”, and “abnormal T-cell phys-
iology” for rheumatoid arthritis (Okada et al., 2014); and “Absent corpus callosum” for years of
education (Okbay et al., 2016). In addition, “melanin biosynthetic process” was overwhelmingly
enriched for skin color (Table 1), consistent with the fact that genetic variants in constituent genes
are strongly associated with skin pigmentation (e.g. MC1R) and other pigmentation traits (e.g.
TYR, OCA2, SLC45A2 ) (Low and Chen, 2011; Simeonov et al., 2013).bioRxiv preprint first posted online Oct. 13, 2018; doi: http://dx.doi.org/10.1101/442582. The copyright holder for this preprint
(which was not peer-reviewed) is the author/funder, who has granted bioRxiv a license to display the preprint in perpetuity.
It is made available under a CC-BY-NC-ND 4.0 International license.
9
Trait Top enriched pathway Database #Genes Enr. (s.e.) τ∗ (s.e.)
Age at menarche SIX homeobox 6 InWeb 11 3.06 (0.45) 0.06 (0.02)
Auto immune traits Mismatch repair directed by MSH2:MSH6 BS 14 8.53 (2.05) 0.28 (0.07)
BMI Positive regulation of synapse maturation GO 11 3.34 (0.25) 0.07 (0.01)
Dermatologic diseases Aldo-keto reductase family 1 member E2 InWeb 12 7.51 (1.80) 0.19 (0.05)
Eczema Th17 cell differentiation BS 102 9.01 (1.56) 0.64 (0.15)
Eosinophil count Jak-STAT signaling pathway BS 152 7.67 (1.11) 0.46 (0.11)
Forced vital capacity Absent acrosome MGI 11 2.21 (0.31) 0.04 (0.01)
Heel T Score Skeletal system development GO 142 4.43 (0.60) 0.31 (0.07)
Height Abnormal trabecular bone morphology MGI 172 2.93 (0.39) 0.20 (0.05)
Hypothyroidism Cytokine-mediated signaling pathway GO 235 4.88 (0.78) 0.42 (0.11)
Morning person N-acetylglucosamine metabolic process GO 13 2.07 (0.26) 0.03 (0.01)
Neuroticism HSF1 activation BS 11 2.54 (0.27) 0.04 (0.01)
Platelet count Platelet activation GO 208 4.32 (0.62) 0.30 (0.09)
Red blood cell count Exogenous drug catabolic process GO 10 3.62 (0.63) 0.08 (0.02)
Red blood cell distribution width Decreased erythrocyte cell number MGI 206 4.61 (0.74) 0.39 (0.11)
Respiratory/ear-nose-throat diseases Abnormal T cell activation MGI 108 4.28 (0.75) 0.26 (0.07)
Skin color Melanin biosynthetic process GO 11 192.14 (55.37) 5.90 (1.73)
Smoking status Fibromodulin InWeb 17 2.53 (0.48) 0.06 (0.02)
Systolic blood pressure cGMP-PKG signaling pathway BS 164 3.41 (0.49) 0.25 (0.07)
Type 2 diabetes Glucuronidation BS 30 2.74 (0.32) 0.06 (0.01)
Waist-hip ratio Negative regulation of transcription GO 496 2.60 (0.22) 0.19 (0.05)
White blood cell count ERK cascade PC 15 4.65 (0.69) 0.11 (0.03)
Years of education Absent corpus callosum MGI 45 2.50 (0.33) 0.08 (0.02)
Age first birth Receptor signaling protein tyrosine kinase GO 10 3.62 (0.58) 0.10 (0.02)
Anorexia Activation of the AP-1 family of TF BS 10 5.64 (1.04) 0.15 (0.03)
Autism spectrum GABA-A receptor activity GO 15 4.01 (0.73) 0.12 (0.02)
Coronary artery disease Sodium-independent organic anion transport GO 12 7.05 (1.49) 0.22 (0.04)
Crohn’s disease Cytokine-cytokine receptor interaction BS 266 7.59 (1.50) 0.65 (0.18)
Depressive symptoms Glycoprotein metabolic process GO 12 5.22 (1.10) 0.15 (0.04)
LDL Increased erythroblast number MGI 21 5.63 (1.15) 0.18 (0.05)
Number children even born Lipoxygenase pathway GO 12 9.81 (1.59) 0.27 (0.04)
Rheumatoid arthritis Par-6 family cell polarity regulator beta InWeb 16 4.31 (1.01) 0.17 (0.04)
Schizophrenia Trigeminal neuroma MGI 10 2.39 (0.31) 0.03 (0.01)
Ulcerative colitis FGFR2b ligand binding and activation BS 10 8.00 (1.97) 0.18 (0.05)
Table 1. Top enriched pathway for each trait. We report the top enriched pathway (most significant
τ ∗ ) for each of 34 traits with at least one significantly enriched pathway. The first 23 traits (above the line)
are UK Biobank traits. Enrichment of the melanin biosynthetic process pathway for skin color is consistent
with previous studies (Low and Chen, 2011; Simeonov et al., 2013), and enrichment of the Absent corpus
callosum pathway for years of education was reported in a previous genetic study (Okbay et al., 2016). The
complete set of 156 significant pathway-trait pairs is reported in Table S4.
Surprisingly, most pathway-trait pairs reported in recent studies (Boyle et al., 2017; Pardiñas
et al., 2018; Wray et al., 2018; Savage et al., 2018; Zhu and Stephens, 2018; Nagel et al., 2018) using
genome-wide polygenic methods (de Leeuw et al., 2015; Finucane et al., 2015; Zhu and Stephens,
2018) were not significant in our analysis. Specifically, we considered 95 significant pathway-trait
pairs for the 6 traits (schizophrenia, Crohn’s disease, rheumatoid arthritis, neuroticism, intelligence,
depressive symptoms), analyzed in five previous studies (Boyle et al., 2017; Pardiñas et al., 2018;
Wray et al., 2018; Savage et al., 2018; Nagel et al., 2018), restricting to at most the top 20 pathways
per trait per study. Only 15/95 pathway-trait pairs were significant in our primary analysis, after
conditioning on the baseline-LD model and all-genes annotation (Table S7A). However, 67/95 were
significant when we repeated the S-LDSC analysis conditioning on just the all-genes annotationbioRxiv preprint first posted online Oct. 13, 2018; doi: http://dx.doi.org/10.1101/442582. The copyright holder for this preprint
(which was not peer-reviewed) is the author/funder, who has granted bioRxiv a license to display the preprint in perpetuity.
It is made available under a CC-BY-NC-ND 4.0 International license.
10
and not the baseline-LD model (Table S7B). We obtained similar results for a recent unpublished
study (Zhu and Stephens, 2018) (Table S7A-B). Enriched pathways that were fully explained by the
baseline-LD model are likely due to factors that do not play a direct role in trait biology (de Leeuw
et al., 2018). Thus, it is critical to account for known functional annotations in pathway analyses
to correct for such factors.
Our results also highlight pathway-trait pairs that have not previously been reported but are
consistent with known biology. These include ”GABA-A receptor activity” with autism (Table 1),
consistent with the finding that the brains of subjects with autism have altered expression of GABA
receptors (Fatemi et al., 2009; Cellot and Cherubini, 2014); ”Oncostatin M (OSM)” for ulcerative
colitis (Table S4), consistent with the finding that inflamed intestinal tissues from patients with
inflammatory bowel diseases contained higher expression of OSM, and OSM-deficient mice displayed
significantly attenuated colitis (West et al., 2017); and ”zinc influx into cells by the SLC39 gene
family” with schizophrenia (Table S4), consistent with the finding that SLC39A12A expression in
dorsolateral prefrontal cortex is associated with schizophrenia (Scarr et al., 2016; Takagishi et al.,
2017).
We also analyzed three additional gene sets (distinct from the 18,119 pathways) reflecting genes
under strong selection: ExAC (Lek et al., 2016) (genes strongly depleted for protein-truncating
variants), Cassa (Cassa et al., 2017) (genes with strong selection against protein-truncating vari-
ants), and Samocha (Samocha et al., 2014) (genes strongly depleted for missense mutations), which
were previously shown to be enriched for heritability in a meta-analysis across traits (Hormozdi-
ari et al., 2018). We identified 13 significantly enriched gene set-trait pairs (7 for ExAC, 2 for
Cassa, and 4 for Samocha) spanning 9 traits, after conditioning on the baseline-LD model and the
all-genes annotation (FDR < 5% for positive τ ∗ ; Table S8). In a meta-analysis of these 13 gene
set-trait pairs, both the enrichment (1.57, s.e. = 0.053; P = 7.52e-33) and τ ∗ (0.13, s.e. = 0.0090;
P=3.30e-48) were highly statistically significant (Table S6).
Enrichment of disease heritability in network annotations
We sought to assess the hypothesis that genes with high network connectivity are enriched for
disease heritability. We constructed probabilistic annotations based on closeness centrality for each
of the Saha, Greene, InWeb, and Sonawane networks (Table S9; see Methods). We determinedbioRxiv preprint first posted online Oct. 13, 2018; doi: http://dx.doi.org/10.1101/442582. The copyright holder for this preprint
(which was not peer-reviewed) is the author/funder, who has granted bioRxiv a license to display the preprint in perpetuity.
It is made available under a CC-BY-NC-ND 4.0 International license.
11
that closeness centrality was independent of gene size (r = −0.015-0.019) and exon proportion
(r = −0.18-0.008; Figure S2). For the three networks that include tissue-specific networks, we
selected the Saha-skin(sun exposed lower leg), Greene-thyroid and Sonawane-testis networks for
our primary analyses, as these tissue-specific networks maximized the correlation of the resulting
network annotations with H3K27ac (Table S10; see below). We note that different tissue-specific
networks from the same source were only weakly correlated (r = 0.027-0.076 for Saha, 0.17-0.21
for Greene, 0.062-0.24 for Sonawane; Table S10).
We computed the excess overlap between each of the four network annotations and representa-
tive annotations from the baseline-LD model and determined that each of the network annotations
had substantial excess overlap with regulatory annotations (e.g. 1.23-1.36 with H3K27ac, 1.35-1.66
with H3K9ac; Figure 2a and Table S11), substantially stronger than the excess overlap between
the all-genes annotation and regulatory annotations (e.g. 1.11 with H3K27ac, 1.14 with H3K9ac;
Figure 2a); this implies that, for each network, genes with high connectivity to other genes in the
network are enriched for the presence of nearby regulatory marks, perhaps because they are regu-
lated by many other genes. Correlations between these annotations produced similar conclusions
(Table S12; larger correlation for H3K27ac than H3K9ac), although we consider excess overlap to
be a more robust metric because the size of the network annotations varies from 1%-34% of SNPs.
We also report excess overlap and correlations between baseline-LD model annotations in Table
S13.bioRxiv preprint first posted online Oct. 13, 2018; doi: http://dx.doi.org/10.1101/442582. The copyright holder for this preprint
(which was not peer-reviewed) is the author/funder, who has granted bioRxiv a license to display the preprint in perpetuity.
It is made available under a CC-BY-NC-ND 4.0 International license.
12
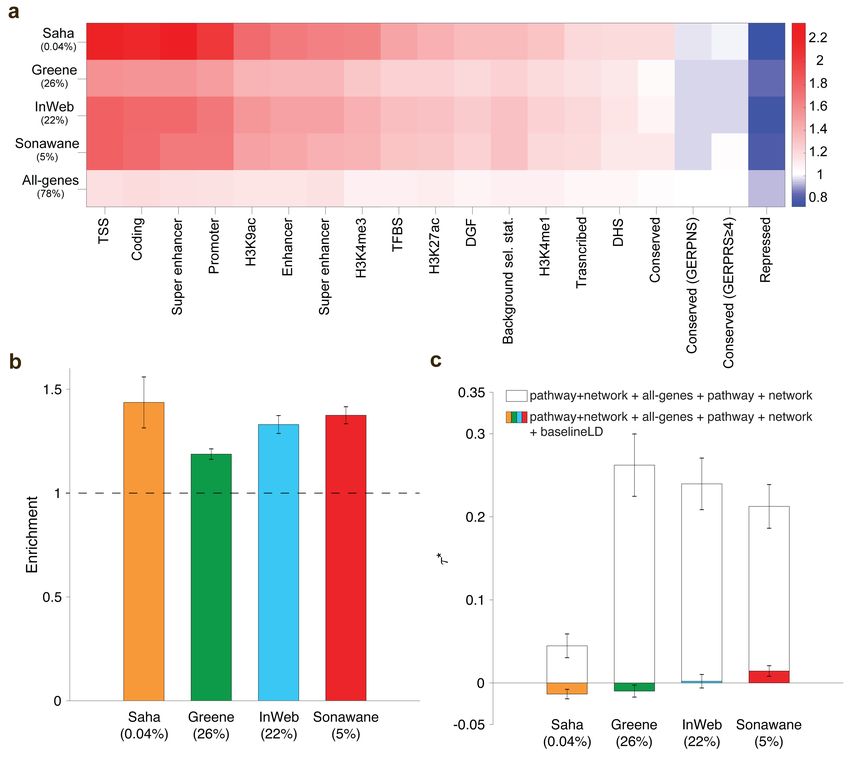
Figure 2. Heritability enrichment of network annotations. We report (a) excess (fold) overlap
between network annotations and baseline-LD functional categories; (b) heritability enrichment of network
annotations, meta-analyzed across 42 independent traits; and (c) τ ∗ values of network annotations, con-
ditioned on either just the all-genes annotation, or the all-genes annotation and the baseline-LD model,
meta-analyzed across 42 independent traits. In (b) and (c), the percentage under each bar indicates the
proportion of SNPs in each annotation (defined for probabilistic annotations as the average value of the
annotation), and error bars represent 95% confidence intervals. Numerical results for (a) are reported in
Table S11, and numerical results for (b) and (c) are reported in Table S14.
For each of the four network annotations, we applied S-LDSC to the 42 independent diseases
and complex traits, conditioning on the baseline-LD model and the all-genes annotation, and meta-
analyzed the results across traits using random-effects meta-analysis. We identified strongly sig-
nificant enrichments for each network annotation: 1.19 (s.e. = 0.024; P = 2.5e-30) to 1.37 (s.e.
= 0.049; P = 1.6e-17) (Figure 2b and Table S14). However, estimates of τ ∗ , quantifying effectsbioRxiv preprint first posted online Oct. 13, 2018; doi: http://dx.doi.org/10.1101/442582. The copyright holder for this preprint
(which was not peer-reviewed) is the author/funder, who has granted bioRxiv a license to display the preprint in perpetuity.
It is made available under a CC-BY-NC-ND 4.0 International license.
13
unique to the network annotations, were not significant (P = 0.21 to 0.77) (Figure 2c and Table
S14). This implies that the enrichment signal in the network annotations (Figure 2b) is entirely
explained by the excess overlap between the network and baseline-LD model annotations (Figure
2a); accordingly, when we repeated the S-LDSC analysis conditioning only on the all-genes annota-
tion and not on the baseline-LD model, τ ∗ estimates were large and highly significant (Figure 2c).
We repeated the S-LDSC analysis conditional on one annotation from the baseline-LD model at a
time and confirmed that regulatory annotations (including histone marks and transcription factor
binding sites) substantially reduced estimates of τ ∗ (Table S15). On the one hand, these findings
represent a negative result for efforts to improve upon the baseline-LD model. On the other hand,
these findings provide a strong validation of the baseline-LD model, in that the information about
diseases/traits in annotations from other sources that broadly reflect the action of gene regulation
are fully captured by the baseline-LD model.
We performed several secondary analyses. We repeated the S-LDSC analysis for the 3 tissue-
specific networks (Saha, Greene, Sonawane) using the most biologically relevant tissue (as inferred
from heritability enrichment of tissue-specific specifically expressed gene and chromatin annotations
(Finucane et al., 2018)) for 10 blood-related traits (see Table S2 for list of traits and tissues);
we obtained similar results, including significant enrichments for all three tissue-specific networks
(Greene et al., 2015; Saha et al., 2017; Sonawane et al., 2017) but non-significant τ ∗ conditional on
the baseline-LD model (Table S16). We further repeated the S-LDSC analysis for two tissue-specific
networks (Greene et al., 2015; Sonawane et al., 2017) that include brain, for 8 brain-related traits; we
obtained non-significant enrichments and non-significant τ ∗ , conditional on the basline-LD model
(Table S16). We also obtained similar results when we repeated the S-LDSC analysis using six
connectivity metrics other than closeness centrality (see Methods; Table S17), using window sizes
other than 100kb (10kb and 1Mb; Table S18), and constructing network annotations using diffusion
state distance (DSD)-transformed networks (Cao et al., 2013) (Table S19).
Enrichment of disease heritability in integrated pathway+network annotations
We sought to assess the hypothesis that genes with high network connectivity to genes in enriched
pathways are also enriched for disease heritability; these enriched pathways serve as relevant, trait-
specific signals that network analysis often lacks. For each of four networks and 141 enrichedbioRxiv preprint first posted online Oct. 13, 2018; doi: http://dx.doi.org/10.1101/442582. The copyright holder for this preprint
(which was not peer-reviewed) is the author/funder, who has granted bioRxiv a license to display the preprint in perpetuity.
It is made available under a CC-BY-NC-ND 4.0 International license.
14
pathways, we constructed probabilistic pathway+network annotations based on closeness centrality
within the subnetwork consisting of input genes and their one-degree neighbors. As before, for the
three networks that include tissue-specific networks, we selected the Saha-skin(sun exposed lower
leg), Greene-thyroid and Sonawane-testis networks for our primary analyses.
For each network, we computed the excess overlap between the 141 pathway+network annota-
tions and representative annotations from the baseline-LD model and averaged results across the
141 pathways. We observed higher excess overlap with regulatory annotations (e.g. 1.27-1.35 with
H3K27ac, 1.42-1.70 with H3K9ac; Figure 3a and Table S11) than the analogous excess overlaps
for network annotations (Figure 2a); this implies that, for each network, genes with high network
connectivity to genes in input pathways are enriched for the presence of nearby regulatory marks,
perhaps because they are regulated by many other genes. Correlations between network, path-
way+network and baseline-LD model annotations are reported in Table S12. We determined that
pathway+network annotations were often correlated with network annotations, particularly for the
corresponding network (from r = 0.12 for Saha to r = 0.93 for Greene). We further determined
that pathway+network annotations constructed using the Greene, InWeb and Sonawane networks
were moderately correlated (r = 0.27-0.42), whereas pathway+network annotations constructed
using the Saha network were more distinct (r = 0.05-0.06), primarily due to its small annotation
size (Table S12).bioRxiv preprint first posted online Oct. 13, 2018; doi: http://dx.doi.org/10.1101/442582. The copyright holder for this preprint
(which was not peer-reviewed) is the author/funder, who has granted bioRxiv a license to display the preprint in perpetuity.
It is made available under a CC-BY-NC-ND 4.0 International license.
15
Figure 3. Heritability enrichment fof pathway+network annotations. We report (a) excess (fold)
overlap between pathway+network annotations (averaged across up to 156 pathway-trait pairs); (b) heri-
tability enrichment of pathway+network annotations, meta-analyzed across up to 156 pathway-trait pairs;
and (c) τ ∗ values of pathway+network annotations, conditioned on either just the all-genes annotation and
the corresponding pathway and network annotations, or the baseline-LD model as well, meta-analyzed across
up to 156 pathway-trait pairs. In (b) and (c), the percentage under each bar indicates the proportion of SNPs
in each annotation (defined for probabilistic annotations as the average value of the annotation), and error
bars represent 95% confidence intervals. Numerical results for (a) are reported in Table S11, and numerical
results for (b) and (c) are reported in Table S20.
For each of 590 (pathway-trait,network) pairs (122 pathway-trait pairs for Saha + 156 pathway-
trait pairs x 3 other networks; see Methods), we applied S-LDSC to the resulting pathway+network
annotation and the corresponding trait, conditioning on the baseline-LD model, the all-genes an-
notation, and the corresponding pathway and network annotations, and meta-analyzed the resultsbioRxiv preprint first posted online Oct. 13, 2018; doi: http://dx.doi.org/10.1101/442582. The copyright holder for this preprint
(which was not peer-reviewed) is the author/funder, who has granted bioRxiv a license to display the preprint in perpetuity.
It is made available under a CC-BY-NC-ND 4.0 International license.
16
for each network using random-effects meta-analysis. We identified strongly significant enrichments
for all of our pathway+network annotations: 1.19 (s.e. = 0.01; P = 1.5e-49) to 1.44 (s.e. = 0.06; P
= 3.8e-12) (Figure 3b and Table S20). However, estimates of τ ∗ , quantifying effects unique to the
network annotations, were not significant or only weakly significant (P = 0.62 to 4.5e-6) (Figure
3c and Table S20). Once again, this implies that the enrichment signal in the pathway+network
annotations is entirely explained by the excess overlap between the pathway+network and baseline-
LD model annotations; accordingly, when we repeated the S-LDSC analysis conditioning only on
the all-genes annotation and the corresponding pathway and network annotations, and not on the
baseline-LD model, τ ∗ estimates were large and highly significant, except for the Saha network
(Figure 3c). We repeated the S-LDSC analysis conditional on one annotation from the baseline-LD
model at a time, and determined that inclusion of regulatory annotations (including histone marks
and transcription factor binding sites) substantially reduced estimates of τ ∗ (Table S21).
We assessed whether genes in enriched pathways have higher network connectivity than other
genes. For each of the four gene networks, for each of the 141 enriched pathways, we assessed both
the network connectivity within the pathway and the network connectivity between the pathway and
interacting genes (one-degree neighbors) outside the pathway, as compared to 10,000 null pathways
with the same number of genes, each randomly sampled from a randomly chosen pathway from the
full set of 18,119 pathways (see Methods). We assessed network connectivity using the sum of edge
weights between genes. For each network, we averaged results across pathways. We determined
that genes in enriched pathways have higher network connectivity within the pathway (1.43x-7.60x
more edges; Figure 4 and Table S22), but do not necessarily have higher network connectivity with
interacting genes outside the pathway (0.69x-1.56x; Table S22); we note that there is no significant
difference in the number of interacting genes between the 141 enriched pathways and the 10,000
null pathways (Table S22).bioRxiv preprint first posted online Oct. 13, 2018; doi: http://dx.doi.org/10.1101/442582. The copyright holder for this preprint
(which was not peer-reviewed) is the author/funder, who has granted bioRxiv a license to display the preprint in perpetuity.
It is made available under a CC-BY-NC-ND 4.0 International license.
17
Figure 4. Genes in enriched pathways have high network connectivity For each of four networks,
we report the sum of edge weights in the network between genes in the pathway, averaged across 141 enriched
pathways. For comparison purposes, we report the same quantity averaged across 10,000 null pathways with
the same number of genes. Error bars represent 95% confidence intervals (smaller than data points for
null pathways). Numerical results, and analogous results for network connectivity between a pathway and
interacting genes outside the pathway, are reported in Table S22.
We repeated the S-LDSC analysis (Figure 3b-c) using new pathway+network annotations con-
structed using a random-forest classifier, Quack (Li et al., 2018), that identifies new candidate genes
that have similar topological patterns and network centrality metrics as genes in the input pathway.
Because genes in enriched input pathways have high network connectivity (Figure 4), this is closely
related to our primary strategy of defining pathway+network annotations based on genes with high
network connectivity to genes in enriched input pathways. Indeed, Quack annotations were highly
correlated with our main pathway+network annotations (r =0.50-0.67; Table S12), and produced
S-LDSC results similar to our main analysis (Figure 3b-c), including significant enrichments for all
four networks but non-significant τ ∗ conditional on the baseline-LD model (Table S23).bioRxiv preprint first posted online Oct. 13, 2018; doi: http://dx.doi.org/10.1101/442582. The copyright holder for this preprint
(which was not peer-reviewed) is the author/funder, who has granted bioRxiv a license to display the preprint in perpetuity.
It is made available under a CC-BY-NC-ND 4.0 International license.
18
Discussion
We analyzed 42 diseases and complex traits (average N =323K) to show that genes with high
network connectivity are enriched for disease heritability, but that it is critical for gene network and
pathway analyses to account for known functional annotations, such as those from our baseline-LD
model (Gazal et al., 2017). First, in analyses of pathway annotations, we identified 156 pathway-
trait pairs with significant heritability enrichment after conditioning on the baseline-LD model, a
stringent step that caused a majority of pathway-trait pairs reported in recent studies to become
non-significant in our analyses. Second, we determined that network annotations based on closeness
centrality, a measure of network connectivity, are strongly enriched for disease heritability, but
that these enrichments were fully explained by annotations from the baseline-LD model. Third, for
each of the 156 significant pathway-trait pairs, we determined that pathway+network annotations
constructed from genes with network connectivity to the input pathway were strongly enriched
for the corresponding traits, but that once again these enrichments were largely explained by
annotations from the baseline-LD model.
Our findings have important ramifications for studies connecting gene networks and pathways
to disease (Köhler et al., 2008; Vanunu et al., 2010; Segrè et al., 2010; Lee et al., 2011; Califano
et al., 2012; Pers et al., 2015; de Leeuw et al., 2015; Taşan et al., 2015; Greene et al., 2015; de Leeuw
et al., 2016; Marbach et al., 2016; Boyle et al., 2017; Peters et al., 2017; Cowen et al., 2017; Pardiñas
et al., 2018; Yoon et al., 2018; Wray et al., 2018; Savage et al., 2018; Zhu and Stephens, 2018; Nagel
et al., 2018). Specifically, it is important to account for known functional annotations when seeking
to elucidate biological mechanisms. For some methods, such as S-LDSC (Finucane et al., 2015;
Boyle et al., 2017; Pardiñas et al., 2018), it is straightforward to incorporate known functional
annotations such as those from the baseline-LD model (Gazal et al., 2017), and we emphasize the
importance of doing so. For other methods, it is of high interest to investigate how functional
annotations could be incorporated. More generally, it is of broad interest to re-assess previously
reported results while accounting for known functional annotations; for example, this could be
achieved by running S-LDSC both with and without incorporating functional annotations from the
baseline-LD model.
We note several limitations of our work. First, S-LDSC is not well-suited to analysis of annota-bioRxiv preprint first posted online Oct. 13, 2018; doi: http://dx.doi.org/10.1101/442582. The copyright holder for this preprint
(which was not peer-reviewed) is the author/funder, who has granted bioRxiv a license to display the preprint in perpetuity.
It is made available under a CC-BY-NC-ND 4.0 International license.
19
tions spanning a very small proportion of the genome (Finucane et al., 2015) and does not model
sparsity in trait effect sizes, potentially explaining why we did not identify enriched pathways for
8 traits that are less polygenic (O’Connor et al., 2018) (e.g. age at menopause, balding, hair color,
sunburn). Nonetheless, our main results attained high statistical significance. Second, we did not
explicitly compare S-LDSC to other methods. However, previous work suggests that S-LDSC com-
pares favorably to other gene set enrichment methods, both in simulations and in analyses of real
traits (Finucane et al., 2018). Third, interpretation of pathway-trait enrichments is complicated
by the possibility that enrichment signals may be driven by a small number of highly significant
genes (Zhu and Stephens, 2018). Indeed, when we repeated our analyses excluding from each en-
riched pathway all genes harboring genome-wide significant associations from the corresponding
trait (average of 2 genes removed per pathway-trait pair; see Methods), only 53 pathway-trait pairs
remained significant (Table S24). However, we verified that repeating our main pathway+network
analyses using these 53 pathway-trait pairs (excluding genes implicated by GWAS) produced sim-
ilar conclusions (Table S25). Fourth, gene networks may include false-positive interactions, even
after correcting for technical confounding (Parsana et al., 2017; Saha et al., 2017; Boyle et al.,
2018). However, our results are consistent across four published gene networks (Greene et al., 2015;
Saha et al., 2017; Li et al., 2017; Sonawane et al., 2017), suggesting that false-positive interactions
are unlikely to substantially impact our results. Fifth, inferences about components of heritability
can potentially be biased by failure to account for LD-dependent architectures (Speed et al., 2012;
Yang et al., 2015; Gazal et al., 2017; Speed et al., 2017). All of our main analyses used the baseline-
LD mode, which includes 6 LD-related annotations (Gazal et al., 2017). The baseline-LD model
is supported by formal model comparisons using likelihood and polygenic prediction methods, as
well as analyses using a combined model incorporating alternative approaches (Gazal et al., 2018);
however, there can be no guarantee that the baseline-LD model perfectly captures LD-dependent
architectures. Finally, although we identified many significantly enriched pathways, our results
for network and network+pathway annotations represent a negative result for efforts to improve
upon the baseline-LD model (Gazal et al., 2017). On the other hand, our results emphasize the
importance of accounting for known functional annotations in network and pathway analyses.bioRxiv preprint first posted online Oct. 13, 2018; doi: http://dx.doi.org/10.1101/442582. The copyright holder for this preprint
(which was not peer-reviewed) is the author/funder, who has granted bioRxiv a license to display the preprint in perpetuity.
It is made available under a CC-BY-NC-ND 4.0 International license.
20
Methods
Pathway annotations
We considered 18,119 gene sets (pathways) from five sources: 2,118 biological pathways from the
BioSystem (BS) database (Geer et al., 2010) (which includes pathways from BioCyc (Caspi et al.,
2018), Kyoto Encyclopedia of Genes and Genomes (KEGG) (Kanehisa et al., 2017), Pathway Inter-
action Database (PID) (Schaefer et al., 2009), REACTOME (Fabregat et al., 2018), WikiPathways
(Pico et al., 2008)), 1,927 biological pathways from the Pathway Commons (PC) database (Cerami
et al., 2011) (which includes pathways from HumanCyc (Romero et al., 2004), Integrating Network
Objects with Hierarchies (INOH) (Yamamoto et al., 2011), KEGG (Kanehisa et al., 2017), PAN-
THER (Mi and Thomas, 2009), PID (Schaefer et al., 2009), REACTOME (Fabregat et al., 2018),
SMPDB (Jewison et al., 2014), NetPath (Kandasamy et al., 2010)), 7,209 protein-protein interac-
tion gene sets from the InWeb database (Li et al., 2017), 3,903 mouse phenotype gene sets from the
Mouse Genome Informatics (MGI) database (Eppig et al., 2014)(i.e. sets of genes whose orthologs
are associated to mouse phenotypes), and 2,961 gene ontology gene sets from the Genome Ontology
(GO) database (Ashburner et al., 2000). This set of pathways, which contain at least 10 genes and
at most 500 genes (consistent with previous studies (Pers et al., 2015; Zhu and Stephens, 2018),
significantly overlap with mSigDB (Liberzon et al., 2011) and pathways analyzed in a previous
study (Pers et al., 2015).
For each of 18,119 pathways, we constructed a pathway annotation by annotating a value of 1 for
variants around the protein-coding genes in a given pathway (+/- 100kb) and 0 for all other variants.
We applied S-LDSC on 18,119 pathway annotations across 42 independent diseases and complex
traits, conditional on the baseline-LD model (v1.1) (Gazal et al., 2017) and all-genes annotations (a
value of 1 for variants around 23,987 protein-coding genes with a 100kb window). We removed 129
pathway-trait pairs whose annotated SNPs are less than 0.02% of the reference genome (European
samples from the 1000 Genomes Project; see URLs) as S-LDSC is not well-equipped for annotations
that span very small proportion of the genome.
For each of 760,869 pathway-trait pairs, we assessed the statistical significance of the pathway
annotations based on global FDR < 5% on the pathway annotation’s standardized effect size (τ ∗ )
p-value. We note controlling FDR for each trait and for all traits did not make a major difference inbioRxiv preprint first posted online Oct. 13, 2018; doi: http://dx.doi.org/10.1101/442582. The copyright holder for this preprint
(which was not peer-reviewed) is the author/funder, who has granted bioRxiv a license to display the preprint in perpetuity.
It is made available under a CC-BY-NC-ND 4.0 International license.
21
the number of identified enriched pathway-trait pairs. We further note that our choice of two-tailed
test on the significance is conservative, partially attributing to the reduced number of significantly
associated pathway-trait pairs. Among significantly enriched pathway-trait pairs. we calculated
a pairwise correlation for every pair of annotations and retained the more significant pathway for
correlated pathways with r ≥ 0.5 (as in a previous study (Li et al., 2018)). If correlated pathways
were enriched for different traits, we retained both pathways.
For each of 156 significantly enriched pathway-trait pairs, we also constructed pathway annota-
tions excluding genes implicated by GWAS. First, we downloaded all GWAS associations from the
GWAS Catalog (see URLs); we restricted to significant associations (p-value ≤ 5e-8). For each of
the 34 traits, we defined genes implicated by GWAS by including genes mapped to the lead SNP;
if the SNP was intergenic, we included the nearest upstream and downstream genes. (We note
that the nearest gene might not be the correct target gene (Gusev et al., 2016).) Then, for each
of the 156 enriched pathway-trait pairs, we removed trait-specific GWAS significant genes (5% of
the genes, on average across 156 pathway-trait pairs) and rebuilt our pathway annotations with a
100kb window. For pathways significant for multiple traits, we built unique pathway annotations
excluding genes implicated by GWAS for the corresponding traits. For each of 156 pathway-trait
pairs, genes after excluding GWAS significant genes are provided in Table S4.
Network annotations
We downloaded each of four gene networks (Greene et al., 2015; Saha et al., 2017; Li et al., 2017;
Sonawane et al., 2017) and formatted as a two-dimensional matrix with three columns: gene1,
gene2, and interaction score (see URLs). We used ENTREZ ID for the gene identifier, so converted
other gene identifiers provided by the authors as needed. For each network, we constructed seven
different probabilistic annotations based on the following network connectivities (centralities), which
we computed using Graph-tool (see URLs):
Let G be a weighted, undirected graph with a set of vertices (V) and a set of edges (E).
Closeness centrality (v): how close gene v is to all other genes in the network. It is defined as
P
1/ v,v6=w dvw where dvw is the weighted distance from v to w. If there is no path between two
genes, the distance of zero is used.
Degree (v): the number of vertices connected to v; that is the number of neighboring genes for eachbioRxiv preprint first posted online Oct. 13, 2018; doi: http://dx.doi.org/10.1101/442582. The copyright holder for this preprint
(which was not peer-reviewed) is the author/funder, who has granted bioRxiv a license to display the preprint in perpetuity.
It is made available under a CC-BY-NC-ND 4.0 International license.
22
gene in the graph.
Maximum edge weight (v): the maximum of the weights of all edges connected to v.
Sum edge weight (v): the sum of the weights of all edges connected to v.
Betweenneses centrality (v): The number of shortest paths that pass through gene v. It is defined
P
as σuw (v)/σuw where σuw (v) is the number of shortest paths from node u to w that pass through
v, and σuw is the total number of shortest paths from u to w.
Eigenvector centrality (v): Intuitively, the eigencentrality of v is proportional to the sum of the
centralities of its neighbors (Özgür et al., 2008). It is defined as the solution of of Ax = λx, where
x is the eigenvector of the weighted adjacency matrix A with the largest eigenvalue λ.
Pagerank (v): Pagerank is similar to eigenvector centrality, except it contains a damping factor,
the probability that the person who randomly visit genes will continue, under the assumption
that more important genes are more likely to receive more visits. It is defined as (1 − d)/N +
d u∈N (v) P agerank(u)/d+ (u) where d is a damping factor, N (v) are the in-neighbors of v, d+ (u)
P
is the out-degree of u. Because G is an undirected graph, pagerank treats it as a directed graph by
making edges bidirectional.
After computing network connectivities for all protein-coding genes that exist in a network, we
linearly transformed scores to lie between 0 to 1 and annotated variants around genes (+/- 100kb).
When a variant is spanned by multiple genes with the 100kb window, we assigned the maximum
connectivity score.
Pathway + Network annotations
We constructed pathway+network annotations, specific to an input pathway and a gene network.
For each of 141 enriched pathways, we first constructed an adjacency matrix by mapping genes in a
pathway (”core genes”) to a gene network and identifying the set of neighboring genes (”peripheral
genes”), using Graph-tool (see URLs). In the adjacency matrix, a vector represents an ENTREZ
ID of a gene in a pathway, an ENTREZ ID of a neighboring gene, and the interaction score (e.g.
posterior probability of these two genes). Using this adjacency matrix representing a subnetwork
of core and perihpheral genes that appear in the network, we score both core and peripheral genes
based on closeness centrality. We use the inverse of the interaction score as the cost when computing
closeness centrality. Using the set of core and peripheral genes along with the linearly transformedbioRxiv preprint first posted online Oct. 13, 2018; doi: http://dx.doi.org/10.1101/442582. The copyright holder for this preprint
(which was not peer-reviewed) is the author/funder, who has granted bioRxiv a license to display the preprint in perpetuity.
It is made available under a CC-BY-NC-ND 4.0 International license.
23
connectivity scores that lie from 0 to 1, we annotated variants around genes (+/- 100kb). When a
variant is spanned by multiple genes with the 100kb window, we assigned the maximum connectivity
score.
Excess overlap between annotations
We calculated excess fold overlap between two annotations (annot 1 and annot 2) as the fraction of
overlap between the annotations divided by the expected amount of overlap by chance, computed
as the following: excess overlap(annot1, annot2) =
PM
j=1 annot1j∗ annot2j
PM PM
j=1 annot1j ∗ j=1 annot2j
where M is the total number of SNPs (5,961,159). Annotations with no excess overlap are assigned
a value of 1; when there is excess overlap, the excess fold overlap is > 1.
Network connectivity of a pathway
Given a pathway and a network, we quantified how tightly connected the pathway is in the network,
compared to a null pathway. Let P be a set of genes in the pathway that exist in the network. Let
Q be a set of neighboring genes; that is, genes in P are connected with genes in Q with at least one
edge, in the network. We calculated three metrics: (1) size of Q (number of neighboring genes),
(2) sum of edges among genes in P, and (3) sum of edges between genes in P and genes in Q. We
did not consider genes in the pathway that are not coding or do not appear in the network.
For each of 141 enriched pathways, we constructed a corresponding null pathway as follows: (1)
randomly choose a pathway from the full set of 18,119 pathways (Table S1), (2) randomly choose
a gene from the sampled pathway, and (3) repeat (1) and (2) N times, where N is the number of
genes in the pathway. For each of four gene networks analyzed, we repeated this procedure 10,000
times and reported three connectivity metrics of enriched and null pathways (for null, the mean of
10,000 permutations is reported).bioRxiv preprint first posted online Oct. 13, 2018; doi: http://dx.doi.org/10.1101/442582. The copyright holder for this preprint
(which was not peer-reviewed) is the author/funder, who has granted bioRxiv a license to display the preprint in perpetuity.
It is made available under a CC-BY-NC-ND 4.0 International license.
24
Set of 42 independent traits
Analogous to a previous study (Hormozdiari et al., 2018), we considered 89 GWAS summary
association statistics, including 34 traits from publicly available sources and 55 traits from the UK
Biobank (up to N = 459K); summary association statistics were computed using BOLT-LMM v2.3
(Loh et al., 2015, 2018). Among 47 summary statistics with z-scores of total SNP heritability of
at least 6 (computed using S-LDSC with the baseline-LD model), we further removed 5 summary
statistics that have genetic correlation of at least 0.9 (computed using cross-trait LDSC (Bulik-
Sullivan et al., 2015)). Whenever applicable, meta-analysis across 42 independent traits (Table
S2), whose GWAS summarystatistics are publicly available (see URLs), was performed using a
random-effect meta-analysis using the R package rmeta.
Set of 10 blood-related and 8 brain-related traits
We analyzed ten independent blood- and autoimmune-related traits: Crohn’s disease (Jostins et al.,
2012), rheumatoid arthritis (Okada et al., 2014), and ulcerative colitis (Jostins et al., 2012) from
publicly available datasets and eczema, autoimmune diseases. eosinophil count, platelet count,
red blood cell count, white blood cell count, and red blood cell distribution width from the UK
Biobank.
We analyzed eight independent brain-related traits: autism spectrum (of the Psychiatric Ge-
nomics Consortium et al., 2013), depressive symptoms (Okbay et al., 2016), and schizophrenia
(Ripke et al., 2014) from publicly available datasets, and age at menarche, body mass index, neu-
roticism, smoking status, and years of education from the UK Biobank. We selected these traits
from 42 independent traits we analyzed, as inferred from heritability enrichment of tissue-specific
gene expression and chromatin annotations (Finucane et al., 2015, 2018) and eQTL annotations
(Hormozdiari et al., 2018). We additionally considered autism spectrum based on previous studies
(Fatemi et al., 2009; Cellot and Cherubini, 2014) that the brains of subjects with autism have
altered expression.You can also read