From Behavior of Water on Hydrophobic Graphene Surfaces to Ultra-Confinement of Water in Carbon Nanotubes
←
→
Page content transcription
If your browser does not render page correctly, please read the page content below
nanomaterials

Article
From Behavior of Water on Hydrophobic Graphene Surfaces to
Ultra-Confinement of Water in Carbon Nanotubes
Alia Mejri, Guillaume Herlem                   and Fabien Picaud *

                                          Laboratoire de Nanomédecine, Imagerie et Thérapeutiques, EA4662, UFR Sciences et Techniques,
                                          Centre Hospitalier Universitaire et Université de Bourgogne Franche Comté, 16 Route de Gray,
                                          25030 Besançon, France; alia.mejri@univ-fcomte.fr (A.M.); guillaume.herlem@univ-fcomte.fr (G.H.)
                                          * Correspondence: fabien.picaud@univ-fcomte.fr

                                          Abstract: In recent years and with the achievement of nanotechnologies, the development of experi-
                                          ments based on carbon nanotubes has allowed to increase the ionic permeability and/or selectivity
                                          in nanodevices. However, this new technology opens the way to many questionable observations,
                                          to which theoretical work can answer using several approximations. One of them concerns the ap-
                                          pearance of a negative charge on the carbon surface, when the latter is apparently neutral. Using first-
                                          principles density functional theory combined with molecular dynamics, we develop here several
                                          simulations on different systems in order to understand the reactivity of the carbon surface in low or
                                          ultra-high confinement. According to our calculations, there is high affinity of the carbon atom to the
                                          hydrogen ion in every situation, and to a lesser extent for the hydroxyl ion. The latter can only occur
                                          when the first hydrogen attack has been achieved. As a consequence, the functionalization of the
                                          carbon surface in the presence of an aqueous medium is activated by its protonation, then allowing
                                          the reactivity of the anion.

                                   Keywords: quantum simulations; carbon nanotube; graphene; functionalization; confinement
Citation: Mejri, A.; Herlem, G.;
Picaud, F. From Behavior of Water on
Hydrophobic Graphene Surfaces to
Ultra-Confinement of Water in             1. Introduction
Carbon Nanotubes. Nanomaterials
                                               Several curved and flat solid structures such as carbon (CNT) [1–6], boron nitrides
2021, 11, 306. https://doi.org/
                                          (BNNT) and silicon carbide [7,8] nanotubes or surfaces [9,10] (graphene [11–16]) are inter-
10.3390/nano11020306
                                          esting candidates for the design of synthetic nanofluidic platforms. The easy control of
                                          their diameter during the synthesis process can regulate inside liquid flow and transport
Academic Editor: Ana M. Benito
                                          of charges, opening up a wide field of applications in nanomedicine [17–19], biotechnol-
Received: 27 December 2020
Accepted: 21 January 2021
                                          ogy, desalination [20–23] membrane nanofiltration [24,25] nanofluidic devices for energy
Published: 25 January 2021
                                          recovery and conversion [26–32] and water filtration [33]. CNTs are able to reproduce the
                                          biological properties of their counterparts, but with a less complex composition. For in-
Publisher’s Note: MDPI stays neutral
                                          stance, they can notably exhibit chemical selectivity like certain natural nanochannels or
with regard to jurisdictional claims in
                                          transport different species. Many other different properties of bulk fluids could also be
published maps and institutional affil-   observed in such systems due to the surface effect.
iations.                                       Simulations and experiments with water confined inside carbon nanotubes can reveal
                                          unusual physical properties, especially for diffusion behavior and viscosity. These prop-
                                          erties strongly depend on the geometrical characteristics of the CNT (tube diameter and
                                          chirality) and can directly affect water distribution inside the cage leading to unusual
Copyright: © 2021 by the authors.
                                          water performance in a confined space [34–40]. Several studies have shown for CNTs
Licensee MDPI, Basel, Switzerland.
                                          and BNNTs an ordered structure of water molecules essentially related to the metallicity
This article is an open access article
                                          and diameter of the tube. Pascal et al. reported that for armchair CNTs with increased
distributed under the terms and           diameters, water molecules present a bulk-like behavior when the CNT diameter is above
conditions of the Creative Commons        1.4 nm, while an ice-like water framework is characterized for CNT diameters ranging
Attribution (CC BY) license (https://     from 1.1 to 1.2 nm [41]. In a recent theoretical study, molecular dynamic simulations re-
creativecommons.org/licenses/by/          vealed that network formation in the form of a water chain occurred when molecules were
4.0/).                                    successively arranged in CNT with diameters around 1.1 nm [39], which is in accordance

Nanomaterials 2021, 11, 306. https://doi.org/10.3390/nano11020306                                     https://www.mdpi.com/journal/nanomaterials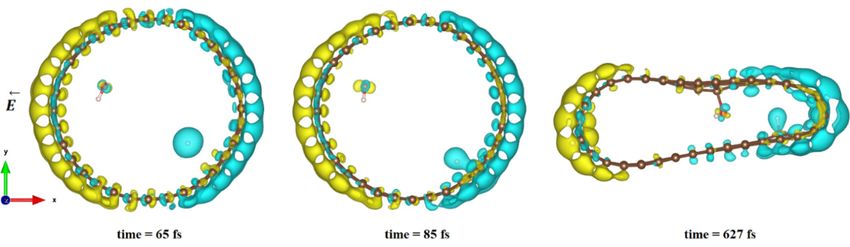
Nanomaterials 2021, 11, 306                                                                                            2 of 17

                              with several previous studies [34,42–44]. Shayeganfar et al. reported, thanks to ab initio
                              computations, that a water tube shape is observed when confined in CNTs and BNNTs.
                              They also confirmed that this tendency of water arrangement depends on the diameter for
                              both situations [45].
                                    Otherwise, numerous experimental and theoretical studies carried out in recent years
                              have shown that a significant surface charge in carbon and BN walls occurs in nanofluidic
                              transport systems [10,46]. It has been established that this surface charge can be much
                              higher for BNNT tubes than for CNTs. A plausible explanation for the appearance of this
                              surface charge has remained puzzling. However, most of the available studies suggest that
                              the adsorption of hydroxide ions on hydrophobic surfaces could explain this phenomenon.
                                    Sirin et al. have shown in an experimental study that the high surface charge measured
                              on a BNNT connecting two reservoirs could be related to the diameter of the tube as well
                              as to the pH of the studied medium. The hypothesis of a chemical reactivity at the surface
                              of BNNT was therefore underlined. On the basis of previous theoretical studies, it has been
                              proposed that a site of “activated” boron could indeed cause the dissociation of water on
                              the BN sheet [47,48]. Note that the carbon structures could also, both on a theoretical and
                              experimental scale, show a particular ionic selectivity according to their diameter and their
                              chirality [49,50], which could explain the specific charges of the carbon walls.
                                    A good understanding of the mechanism governing the transport of fluid inside
                              carbon-based materials, on a theoretical scale, would be an essential step in the develop-
                              ment of new generation devices for a wide field of new industrial applications.
                                    In fact, simulating the behavior of water molecules with respect to nanoporous solids
                              is of great interest to investigate promising materials for smart nanofluidic systems under
                              electric bias [51–54]. Consequently, recourse to computational methods would allow a
                              realistic approach to be established by reproducing an electrochemical system in which
                              the electrolytes are in contact with a solid polarized surface under the effect of an external
                              uniform electric field [3,55,56].
                                    Otani and O. Sugino [57] have developed since 2006 a novel computational scheme
                              that makes it possible to apply an electric bias to the system constituting a slab as occurring
                              with an electrode and an electrolyte solution. The slab represents a bounded polarized or
                              charged interface between two semi-infinite media having a dielectric constant. The method
                              is then called “Effective Screening Medium”. The boundary conditions are given to a model
                              unit cell by solving the Poisson equation allowing the creation of an infinite slab.
                                    The Effective Screening Medium (ESM) method allows, through the coupling of DFT
                              and molecular dynamics, a rigorous study of electrochemical systems. In the present study,
                              two solid structures were tested against dissociated and undissociated water: the zigzag
                              carbon nanotube and the graphene monolayer. Various quantities were then extracted
                              from this study, in particular the adsorption energy of water on the solid surface, the radial
                              distribution density of the confined water as well as the relevant structural observations.

                              2. Materials and Methods
                                    First-principle density functional theory (DFT) calculations were used to investigate
                              the interaction of a dissociated and undissociated water molecule with graphene and the
                              carbon nanotube. The geometry optimization was performed through the “Open source
                              package for Material eXplorer code” (OpenMX) using a combination of molecular dynam-
                              ics, density functional theory and generalized gradient approximation for the exchange-
                              correlation energy proposed by Perdew, Burke and Ernzerhof (GGA-PBE). Pseudopo-
                              tentials and wave functions have also been implemented to reduce the calculation cost.
                              Structural and energetical properties were investigated on the studied systems such as
                              adsorption energy, ground state geometries of system components and electronic density of
                              states (DOS). Differences in charge density calculations were also performed by OpenMX
                              code for the adsorption of dissociated water molecules on CNT and graphene structures.
                              This implies a more rigorous understanding of the spin (charges) density redistribution
                              induced by the interaction of water entities with carbon structures. Although it is frequently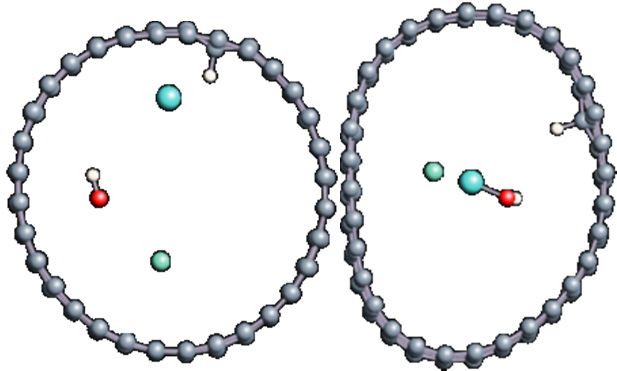
Nanomaterials 2021, 11, 306                                                                                                      3 of 17

                                   used in the description of the electronic structure of a system, DFT based on the generalized
                                   gradient approximation has certain limitations, in particular for the modeling of chemical
                                   reactions [58] and the estimation of gas-phase energy barriers [59]. DFT-GGA may also not
                                   work well for many molecule–metal surface reactions and for van der Waals adsorption on
                                   surfaces [60]. Ab initio molecular dynamics based on density functional theory are more
                                   reliable and accurate in describing molecule–surface interaction, reaction pathways [61],
                                   adsorbate diffusion [62,63] and energy exchange as it permits surface-atom movement and
                                   also includes the temperature effect [64].
                                        The total energy scf convergence criterion for the self-consistent electronic minimiza-
                                   tion is set to 10−6 Hartree/supercell (i.e., 0.27 × 10⁻⁸ eV/Å3 ). Pseudo-atomic orbitals
                                   (PAOs) centered on atomic sites were used as basis sets. The basis sets for C, O, Cl, B and N
                                   were taken as “s2p2d1”, while those for Na atoms were “s2p2”. The k points are generated
                                   according to the Monkhorst–Pack method and were set to 3 × 3 × 1. The mesh cut-off
                                   energy value was set to 170 Ry (i.e., 2313 eV). Otherwise, a large 34 Å vacuum is built
                                   into the cell along the z axis to avoid overlapping periodic cells. Note that the van der
                                   Waals corrections were not taken into account in our calculations. The choice of empirical
                                   parameters dedicated to the modeling of these corrections in DFT could increase the main
                                   source of uncertainty in our calculation. This would lead to shifts in energy, which will
                                   always be submitted to discussion [65].
                                        The adsorption energy (Equation (1)) is estimated based on a difference between
                                   the total energy of the complex tube CNT (and graphene) + adsorbate system and the
                                   individual tube (and graphene) and gas phase free molecule system.

                                           Eads H+ /HO− = Etot (H+ /HO− ads_surface) − E(H+ /HO− des_surface)                       (1)

                                         For all the simulations, molecular dynamics calculations were carried out in the NVT
                                   ensemble at 300 K. The velocities of the atoms were scaled every 20 MD steps, and time
                                   step was 1 fs. All simulations were run for 2000 fs.
Nanomaterials 2021, 11, x FOR PEER REVIEWMonolayer graphene is made of 32 atoms and adopts an armchair chirality (1,1) 4with       of 17
                                   honeycomb structure and semi-metallic properties. The monolayers of each system are
                                   separated by a 34 Å vacuum to avoid any interaction between the periodic images.
                                         Carbon nanotubes were also studied with a confined water molecule and the same
                                    experimental observations are still interpreted as coming from the apparition of a surface
                                   vacuum exclusive region, as previously mentioned. For all the structures, two situations
                                    charge. The origin of the latter needs more profound theoretical insight to understand its
                                   were investigated: a first case with an undissociated water molecule and a second one
                                    appearance. Hence, it seemed relevant to investigate more closely the behavior of a disso-
                                   with a dissociated water molecule. In each situation, the cases without field and with field
                                    ciated water molecule near a single graphene sheet. A uniform electric field was applied
                                   application were also explored. The electric field, when applied, was along the x axis of
                                    to the system to model the influence of the potential drop used in current–voltage meas-
                                   the elementary cell presented in Figure 1c. The studied slabs (CNT and graphene layer)
                                    urements.
                                   and           Figure
                                         ESMs were       1 shows
                                                       placed      the studied
                                                               parallel         system
                                                                        to the y-z plane.and
                                                                                           Thesummarizes
                                                                                                electric fieldthe ESM
                                                                                                                was    methodapplied
                                                                                                                    therefore   model
                                    used  in these  calculations.
                                   perpendicularly to the tube axis and to the graphene plane. The effective screening media
                                   (ESMs)Thewere
                                               sameplaced
                                                     calculations
                                                            at the were  also performed
                                                                   cell boundaries        for an undissociated
                                                                                     conforming    to Figure 1c. water
                                                                                                                   Note molecule;   the
                                                                                                                         also that the
                                    applied   field did not  cause  the spontaneous
                                   origin of the x-axis was set at the cell boundary. dissociation  of  the water  molecule,  even  for
                                    high intensities.

                       Figure 1. (a,b) Graphene and dissociated water + graphene system. (c) ESM method model.
                       Figure 1. (a,b) Graphene and dissociated water + graphene system. (c) ESM method model.

                                         As shown in Table 1, which summarizes all the adsorption energies of H+ and HO-
                                   on the graphene surface due to the most important events occurring during the simula-
                                   tion, the adsorption states of H+ and HO− were all negative, indicating favorable adsorp-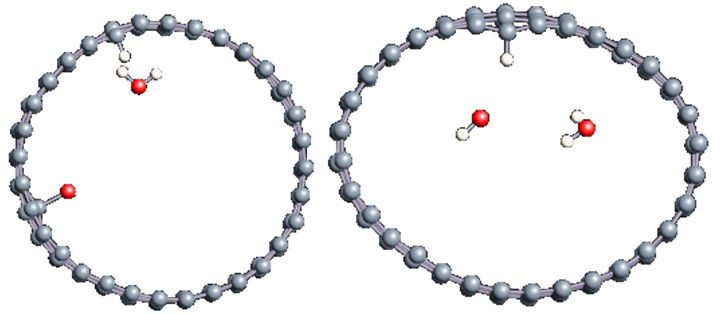
Nanomaterials 2021, 11, 306 4 of 17
3. Results
3.1. Water Molecule Interaction with Graphene Walls
Graphene has become a key component in the development of graphitic nanoslits
for the transport of water and ions [66–68]. However, there is still an important lack of
theoretical studies that analyze the behavior of water with respect to this material since
many experimental observations are still interpreted as coming from the apparition of
a surface charge. The origin of the latter needs more profound theoretical insight to
understand its appearance. Hence, it seemed relevant to investigate more closely the
behavior of a dissociated water molecule near a single graphene sheet. A uniform electric
field was applied to the system to model the influence of the potential drop used in current–
voltage measurements. Figure 1 shows the studied system and summarizes the ESM
method model used in these calculations.
The same calculations were also performed for an undissociated water molecule;
the applied field did not cause the spontaneous dissociation of the water molecule, even for
high intensities.
As shown in Table 1, which summarizes all the adsorption energies of H+ and HO−
on the graphene surface due to the most important events occurring during the simulation,
the adsorption states of H+ and HO− were all negative, indicating favorable adsorption in
each case. The first adsorption energy of each entity is called Eads . H+ and Eads HO− .
dsorption
dsorption states
statesand
andenergies
energiesofofdissociated
dissociatedwater
watermolecules
moleculeson
onthe
thegraphene
graphenemonolayer.
monolayer.
Table 1. Adsorption states and energies of dissociated water molecules on the graphene monolayer.
U(eV)
000 −5
−−5
5
−50
−−50
50
Figure
H+ adsorption at 79 fs. H+ adsorption at 63 fs. H+ adsorption at 40 fs.
Observation HHH2+adsorption atat365
7979fs
fs HH H++2+adsorption atat63 fsfs H H++ +adsorption
adsorption at 4040fs
++
Oadsorption
formation at fs. Oadsorption
formation at 63fs.
365 HO −adsorption atat906 fs
fs.
+
Eads. H (eV) HH2
2 O
2 Oformation
formation
−0.9 atat365
365 fs. H
fs. H
22O2 O formation
formation
−1.3 atat365
365 fs
fsHO
HO -- adsorption
- adsorptionat
−1.5 at 906
906 fsfs
−
Eads. HO (eV) −0.9
−0.9
- −1.3
−1.3
- −1.5
−−1.5
0.6
-- -- −0.6
−0.6
In the three 2000 fs simulations, the adsorption of the H+ was noted at fast times.
For fields equal to 0 eV
The
The hydrogen
and −5 eV, adsorption
hydrogen adsorption
HO
energies
energies
− adsorption were
was were
ininagreement
not observed.agreement with
A verywithhigh
the
the theoretical
theoreticalc
field
intensity alone allows the adsorption of HO to occur. Note that the values of the electricmethod
tions
tionsobserved
observed in in the
theliterature,
literature,
− which
which ranged
ranged from
from −0.81
−0.81 [69]
[69]forfor the
the PBE
PBE methodt
ininLSDA
LSDA [70].
[70].
field should be transformed to be expressed in a usual unit. For each calculation, we had to
transform U (in eV) to The
The adsorption
U (in V/Å), byenergy
adsorption energyofofthe
dividing HO
HO −− −was not favored in the first two situations, wh
wasvalue
initial not favored
by the lengthin the of
first
thetwocell situations,
box ww
electric field value
electric field value
(i.e., 34 Å). As a consequence, 1 eV was was weak.
wasequal It can
weak.toIt4.7
can only
× only occur
10 occur
− 21 V/Å)with a strong field but presentsa
with a strong field but presents
which
The hydrogen which remains ininagreement
remainsenergies
adsorption agreement
were inwith
with thetheliterature
agreement literature
with the for this
thistype
typeof
fortheoretical ofsystem.
system.Note
calculations Notethattha
sorption
sorption of HO
of HO −− −is possible only after a first adsorption of H++,+ which allows the imb
is possible only after a first
observed in the literature, which ranged from −0.81 [69] for the PBE method to −0.67 adsorption of H , which allows the im
in LSDA [70]. ofofthe
the charge
charge carriers
carriers in
in the
theplanar
planar surface.
surface. This
This has
has already
already been
been observed
observed in
inrece
rec
since the
theHO
sinceenergy
The adsorption HO of−adsorption
−− − was not
adsorption
HO on
ongraphene
graphene
favored inwas
the never
was never
first chemical,
two chemical, and
and
situations, ititleads
when thetotosmall
leads smalli
tion
electric field valuetionenergies
wasenergies with
weak. Itwith carbon
carbon
can only atom.
atom.
occur with a strong field but presents a value which
remains in agreement To
To better
with theunderstand
better understand
literature the
forthe ability
thisability
type of ofofsystem.
hydrogen
hydrogen Note ororthat
hydroxyl
hydroxyl ions
ionstotointeract
the adsorption interactww
of HO− is possiblegraphene
graphene sheet,
only aftersheet, we
werepresent
a first representininof
adsorption Figure 22the
H+ , which
Figure thecharge
chargedensity
allows density
the distribution
distribution
imbalance of thedifferenc
differen
charge carriers dissociated
indissociated
the planar water
water
surface. molecule
molecule near
This hasnear aagraphene
already graphene sheet.
sheet. in recent data since
been observed
the HO− adsorption on graphene was never chemical, and it leads to small interaction
energies with carbon atom.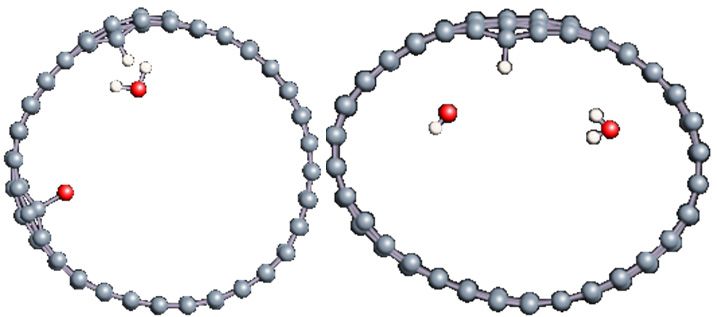
The adsorption energy of HO− was not favored in the first two situations, when the
electric field value was weak. It can only occur with a strong field but presents a value
which remains in agreement with the literature for this type of system. Note that the ad-
Nanomaterials 2021, 11, 306 sorption of HO− is possible only after a first adsorption of H+, which allows the imbalance 5 of 17
of the charge carriers in the planar surface. This has already been observed in recent data
since the HO− adsorption on graphene was never chemical, and it leads to small interac-
tion energies with carbon atom.
To better understand the ability of hydrogen or hydroxyl ions to interact with the
To better understand the ability of hydrogen or hydroxyl ions to interact with the
graphene sheet,we
graphene sheet, werepresent
representininFigure
Figure 2 the
2 the charge
charge density
density distribution
distribution differences
differences for for
a a
dissociated water molecule near a graphene
dissociated water molecule near a graphene sheet. sheet.
Figure
Figure2.2.Charge density
Charge densitydistribution in the
distribution incase
the of dissociated
case water molecule
of dissociated adsorption
water molecule on gra- on
adsorption
phene at −50 eV electric field. Yellow and blue lobes represent, respectively, the positively and
graphene at −50 eV electric field. Yellow and blue lobes represent, respectively, the positively and
negatively charged areas.
negatively charged areas.
As
Asshown
shownininFigure
Figure2,2,the
thesurface
surfacepolarization
polarization generated
generated bybythethe
effect of the
effect electric
of the electric
field creates negative and positive charges on the carbon atoms of graphene.
field creates negative and positive charges on the carbon atoms of graphene. This polariza- This polari-
zation allowsthe
tion allows theH H++ ion
ion to
to be
be adsorbed
adsorbedon onthethecarbon
carbonatoms,
atoms,which
which has a negative
has a negativesurface
surface
layer. Indeed, H + is
+ forced to translate in the field direction, as do the partial
layer. Indeed, H is forced to translate in the field direction, as do the partial charges charges on
the graphene surface. This induces a favorable adsorption of H + at the+
on the graphene surface. This induces a favorable adsorption of H at the first step of first step of the
simulation.
the simulation. H+ is bonded
Once Once to a carbon
H+ is bonded to a atom,
carbon it atom,
locallyitmodifies the density
locally modifies theofdensity
charge of
repartition. Without such changes, HO − could never
− be adsorbed on the
charge repartition. Without such changes, HO could never be adsorbed on the graphene graphene surface.
The presence
surface. Theofpresence
the cationofthus
the allows
cation HO
thustoallows
− be attracted
HO− to by be
theattracted
grapheneby surface spon-
the graphene
taneously.
surface spontaneously.
Salt
SaltEffect
Effect
The
Therole
roleofofsalt
saltininwater
waterdynamics
dynamics is is
necessary
necessaryto to
complete thethe
complete simulated
simulated system
system andand
get
getcloser
closer to
tothe
thexexperimental
experimental conditions.
conditions.TheThedissociated
dissociatedsodium
sodiumchloride
chloride(Na(Na, Cl, Cl
+ + − ) was
− ) was
Nanomaterials 2021, 11, FOR PEER REVIEW
thus
thusadded
addedtotothe theprevious
previoussystem.
system.
The
Thebehavior
behaviorofofwater waterand
andsalt with
salt withrespect to to
respect graphene
grapheneat different field
at different strengths
field strengths is is
given in Table
given in Table 2. 2.
Table 2. Behavior of the dissociated water molecule near the graphene layer in
under electric
Table 2. Behavior of the dissociated bias.
water molecule near the graphene layer in the presence of salt
under electric bias. Important Events in
U(eV)
Simulation
Important Events in Simulation Observations
H+ adsorption at 135 fs.
0
H2 O formation at 292 fs.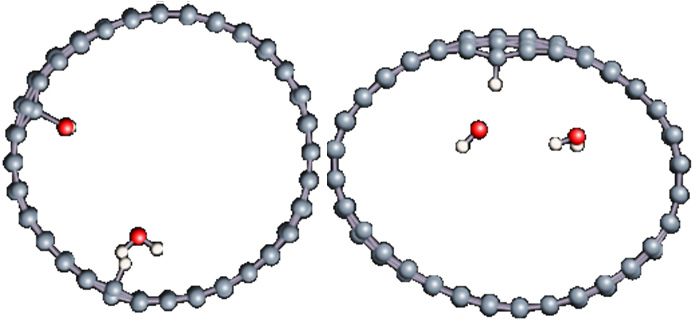
Important Events in
Important Events in
Simulation
Important Events in
Simulation
Simulation
Simulation
Nanomaterials 2021, 11, 306 6 of 17
Table 2. Cont.
U(eV) Important Events in Simulation Observations
NaOH formation at 100 fs.
5 HCl Formation at 242 fs.
H2 O formation at 815 fs.
NaOH formation at 110 fs.
−5 H+ adsorption at 120 fs.
H2 O formation at 240 fs.
50 H2 O formation at 220 fs.
H2 O formation at 101 fs.
−50
NaCl formation at 175 fs.
In all simulations, the reformation of the water molecules of H++ and
In all simulations, the In all simulations,
reformation of the reformation ofofH+the water molecules
− of H and
was observed at the water
relatively
In all simulations, molecules
short
the times
reformation for and
all
of HO
field
the water in molecules
solution
intensities. However
of H+ a
was observed at relatively wasshort In
observed all
times simulations,
atforrelatively
all field the reformation
short times However,
intensities. for of the water molecules
all fieldforintensities.
weak field of H+ a
However
intensities,
was observed short-lived interactions
at relatively shortoftimes
H with
+ fortheall carbon surface areHowe
field intensities. pos
was observed
intensities,
intensities, short-lived interactions of at relatively
short-lived
+ with
Hshort-lived interactions shortoftimes
H+ withforpossible
all field
the carbon intensities.
surface Howe
are poss
really relevant.
intensities, There thewascarbon
no realsurface
interactions are
HO−−ofand the but
H++ adsorption
H+ + with carbonarephenomena
not
surface are o
really relevant. There was intensities,
really
no relevant.
real −short-lived
There H+was interactions
no real HO ofand
H with the
H adsorption carbon surface are p
phenomena o
surface
really in HO
relevant. andThere
the presence ofadsorption
salt
wasinno these phenomena
real HO− − and on
simulations. + the
H+Note graphene
that during
adsorption simul
phenome
really
surface
surface in the presence ofmation in
saltsurface relevant.
the
in these presenceThereof was
salt no
in real
these HO and
simulations. H adsorption
Note that phenomen
during simula
insimulations.
of NaCl thewaspresence Note
observedof salt that
near during
the
in these simulations,
graphene
simulations.surface the
Note refor-
inthat
our during
electrochsim
mation of NaCl was observed surface
mation near in
of NaCl
thethegraphene
presence
was observedof salt
surface in
near in these
the
our simulations.
graphene
electrochemicalsurfaceNote inthat
ESM our during sim
electroche
cell.
Theremationis, thus, no possibility
of NaCl was observed for salt ions
near thetographene
be kept by the graphene
surface in surfa
our electr
There is, thus, no possibility mation
There foris,saltof NaCl
thus, was observed
notopossibility byfor near
thesalt thetographene
ions be kept by surface in our electro
the graphene surfa
There is,ions
thus, be possibility
no kept graphene
for salt ionssurface.
to be kept by the graphene s
There is, thus, no possibility for salt ions to be kept by the graphene su
3.2. Undissociated Water Molecule inside the Carbon Nanotube
3.2. Undissociated Water Molecule inside the Water
3.2. Undissociated CarbonMolecule
Nanotube inside the Carbon Nanotube
3.2. Undissociated Water Molecule inside the Carbon Nanotube
The role of confinement 3.2.atUndissociated
the nanometric Water
scaleMolecule inside the Carbon
on the possibility to chargeNanotube
a carbon
wall was then studied. Indeed, it has been established in previous experimental and
theoretical studies [71–73] that water dissociation can occur under the effect of an electric
field. Furthermore, studies of the water behavior in an ultra-confined environment have not
excluded the possibility of its dissociation [74,75]. This dissociation can be highly favored
in a confined space, in fact, Muñoz-Santiburcio et al. have shown that confinement greatly
improves the self-dissociation process of water. This result is consistent with another
study conducted by Sirkin et al. who used QM/MM molecular dynamics to compute the
energy without water dissociation in a single-walled carbon nanotube 8.1 Å in diameter.
They hypothesized that it seems plausible, under the effect of nanometric confinement,
to see an increase in the self-dissociation constant due to the increase in the permittivity
of the confined fluid [75]. We first modelized a (16,0) single-walled carbon nanotube with
diameter of 1.35 nm where a water molecule was introduced into the confined inner space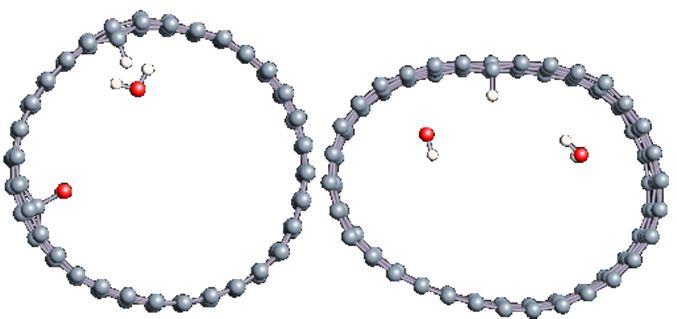
greatly improves the self-dissociation process of water. This result is consistent with an-
other study conducted by Sirkin et al. who used QM/MM molecular dynamics to compute
the energy without water dissociation in a single-walled carbon nanotube 8.1 Å in diam-
Nanomaterials 2021, 11, 306 7 of 17
eter. They hypothesized that it seems plausible, under the effect of nanometric confine-
ment, to see an increase in the self-dissociation constant due to the increase in the permit-
tivity of the confined fluid [75]. We first modelized a (16,0) single-walled carbon nanotube
with
of thediameter of 1.35
carbon cage. nm where
Several a water
situations molecule
have was introduced
been achieved into the
by increasing confined
the inner
field intensity
space of
(Figure 3). the carbon cage. Several situations have been achieved by increasing the field
intensity (Figure 3).
Figure 3. Electrical polarization
Figureeffect on a water@tube
3. Electrical system.
polarization (a)on
effect Initial configuration.
a water@tube (b–d)
system. (a)final configuration
Initial for E(b–d)
configuration. = 0 final
eV (5 eV and 50 eV, respectively)
configuration for E = 0 eV (5 eV and 50 eV, respectively)
Despite the importance
Despite importanceofofthe theapplied
applied field intensities
field thatthat
intensities strongly impact
strongly the geom-
impact the ge-
etry of the
ometry of carbon nanotube,
the carbon we didwe
nanotube, notdid
observe dissociation
not observe of a confined
dissociation of awater molecule.
confined water
There was There
molecule. a deformation of the nanotube
was a deformation until
of the it was crushed
nanotube until it and
was formed
crushedanand
elongated
formed
shape
an in the transverse
elongated direction
shape in the (Figure
transverse 3d). Whatever
direction (Figurethe deformation,
3d). Whateverthe themolecule dif-
deformation,
fused
the inside the
molecule internal
diffused volume
inside of the CNT,
the internal volume exploring different
of the CNT, atomicdifferent
exploring positions, but
atomic
keeping itsbut
positions, distance
keepingfrom carbon wall
its distance fromdue to hydrophobic
carbon wall due tointeraction
hydrophobic [76]. Note that [76].
interaction no
form that
Note of physical
no formorofchemical
physical adsorption
or chemicalofadsorption
the water ofmolecule
the waterwas noted on
molecule thenoted
was carbon on
surface.
the carbon surface.
3.2.1.
3.2.1. Dissociated
Dissociated Water Molecule Inside CNT
No dissociation of
No dissociation ofthe
themolecule
molecule hashas been
been observed
observed in previous
in our our previous simulations.
simulations. The
Nanomaterials 2021, 11, x FOR PEER REVIEW The next step of our calculations deals with the simulation of a dissociated water 3 of 6molecule
next step of our calculations deals with the simulation of a dissociated water molecule
Nanomaterials 2021, 11, x FOR PEER REVIEW inside
inside the carbon
carbon cage.
cage.InInthis
this case,
case, wewe directly
directly studied
studied the possibility
the possibility of 3hydronium
of hydronium
of 6 and
and hydroxyl
hydroxyl ion adsorption
ion adsorption resulting
resulting fromfrom this dissociation
this dissociation and quantified
and quantified it in terms
it in terms of ad-of
adsorption
Table 3. Water
sorption energy.
molecule Several
dissociated
energy. Several simulations
inside (16,0) CNT
simulations were
wereunderundertaken fora adissociated
electric bias.
undertaken for dissociatedwater
watermolecule
molecule
confined inside the
confined inside the carbon nanotube (16,0). The main results are shown in Tables 33and
The main results are shown in Tables and4.4.
Table 3. Water molecule dissociated inside Important
(16,0) CNT Events
underinelectric bias.
We first noted that the H adsorption was possible spontaneously without an external
U(eV) +
3. Water of
molecule dissociated Simulation
inside
Table
contribution an electric field, as
Important seen(16,0) CNT
for the
Events under
first
in electric bias.
simulation at 0 eV field intensity. In
U(eV)
addition, our calculations show Simulation
that the adsorption of H+ always preceded that of HO−
U(eV) Important Events in Simulation Observations
regardless of the intensity of the applied field. Note here that hydrogen adsorption was
favored rapidly and did not depend on the deformation of the carbon cage under the elec-
tric field
0 intensity. The rapid process leading to the hydrogenation of a carbon was ob-
served before the strong modification of the carbon geometry. On the contrary, the for-
mation 0 of 0a water molecule (observed for E = 10 eV) or the adsorption H+ adsorption at 140 fs. was
of hydroxyl
only possible when H was chemisorbed and the carbon surface was deformed under an
+
increasing electric field intensity, as observed previously.
1 H+ adsorption at 112 fs.
1
HO− adsorption at 212 fs.
1
5
5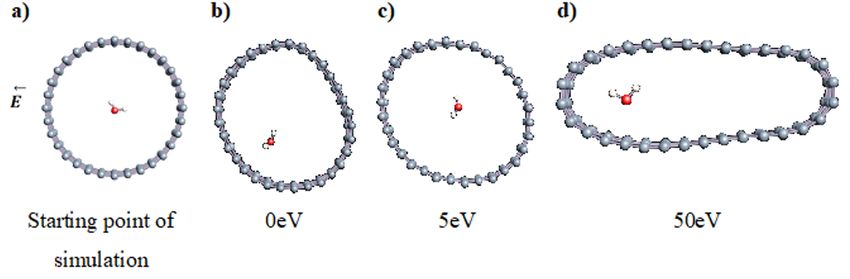
1
1
Nanomaterials 2021, 11, 306 8 of 17
1
1
Table 3. Cont.
U(eV) Important Events in Simulation Observations
5
5
5
5 5 H+ adsorption at 113 fs.
10
10
H+ adsorption at 110 fs.
10 10 H2 O formation at 456 fs.
10
15
15 H+ adsorption at 95 fs.
15
HO− adsorption at 470 fs.
15
15
25 25 H+ adsorption at 104 fs.
25 HO− adsorption at 589 fs.
25
25
The last Table 4. (H+ , HO− gathered
two simulations in Table
) Adsorption 3 (performed
energies inside (16,0) at 15 eV and 25 eV) recall the case
CNT.
The last two simulations gathered in Table 3 (performed at −15 eV and 25 eV) recall the case
of graphene for a dissociated water molecule. In fact, HO
+ Ads. Energy −(eV)
adsorption took−place at later
of graphene for a dissociated
U(eV)gathered waterinmolecule.H In fact, HO adsorption 25took
HO place at later
Ads. the
Energycase(eV)
times in the simulation but especially at high field intensitieseV
The last two simulations Table 3 (performed at 15 andfor
and eV) recall
significant carbon
times in the simulation but especially at high field intensities
−4.1 and for significant carbon
of graphene for that0 the
a dissociated water molecule. In the
fact, HOat 15adsorption 25 took -at case
placethe later
−
The last two simulations
deformation. Note gathered in Table
adsorption of HO3 (performed
− (or eV and
reformation of watereV)molecule)
recall was
deformation.
times in the Note that
simulation 1 the
butadsorption
especially of
at HO
high −4.2
− (or the
field reformation
intensities andof water
for −0.3
molecule)
significant was
carbon
of
notgraphene
observedfor due a to
dissociated
the watertime,
simulation molecule.
which Inwas
fact, HO adsorption
stopped−
equally fortook
eachplace at later
calculation.
not observed due tothat
the5 simulation time, which was−4.0
stopped equally forsignificant
each -
calculation.
deformation.
times
We reported Note
in the simulation
in Table the
410the adsorption
butdifferent
especially of high
at HO− (or
adsorption fieldthe reformation
−intensities
energies
4.6 obtained
offor
andwhenwater molecule)
hydrogen was
-carbon
and/or
We
not reported
observed
deformation. indueTable
to 4
the the different
simulation adsorption
time, which energies
was obtained
stopped when
equally for hydrogen
each and/or
calculation.
hydroxyl ionsNote that
are adsorbed15the adsorption
on the carbonof HO −
wall.(or the
−4.6 reformation of water molecule) −0.06 was
hydroxyl
We observed
not reported ionsinare
due adsorbed
Table
to the4 the
20 on the carbon
different
simulation time, wall. was
adsorption
which energies
−4.3 obtained
stopped when
equally for hydrogen - and/or
each calculation.
hydroxyl
We ions
reported inare
Table 425the different
adsorbed on the carbon −4.2 obtained when hydrogen
wall. energies
adsorption −0.3
and/or
hydroxyl ions are adsorbed on the carbon wall.
We first noted that the H+ adsorption was possible spontaneously without an external
contribution of an electric field, as seen for the first simulation at 0 eV field intensity.
In addition, our calculations show that the adsorption of H+ always preceded that of
HO− regardless of the intensity of the applied field. Note here that hydrogen adsorption
was favored rapidly and did not depend on the deformation of the carbon cage under
the electric field intensity. The rapid process leading to the hydrogenation of a carbon
was observed before the strong modification of the carbon geometry. On the contrary,
the formation of a water molecule (observed for E = 10 eV) or the adsorption of hydroxyl
was only possible when H+ was chemisorbed and the carbon surface was deformed under
an increasing electric field intensity, as observed previously.
The last two simulations gathered in Table 3 (performed at 15 eV and 25 eV) recall the
case of graphene for a dissociated water molecule. In fact, HO− adsorption took place at
later times in the simulation but especially at high field intensities and for significant carbon
deformation. Note that the adsorption of HO− (or the reformation of water molecule) was
not observed due to the simulation time, which was stopped equally for each calculation.
We reported in Table 4 the different adsorption energies obtained when hydrogen and/or
hydroxyl ions are adsorbed on the carbon wall.
The energies calculated for H+ adsorption on the inner surface of the carbon cage
were on the order of −4 eV. These clearly show that the adsorptions observed were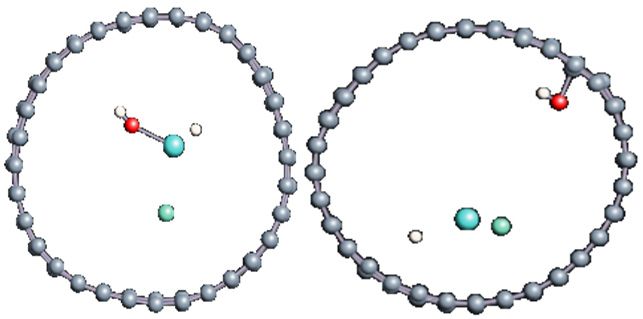
Nanomaterials 2021, 11, x FOR PEER REVIEW 9 of 17
Nanomaterials 2021, 11, 306 The energies calculated for H+ adsorption on the inner surface of the carbon cage
9 of 17
were on the order of −4 eV. These clearly show that the adsorptions observed were chem-
isorptions, explaining the difficulty for hydroxyl ions to interact with hydrogen once
chemisorbed. These
chemisorptions, values are
explaining theindifficulty
agreement forwith othersions
hydroxyl foundto in the literature,
interact which are
with hydrogen
around −3 eV [77]. Note also that for each modification of the carbon surface
once chemisorbed. These values are in agreement with others found in the literature, by the hy-
drogen chemisorption, we observed a modification of the carbon hybridation,
which are around −3 eV [77]. Note also that for each modification of the carbon surface which
could behydrogen
by the apparentchemisorption,
to a sp mode. The
3 hydroxylaion
we observed interacted of
modification with
thethe carbon
carbon surface with
hybridation,
awhich
highercould
energy,
be which
apparent to a sp3 mode.
is comparable to those obtained ion
The hydroxyl in the literature
interacted [78].the carbon
with
surface with a higher energy, which is comparable to those obtained in the literature [78].
3.2.2. Differences in Charge Density Distribution for the Dissociated Water Molecule In-
3.2.2.
side CNTDifferences in Charge Density Distribution for the Dissociated Water Molecule
Inside CNT
In Figure 4, we plot the modification of the atomic charge density when applying a
In Figure 4, we plot the modification of the atomic charge density when applying
high
a high electric field
electric fieldintensity
intensity(25 (25 eV).
eV). The positive and
The positive andnegative
negativedifferences
differences in in
thethe total
total
charge
charge densities are colored in yellow and blue, respectively. As can be seen in Figure 4, 4,
densities are colored in yellow and blue, respectively. As can be seen in Figure
polarization
polarizationof of the
the surface is responsible
surface is responsiblefor fordelocalization
delocalizationofof the
the electrons
electrons and,
and, therefore,
therefore,
for
forthe
the creation
creation of ofananelectron
electron deficit
deficit on on certain
certain areasareas
of theofinternal
the internal
surfacesurface of the
of the tube andtube
and an accumulation
an accumulation of electrons
of electrons in other
in other areas.areas.
As a As a consequence,
consequence, the hydrogen
the hydrogen ion willionbewill
be more
more sensitive
sensitive to the
to the surface
surface zonezone
where where electrons
electrons are present,
are present, while thewhile the hydroxyl
hydroxyl remains re-
mains
close toclose to the oppositely
the oppositely charged charged
surface part surface
whilepart whileis the
the CNT CNTdeformed.
slightly is slightlyHowever,
deformed.
even in this
However, large
even in field intensity,
this large fieldthe time necessary
intensity, the timeto obtain the
necessary tohydroxyl
obtain the binding
hydroxyl to the
bind-
carbon
ing to thesurface
carbon was quite large
surface was (627
quitefs),large
while(627
the hydrogen
fs), while ion
theattached
hydrogen faster
iontoattached
the surfacefaster
to(85 fs surface
the compared (85tofs110 fs at least).
compared to The
110 final
fs atadsorption
least). Theoffinal
hydroxyl was observed
adsorption of hydroxylon thewas
flatter surface of the deformed CNT, where the strain appeared
observed on the flatter surface of the deformed CNT, where the strain appeared to be theto be the least. Indeed,
it has been shown in previous studies that the tensile strain on a single sheet of graphene
least. Indeed, it has been shown in previous studies that the tensile strain on a single sheet
can influence the interaction of the adsorbents but also make possible the modification of
of graphene can influence the interaction of the adsorbents but also make possible the
its mechanical and physical properties [79–82].
modification of its mechanical and physical properties [79–82].
Figure 4. Difference in charge density distribution of the dissociated water molecule inside the CNT under 25 eV electric
Figure 4. Difference in charge density distribution of the dissociated water molecule inside the CNT under 25 eV electric
field. The yellow and blue lobes represent the positively and negatively charged areas, respectively.
field. The yellow and blue lobes represent the positively and negatively charged areas, respectively.
3.2.3. Effect of Adding Water Molecules on the Adsorption Steps
3.2.3. Effect of Adding Water Molecules on the Adsorption Steps
To go further in our study, we complicated the previous system by adding an addi-
To go further in our study, we complicated the previous system by adding an addi-
tional
tional watermolecule
water molecule and let the
and let the system
systemevolve
evolvetotosee seeitsitseffect
effectonon thethe adsorption
adsorption steps.
steps.
Several
Several simulations wereperformed
simulations were performed byby varying
varying the intensity
the intensity of theofapplied
the applied
field. Afield. A do-
domain
main of intensities ranging from 0 to 30 eV was scanned. Table 5 illustrates
of intensities ranging from 0 to 30 eV was scanned. Table 5 illustrates all the simulations car- all the simula-
tions carried
ried out outsystem
for this for thiscontaining
system containing one dissociated
one dissociated and one undissociated
and one undissociated water molecule water
molecule
inside theinside
carbon the carbon nanotube
nanotube (16,0). (16,0).
As
Asshown
shown in in Table 5, almost
Table 5, almostthe thesame
samebehavior
behaviorwas wasdetected
detected in in
allall
thethe simulations,
simulations,
even at high field strengths. The phenomena of H + and HO − adsorption occurred at
even at high field strengths. The phenomena of H and HO adsorption occurred at prac-
+ −
practically simultaneous instants − adsorption of a few
tically simultaneous instants withwith
a verya very slight
slight advance
advance of HO of −HO
adsorption of a few fs over
fs over
the
+
the H adsorption,
H+ adsorption, compared compared to the previous
to the previous system. system.
This firstThis HOfirst HO− adsorption,
− adsorption, before any
before any other, was the main difference obtained in this system,
other, was the main difference obtained in this system, which has never been observed which has never been
previously. However, it is not very durable because the entity was desorbed in all in
observed previously. However, it is not very durable because the entity was desorbed cases
all cases after 40 fs of existence, depicting a very low adsorption energy with the carbon
after 40 fs of existence, depicting + a very low adsorption energy with the carbon atom. On
atom. On the other hand, H remained adsorbed until the end of the simulation in all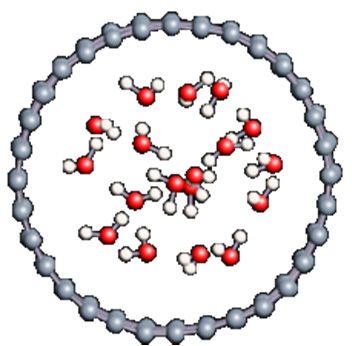
Nanomaterials 2021, 11, 306 10 of 17
Nanomaterials 2021, 11, x FOR PEER REVIEW 4 of 6
situations, as observed previously. We can therefore wonder about the role of HO−4 on
Nanomaterials 2021, 11, x FOR PEER REVIEW of 6
the H+ adsorption in this case. It can either be the main factor having improved the
Nanomaterials 2021, 11, x FOR PEER REVIEW
association of hydrogen with carbon by the modification of the electronic structure of 4the of 6
Field Intensity (eV) Important Events Observation
cage or, simply, be the random consequence of the hydroxyl position compared to 4the
Nanomaterials 2021, 11, x FOR PEER REVIEW of 6
Field Intensity (eV) hydrogen position.Important Note that noEvents
dissociation of the water molecule Observation
was observed during
Nanomaterials 2021, 11, x FOR PEER REVIEW 4 of 6
Field Intensity (eV) the simulation. Important Events Observation
Field Intensity Table(eV)
5. Dissociated and undissociated Important Events inside (16,0) CNT under HO
water molecules
− adsorption at 134 fs
electricObservation
bias.
1 H − adsorption
HO
+
adsorption at
at 150
134 fs fs
Field Intensity (eV)
Field Intensity (eV)
Important Events
Important Events
Observation
Observation
1 HO
H
− desorption
+ adsorption at at
150179fsfs
HO adsorption at 134 fs
−
1 HO desorption at
H+−−adsorption at 179 fs fs
HO adsorption at150 134 fs
1 HO − desorptionatat150
H+− adsorption 179fsfs
HO−− adsorption
HO adsorption at at134
134fs.fs
HO desorption at 179 fs
11 HH++ adsorption
adsorption at at150
150fs.fs
−
HO − desorption
desorption atat179
HO 179fs.fs
HO− adsorption at 135 fs
10 H+− adsorption
HO adsorption at at 137
135 fs fs
10 HO
H + − desorption
adsorption at at
137173 fsfs
HO adsorption at 135 fs
−
10 HO − desorption at
H+−−adsorption at 137
173 fs fs
HO
HO adsorption
adsorption atat135 135fs.fs
10
10 HO − desorptionat137
H++ adsorption at137
173
fs.fsfs
HO−− adsorption
adsorptionatat 135 fs
HO
HO − desorption at
desorption at 173173 fs.fs
10 H+ adsorption at 137 fs
HO− desorption at 173 fs
HO− adsorption at 133 fs
15 H+− adsorption
HO adsorption at at 137
133 fs fs
15 HO
H + − desorption at 167 fs
adsorption at 137 fs
HO− adsorption
HO
− adsorptionatat133 133 fs.fs
15 HO desorptionatat
++− adsorption at 167 fs
15 H
HO− adsorption at 133fs
H − adsorption 137137fs. fs
HO
HO − desorption
desorptionat 167 fs. fs
15 H+− adsorption atat137
167 fs
HO adsorption at 133 fs
HO − desorption at 167 fs
15 H+ adsorption at 137 fs
HO− desorption at 167 fs
HO− adsorption at 133 fs
20 H+− adsorption
HO
HO− adsorption at 138
adsorption atat133 133fs.fs
fs
20 HO
H + − desorption at 173 fs
H adsorption atat138
20 HO + −adsorption
adsorption at138
− desorption at 173 fs.
fs.fsfs
133
HO
HO − desorption at 173 fs
20 H −adsorption
HO
+
adsorptionat at138
133fs fs
20 HO − desorption at 173 fs
H adsorption at 138 fs
+
HO− adsorption at 133 fs
HO − desorption at 173 fs
20 H+ adsorption at 138 fs
HO− desorption at 173 fs
HO−− adsorption
HO adsorption atat133 133 fs.fs
++ adsorption at 136 fs.
30
30 H
HO− adsorption at 133 fs
H − adsorption at 136 fs
HO
HO − desorption
desorption atat177177fs.fs
30 H + adsorption at
HO adsorption at 133 fs
− 136 fs
30 HO desorption at
H+−−adsorption at 177 fs fs
HO adsorption at136 133 fs
30 HO − desorptionatat136
H+ adsorption 177fsfs
HO− adsorption at 133 fs
HO − desorption at 177 fs
30 The
Theadsorption
adsorptionenergies
energieswere
werecalculated.
calculated.Results
Resultsare H+ adsorption
arereported
reported ininTable at
Table6. 136
Duefs
6.Due totovery
very
fast
fasthydroxyl
hydroxyl adsorption
adsorption events,
events, we
we were
were not
not able
able totoestimateHOthe
estimate −
the adsorption
desorption
adsorption at energy
177
energyfs for for
The
− adsorption energies were calculated. Results are reported in Table 6. Due to very
the HO
the HO ion. However,
ion. However, as seen
asevents, in
seen inweTable
Table 6, the hydrogen adsorption energy was equal to
were6,not the able
hydrogen adsorption energy was equalfor to
−
fast hydroxyl
Theas adsorption
adsorption energies were calculated. Results to estimate
are where the adsorption
reported in energy
Tablemolecule
6. Due towas
very
−−4.4
4.4 eV,
eV, as obtained
obtained previously
previously (Table
(Table 4),
4),for
for the
the system
system where no
no water
water molecule was
the
fastHO
− ion. However,
hydroxyl adsorption as events,
seen in weTablewere6, the
nottohydrogen
able toare adsorption
estimate energy wasenergy
thehydroxyl
adsorption equal for to
present.
TheThe
present. The role
roleofofthe
adsorption thewater
watermolecule
energies were
molecule added
calculated.
added thethe
Results
to hydrogen plus
reported
hydrogen in
plus Table 6.ion
hydroxyl Due seems
ion toseemsto
very
−4.4 eV,
the HO − as obtained
ion.role
However, previously
asevents, (Table
seen inof Table 4), for
6, not the
the able system
hydrogen where
adsorption no water molecule
energy was was
equalfor to
play
fast a minor
hydroxyl
to play aThe minor in the
adsorption reactivity we the
werecarbon surface.to estimate the adsorption energy
present.
−4.4 The
eV, as rolerole
adsorption
obtained
in the
of the
energies reactivity
water
previously molecule
were of the
added
calculated.
(Table 4),
carbon
forResults
the
surface.
to the hydrogen
are
system reported
where plus hydroxyl
in Table
no water iontoseems
6.molecule
Due very
was
the HO ion. However, as seen in Table 6, the hydrogen adsorption energy was equal to
−
to
fastplay
present. a minor
hydroxyl The role
role of in
adsorption the
the reactivity
events,
water we of
molecule the
were carbon
not
added to surface.
able to estimate
the hydrogen the adsorption energy for
−4.4 eV,− as obtained previously (Table 4), for the system whereplus hydroxyl
no water ion seems
molecule was
the HO
to play aTheion. However,
minor as seen in Table 6, the hydrogen adsorption energy was equal to
present. rolerole in the
of the reactivity
water molecule of the
addedcarbon surface.
to the hydrogen plus hydroxyl ion seems
−4.4 eV, as obtained previously (Table 4), for the system where no water molecule was
to play a minor role in the reactivity of the carbon surface.
present. The role of the water molecule added to the hydrogen plus hydroxyl ion seems
to play a minor role in the reactivity of the carbon surface.Nanomaterials 2021, 11, 306 11 of 17
Table 6. H+ Adsorption energies inside (16,0) CNT.
U(eV) H+ Ads. Energy (eV)
1 −4.413
10 −4.408
15 −4.426
20 −4.409
30 −4.508
3.2.4. Salt Effect on Adsorption Phenomena
In order to evaluate the effect of the ions on the adsorption of dissociated water inside
carbon
Nanomaterials 2021, 11, x FOR PEERnanotube,
REVIEWwe added to the dissociated H2 O@CNT system a salt composed of a 5
unique Na+ ion and its Cl− counterion. The different adsorption events as a function of the
Nanomaterials 2021, 11, xx FOR PEER REVIEW 55
Nanomaterials
Nanomaterials 2021, 11,increase
2021, 11, x FOR
FOR PEERin field
PEER intensity are summarized in Table 7. For intensities between 5 and 20 eV,
REVIEW
REVIEW
+
the H adsorption first occurred at around 80 fs followed by the rapid reformation of the
Nanomaterials 2021,Table 7. Dissociated
11, x FOR PEER REVIEW water molecules inside (16,0) CNT under electric bias in the presence of a salt. 5
water molecule. At a field of 25 eV, HO− adsorption occurred first, at about 385 fs, and the
Field Intensity entity
Table
Table remainedwater
7. Dissociated adsorbed for 200
molecules fs. (16,0)
inside Note CNT
that CNT
underwas much
electric biasless deformed
in the presence under
of a salt.the
Table 7. 7. Dissociated
Dissociated water
water molecules
molecules inside
inside (16,0)
(16,0) CNT
CNT under
under electric
electric bias
bias in
in the
the presence
presence of
of aa salt.
salt.
(eV) action of Important Events
an intense electric in Simulation
field when it contained more molecules, and Observations
no dissociation of
Field
Field Intensity
Field Intensity
Intensity the 7.
Table water molecule
Dissociated
Important was
water
Important
observed
molecules
Events once(16,0)
inside
in Simulation formed.
CNT under electric bias in the presence of a salt.
Observations
(eV)
(eV) Important Events
Events in in Simulation
Simulation Observations
Observations
Table(eV)
Field Intensity
7. Dissociated water molecules inside (16,0) CNT under electric bias in the presence of a salt.
Important Events in Simulation Observations
(eV)
Field Intensity (eV) Important Events in Simulation Observations
0 H2O is formed at 250 fs
00 H
H 2O is formed at 250 fs
0 H22O
O is
is formed
formed at
at 250
250 fs
fs
0 0 H2 O is
Hformed at 250 fs.
2O is formed at 250 fs
H+ adsorbed at 75 fs
5
H2O+ is formed at 551 fs
H
H + adsorbed at 75 fs
55 H+ adsorbed
adsorbed at at 75
75 fs
fs
5 H 2O is formed at 551
O
H+ adsorbed
H 2 is formed
at 75 at
fs. 551 fs
fs
5 H 2O
H O is H
is formed
+ adsorbed
formed at 75 fsfs
at
at 551 fs.
551
2
5
H2O is formed at 551 fs
H+ is adsorbed at 90 fs and HO− remains free un
10
the end of the simulation
H
H
++ is adsorbed at 90 fs and HO−−− remains free un
10
10 H++isis adsorbed
adsorbed at at 90
90 fs
fs and
and HO
HO remains
remains free
− remains free un
un
10 H is adsorbed theat 90
end fs
ofand HO
the simulation
10
free until the
the
the end
end
end ofof
of the
the
the simulation
simulation
simulation
H+ is adsorbed at 90 fs and HO− remains free un
10
the end of the simulation
H+ is adsorbed at 83 fs and HO− remains free un
20 the end of the simulation.
H+++is
H
H
+
is adsorbed at 83 fsand
and HO
− −−− remains free un
H isisadsorbed
adsorbed at
adsorbed at
at 83
83fsfs
83
NaOH fs and
andHO HO remains
remains free
HOremains
formation. free un
un
20 20
20 free until the
the
the end
end
end of
of
of the
the
thesimulation.
simulation.
simulation.
20 H+ is adsorbed the
NaOH end
at of the
formation.
83 fs and simulation.
HO− remains free un
NaOH
NaOH formation.
formation.
20 NaOH formation.
the end of the simulation.
NaOH formation.
NaOH
NaOH formation
formation at 268 fs.
at 268 fs.
25 25 HO−HO
adsorption at 385 at
− adsorption fs. 385 fs.
HO−NaOH
NaOH formation
formation
desorption
NaOH
HO
at
at
at 556 at
formation
− desorption fs. 268
268
at556
fs.
fs.
268fs.
fs.
25
25 HO
HO
−− adsorption at 385 fs.
− adsorption at 385 fs.
25 HO
NaOH adsorption at
formationat 385
at556 fs.
268fs.
fs.
HO
HO
−− desorption
desorption at 556 fs.
25 HO − desorption at 556
HO− adsorption at 385 fs.fs.
HO− desorption at 556 fs.
As for other systems, we estimate the H+ and HO− adsorption energies in Table 8.
observe that the adsorption of H+ was less favorable in this case (−4 eV at best), while
As for other systems, we estimate the H++ and HO−− adsorption energies in Table 8.Nanomaterials 2021, 11, 306 12 of 17
As for other systems, we estimate the H+ and HO− adsorption energies in Table 8.
We observe that the adsorption of H+ was less favorable in this case (−4 eV at best),
while the adsorption of HO− in the very high electric field intensity was on the same
order as that of H+ . The rapid desorption of HO− cannot explain this result, but the
presence of Na+ allows it. Indeed, we observe an important role played by the salt, which is
alternatively attracted by the hydrogen or hydroxyl ions to form another strong acidic or
basic component.
Table 8. H+ Adsorption energies inside (16,0) CNT in the presence of salt.
H+ Ads.
U(eV) Nanomaterials Energy
2021, (eV)PEER H
11, x11,
FOR
+ Ads. Duration (fs)
REVIEW HO− Ads. Energy (eV) HO− Ads. Duration (fs) 6
Nanomaterials
Nanomaterials 2021,
2021, 11,xxFOR
FORPEER
PEER REVIEW
REVIEW
0 - - - -
5 3.288 476 - -
10 −3.449 1910 - -
20 20 2020 −4.087 −4.087
−4.087
−4.087 1917 19171917
1917 - - -- - - --
25 25 2525 - - -- - - -- −3.211 −3.211
−3.211
−3.211 171 171 171
171
3.2.5. Several
3.2.5.
3.2.5. SeveralWater
Several WaterMolecules
Water Molecules
Molecules Inside (16,0)
Inside
Inside Carbon
(16,0)
(16,0) Nanotube
Carbon
Carbon Nanotube
Nanotube
3.2.5. Several Water Molecules Inside (16,0) Carbon Nanotube
In order
In to get
In order
order to closer
to get
get closer to biological
closer to biological
to biologicalconditions,
conditions,
conditions, a dissociated
aa dissociatedwater
dissociated water
water molecule
molecule
molecule sys
In orderimmersed
to get closerin to biological
several water conditions,
molecules a dissociated
was simulated water
by molecule
varying the system of the
intensity
immersed
immersed in in several
several water
water molecules
molecules was was simulated
simulated by by varying
varying the the intensity
intensity of of
immersed inpliedseveral waterfield.
electric molecules
TheThe was simulated
density of water bywas varying the intensity
calculated to be ofin the applied
plied
plied electric
electric field.
field. The density
density of
of water
water was
was calculated
calculated to1be
to be 11order
inin order to reprodu
order to
to repro
repr
electric field.bulk-like
The densitywater ofmedia.
water was After calculated
20002000 to be 1 in order
fs simulations to reproduce
we observed in all a bulk-like
bulk-like
bulk-like water
water media.
media. After
After 2000 fsfssimulations
simulations we
weobserved
observed incases
in all
allcasesa rapid
cases aarapidforma
rapid for
fo
water media. After 2000 fs simulations we observed in all cases a rapid formation of water
of water
ofwater
of molecules
water molecules
molecules (in 17 (infs).
(in 1717fs).
fs).
molecules (in 17 fs).
In order
In to check
Inorder
order tocheck
to the the
check conformation
theconformation
conformation of the confined
ofthe
of theconfined water
confined andand
water
water to see
and to ifsee
tosee possibly
ififpossibly
possiblya ph
In order to check the conformation of the confined water and to see if possibly a phase
change occurred
change occurred (Table 9),
(Table
(Table9), we calculated
9),wewecalculated the radial
the
theradialdistribution
distributiondensity of
density of the water
ofthe wat
thewate in
change occurredchange (Tableoccurred
9), we calculated the calculated
radial distribution radialdensity
distribution
of thedensity
water in wate
various
varioussituations
various situationsstudied.
situations studied. TheThecalculated
calculated valuesvaluesare are
entered
areenteredbecause
because the the
water at the
water at
the various situations studied. Thestudied.
calculated The calculated
values values
are entered entered
because the because
water at the the water at
of the
of
of simulation
the
the simulation
simulation keeps the the
keeps
keeps structure
the structureof the
structure of
of liquid
the
the phase
liquid
liquid andand
phase
phase summarized
and summarized
summarized in Table
in
in 10.
Table
Table
end of the simulation keeps the structure of the liquid phase and summarized in Table 10.
eacheachcase,
each the the
case,
case, first peak
thefirst
first localized
peak
peak localized
localized nearnear
2.7 2.7
near Å.
2.7This
Å.Thisvalue
This corroborates
value corroborates the theorganizatio
theorganiza
organiz
For each case, the first peak localized near 2.7 Å. This valueÅ.corroboratesvalue corroborates
the organization
the the
water
the molecule
water
water molecule
molecule in liquid
in
in liquidform
liquid since
form
form the the
since
since experimental
the experimental
experimental value for for
value
value liquid
for water
liquid
liquid is 2.88
water
water isis
of the water molecule in liquid form since the experimental value for liquid water is 2.88 Å.
Table 9. Distribution
Table
Table of water
9.Distribution
Distribution inside
ofwater
water the (16,0)
inside carbon
the(16,0)
(16,0) nanotube.
carbon nanotube.
Table 9. Distribution of 9.
water of
inside the inside
(16,0) carbon the
nanotube. carbon nanotube.
0 00 10 10
10 25 25
25 50 50
50
Field Intensity (eV) 0 10 25 50
Water distribution
First maximum
2.66
2.662.66 2.73
2.732.73 2.75
2.752.75 2.752.75
2.75
position (Å) 2.66 2.73 2.75 2.75
Table 10. First
Table
Table 10. peakpeak
10.First
First position
peak in the
position
position inradial
in distribution
theradial
the radial function
distribution
distribution of confined
function
function water.
ofconfined
of confined water.
water.
Table 10. First peak position in the radial distribution function of confined water.
U(eV)
U(eV)
U(eV) First Maximum
First
First Maximum
Maximum Position (Å) (Å
Position
Position (
U(eV) 0 00 First Maximum Position (Å)
2.6582.658
2.658
0 10 1010 2.658 2.732.73
2.73
10 25 2525 2.73 2.754 2.754
2.754
25 50 50 2.754 2.752.75
50
50 2.75
2.75
Experimental
Experimentalvalue
Experimental for
value
value
Experimental value for liquid water
liquid
for
for water
liquid
liquid water
water gOO1 = 2.88
g =
OO1gg 2.88
OO1==2.88
OO1
OO1 2.88
Note thatthat
Note
Note during
that duringthe the
during simulation,
the simulation,while
simulation, no adsorption
while
while no
no adsorption
adsorptionwaswas
observed
was on the
observed
observed on car
on the
the
surface, the the
surface,
surface, formation
the formation
formationof successive
of hydronium
of successive
successive hydroniumionsions
hydronium inside
ions the the
inside
inside water bulkbulk
the water
water andand
bulk pro
and
jump have
jump
jump been
have
have affected
been
been via via
affected
affected the so-called
viathe Grotthuss
theso-called
so-called mechanism.
Grotthuss
Grotthuss mechanism.
mechanism.
3.3.3.3.
Change in Hybridization
3.3.Change
Change of the
inHybridization
in Hybridization ofofAdsorption SiteSite
theAdsorption
the Adsorption Site
We We
have found
Wehave
have by comparing
found
found the the
bycomparing
by comparing two carbon
thetwo
two structures
carbon
carbon thatthat
structures
structures the the
that adsorption of H
theadsorption
adsorption
on carbon
on nanotubes
carbon was
nanotubes much
was more
much favorable
more than
favorable on
than a graphene
on a monolayer
graphene and
monolayer
on carbon nanotubes was much more favorable than on a graphene monolayer an atYou can also read


