Critical angle reflection imaging for quantification of molecular interactions on glass surface - Nature
←
→
Page content transcription
If your browser does not render page correctly, please read the page content below
ARTICLE
                  https://doi.org/10.1038/s41467-021-23730-8                 OPEN

                  Critical angle reflection imaging for quantification
                  of molecular interactions on glass surface
                  Guangzhong Ma              1,   Runli Liang1,2, Zijian Wan1,2 & Shaopeng Wang                        1✉

                  Quantification of molecular interactions on a surface is typically achieved via label-free
                  techniques such as surface plasmon resonance (SPR). The sensitivity of SPR originates from
1234567890():,;

                  the characteristic that the SPR angle is sensitive to the surface refractive index change.
                  Analogously, in another interfacial optical phenomenon, total internal reflection, the critical
                  angle is also refractive index dependent. Therefore, surface refractive index change can also
                  be quantified by measuring the reflectivity near the critical angle. Based on this concept, we
                  develop a method called critical angle reflection (CAR) imaging to quantify molecular
                  interactions on glass surface. CAR imaging can be performed on SPR imaging setups.
                  Through a side-by-side comparison, we show that CAR is capable of most molecular inter-
                  action measurements that SPR performs, including proteins, nucleic acids and cell-based
                  detections. In addition, we show that CAR can detect small molecule bindings and intra-
                  cellular signals beyond SPR sensing range. CAR exhibits several distinct characteristics,
                  including tunable sensitivity and dynamic range, deeper vertical sensing range, fluorescence
                  compatibility, broader wavelength and polarization of light selection, and glass
                  surface chemistry. We anticipate CAR can expand SPR′s capability in small molecule
                  detection, whole cell-based detection, simultaneous fluorescence imaging, and broader
                  conjugation chemistry.

                  1 Biodesign Center for Biosensors and Bioelectronics, Arizona State University, Tempe, AZ, USA. 2 School of Electrical, Computer and Energy Engineering,

                  Arizona State University, Tempe, AZ, USA. ✉email: Shaopeng.Wang@asu.edu

                  NATURE COMMUNICATIONS | (2021)12:3365 | https://doi.org/10.1038/s41467-021-23730-8 | www.nature.com/naturecommunications                               1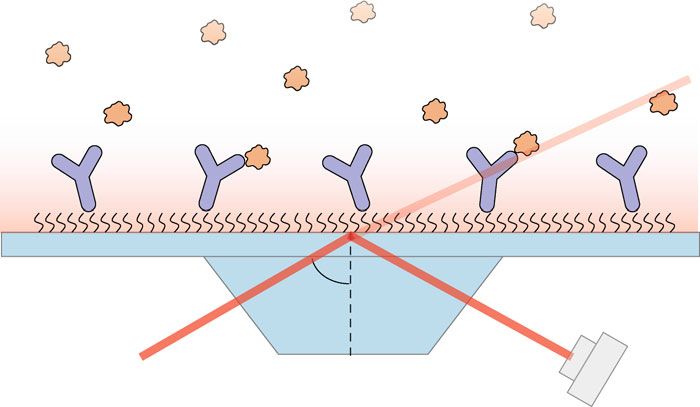
ARTICLE                                                                  NATURE COMMUNICATIONS | https://doi.org/10.1038/s41467-021-23730-8

M
            olecular interactions are ubiquitous in biological sys-           Results
            tems and important to the understanding of molecular              Detection principle. The CAR imaging setup is the same as
            biology and drug discovery. Surface plasmon resonance             Kretschmann SPR imaging setup23, where the collimated incident
(SPR) is the most widely used label-free technique in pharma-                 light is reflected by the glass surface and a detection camera is
ceuticals and research laboratories for measuring molecular                   focused at the sample layer on the surface to collect the reflected
binding kinetics1–3. Owing to the sharp response to the refractive            light (Fig. 1a). The contrast of the image comes from reflectivity
index change on the surface, the high sensitivity of SPR enables              changes, which are modulated by the refractive index changes on
the detection of biomolecules3, small molecules4, viruses5, and               or near the sensing surface. There are two adjustments in
cells6,7. To generate SPR on the surface, the sensor chip (glass              experimental conditions from SPR: (1) the sensor chip is a bare
slide) must be coated with a metal film (often gold), which is                 cover glass instead of a gold-coated cover glass; and (2) the
laborious and increases the operation cost. The gold film is not               incident light is set at slightly below the critical angle, whereas in
required for glass-based biosensors, such as interferometers8–10,             SPR imaging the incident angle is normally set to slightly below
microring and microsphere resonators11–13. However, these                     the SPR resonance angle, which is a couple of degrees higher than
sensors are made through microfabrication and still labor-                    the critical angle. To perform measurements, the glass surface is
consuming. Reflectometry based on measuring phase shift can                    functionalized with receptor molecules to capture the ligands in
directly quantify binding kinetics on a cover glass14,15, but owing           the solution, and upon ligand binding, the refractive index near
to the instrumentation complexity and moderate sensitivity, it is             the surface changes, leading to a change in the reflected light
not as competitive as SPR. It is desirable to develop a simple and            intensity. By measuring the intensity change with a camera, the
sensitive technique for molecular interaction measurements.                   receptor–ligand interaction can be monitored in real-time.
   The sensitivity of most label-free optical biosensors originates              The detection principle of CAR with p- or s-polarized light can
from the response of the probe light to the refractive index change           be described by the Fresnel equation with a similar format. We
on the sensor surface16. For example, in SPR, the reflectivity of              use the equations for p-polarized light below as an example.
the light is significantly reduced at a specific incident angle when            When a p-polarized light is introduced into a glass prism at an
the light energy resonates with the surface plasmons in the gold              incident angle θi and reflected at the interface between the glass
film, and the resonance angle is highly sensitive to the refractive            and an aqueous solution, as shown in Fig. 1a, the reflectivity
index changes near the surface. By measuring the resonance angle              (power reflection coefficient) Rp is given by24
shift, we can measure molecular interactions on the surface that                                     qffiffiffiffiffiffiffiffiffiffiffiffiffiffiffiffiffiffiffiffiffiffiffiffiffiffiffi  2

changes the local refractive index. Inspired by this principle, we                                  ng 1  ðng sinθi Þ2  na cosθi
                                                                                                                na                             ð1Þ
thought that the molecular interactions induced refractive index                              Rp ¼  qffiffiffiffiffiffiffiffiffiffiffiffiffiffiffiffiffiffiffiffiffiffiffiffiffiffiffi
                                                                                                                ng            2
changes can also be detected on bare glass when the incident                                        ng 1  ðna sinθi Þ þ na cosθi
angle is close to the critical angle. Because the critical angle is also
refractive index dependent, therefore, the critical angle shift               where ng is the refractive index of glass, and na is the refractive
should be a measure of the refractive index change near the glass             index of the aqueous solution. Rp increases with the incident
surface. Indeed, previous studies have shown that 10−6 refractive             angle, and reaches maximum value of 1 at critical angle θc , where
index change can be resolved on the glass-water interface by                                                          !
measuring the reflectivity near the critical angle17. Detection of                                              1 na
                                                                                                       θc ¼ sin                               ð2Þ
particles and hemolysis was also explored with this approach18,19.                                                 ng
However, this method has never been developed into a molecular
interaction detection technique to the best of our knowledge.                 Scanning θi from below to above θc shows that Rp increases faster
Although total internal reflection based methods have been used                as θi approaches θc and finally reaches total internal reflection at
for measuring binding kinetics8,9,12,15, imaging nanoparticles20,             θc (Fig. 1b). The sensitivity of CAR arises from the rapid
and obtaining infrared spectra of molecules and cells21,22, the               reflectivity change (ΔRp) near θc caused by the refractive index
incident light in these methods is set above the critical angle,              change in the aqueous solution near glass surface (Δna) due to
where the reflectivity is saturated and the refractive index sensi-            molecular binding. Since most molecules have higher refractive
tivity is totally lost.                                                       index than water, molecular binding event at the glass surface
   Taking advantage of the refractive index-dependent nature of               usually increases the effective refractive index of the aqueous
the critical angle, we developed a technique called critical angle            solution above glass surface (Δna > 0) and results in right-shift of
reflection (CAR) imaging to measure the molecular interactions                 the curve, which will lower the reflectivity (ΔRp < 0) if θi is
on a glass surface. CAR presents several unique features com-                 fixed at an angle slightly lower than θc . For a given Δna, |ΔRp |
pared to SPR. Firstly, the sensitivity of CAR increases with inci-            becomes larger as the θi gets closer to θc . The experimental results
dent angle and can be higher than SPR as the angle approaches                 were verified by simulation (Supplementary Figure 1). This
the critical angle, allowing CAR to measure small molecules that              unique feature allows us to tune the sensitivity (|ΔRp | /Δna) by
are challenging for SPR. Also, CAR uses bare cover glass, which is            changing θi (Fig. 1c). On the contrary, the sensitivity of SPR is
simpler, more robust, and compatible with fluorescence mea-                    fixed for θi in the normal measurement range (Supplementary
surement than gold-coated cover glass used by SPR, allowing                   Figure 2).
simultaneous measurement of binding kinetics and fluorescence                     To evaluate the performance of CAR as a sensing method, we
or total internal reflection fluorescence. Owing to the similarity in           compared its sensitivity and dynamic range with those of SPR
detection principle, CAR measurements can be readily imple-                   using the same instrument. We used p-polarized light as the
mented in existing SPR setups without the need for extra hard-                incident light in both CAR and SPR for the comparison because
ware. We measured the binding of proteins, nucleic acids, and                 SPR can only be generated by p-polarized light. The sensitivity
small molecules, and performed cell-based measurements to                     and dynamic range are defined as the absolute value of slope and
demonstrate the advantages of CAR on a commercial SPR ima-                    linear range of Rp vs. na plot at given angles (Fig. 1c and
ging setup and a home-built objective-based SPR microscope. We                Supplementary Figure 2), respectively. The units for dynamic
anticipate CAR will broaden the capability of SPR with increased              range and sensitivity are RIU (refractive index unit) and RIU−1.
sensitivity, concurrent fluorescence imaging, glass surface chem-              The results for CAR and SPR are plotted in Fig. 1d. At low angles,
istry, and lower sensor fabrication cost.                                     CAR presents low sensitivity, but the dynamic range can be at

2                 NATURE COMMUNICATIONS | (2021)12:3365 | https://doi.org/10.1038/s41467-021-23730-8 | www.nature.com/naturecommunications
NATURE COMMUNICATIONS | https://doi.org/10.1038/s41467-021-23730-8 ARTICLE
a b 1.0
na
0.8 1.3330
Ligands Transmitted light
Reflectivity
1.3426
0.6
1.3522
Functionalized Evanescent field 0.4
glass surface 1.3618
0.2
p-polarized light θi Reflected light (Rp)
0
Prism Camera 56 58 60 62 64 66
Incident angle (Degree)
c 1.0 v d 0.04 e
Incident angle (Degree) CAR 400 CAR
i
SPR iv SPR
Dynamic range (Δna)
0.8 57.99±0.027
iv 0.03
60.18±0.046 High dynamic range 300
Reflectivity
60.97±0.046 ii
0.6 61.41±0.048
SNR
iii 0.02 200
61.64±0.043 100% BSA v
iii
0.4 ii
0.01 iii
50% BSA 100 ii
0.2 i iv High sensitivity i
v
0 Water 0
0
1.333 1.343 1.353 1.363 0 50 100 150 0 20 40 60 80 100 120
na Sensitivity (|ΔRp|/Δna) Sensitivity (|ΔRp|/Δna)
Fig. 1 Detection principle of CAR. a Experimental setup and surface chemistry. A protein functionalized cover glass is placed on a prism-coupled SPR
imaging setup with index-matching oil. The incident angle θi of a p-polarized light is set at slightly below the critical angle. Upon ligands binding to the
proteins, the intensity of the reflected light changes and is detected by a camera. b Measured reflectivity change as a function of incident angle. The
refractive index (na) on the surface is adjusted by serially adding ethanol to water to make na range from 1.3330 (pure water) to 1.3630 (50% ethanol in
water). c Measured reflectivity as a function of na at five representative incident angles (labeled with i to v) with data obtained from b. The solid lines show
the linear regions (defined by R2 > 0.97, where R2 is the coefficient of determination) of the curves. d Tunable sensitivity and dynamic range of CAR.
The black dots show the sensitivity and dynamic range determined at the five representative angles in c, where the sensitivity and dynamic range are the
slope and the range of the linear regions, respectively. The red star marks the sensitivity and dynamic range of SPR, which is not adjustable. To facilitate
comparison, the refractive index change induced by the binding of a full layer of BSA (100% BSA), half layer of BSA (50% BSA), and pure water (water)
are marked by the dashed lines. The green and blue shadows mark the regions where CAR has high dynamic range and high sensitivity, respectively.
e Measured signal-to-noise ratio (SNR) of SPR and CAR at the five representative angles. Noise is defined as 1 minute of root mean square of baseline
signal. The dots and error bars represent the mean and standard deviation of three measurements.
least two times greater than SPR. At high angles, CAR is five work, and we use the sensitivity obtained from ethanol calibration
times more sensitive than SPR, but the dynamic range is four in the following sections.
times lower. Theoretically, the sensitivity and dynamic range of
CAR approaches infinity and zero, respectively, as the incident
angle reaching the critical angle, however, the accuracy of the Biomolecule detection. To demonstrate the capability of CAR in
incident angle is limited by the diffraction of the incident light, measuring binding kinetics, we first measured the binding of anti-
and thus the exact critical angle is hardly accessible25,26. The BSA to BSA, which is often chosen as a model binding pair in
reduced dynamic range at high angles is still sufficient to measure SPR (Fig. 2a). BSA was immobilized on the surface of a cover
the binding of medium-sized proteins, for example, bovine serum glass (see Methods). Because anti-BSA is a large biomolecule
albumin (BSA, 66 kDa) at up to 25% surface coverage. In between (150 kDa), we tuned CAR sensitivity to medium sensitivity (~25
the low and the high angles, CAR has similar sensitivity and RIU−1, close to SPR) by setting the incident angle at 61.1 degrees.
dynamic range as SPR. We also measured the signal-to-noise In the experiment, different concentrations of anti-BSA were
ratio (SNR) of CAR (Fig. 1e). The incident light was set at five serially injected over the BSA-coated surface (Fig. 2b). The
representative angles, and 1% ethanol was added to water to binding of anti-BSA to BSA increased the refractive index on the
generate a refractive index increase (Supplementary Figure 3). sensing surface. After anti-BSA binding in each cycle, the buffer
The ethanol-induced reflectivity change and baseline fluctuation was introduced to the surface to induce the dissociation of anti-
were defined as the signal and noise, respectively. The maximum BSA from BSA. For ease of comparison with SPR, we converted
SNR of CAR is approximately five times higher than SPR, the refractive index change in CAR (unit: RIU) to resonance unit
suggesting CAR is more sensitive to smaller molecules than SPR. (RU), a unit typically used in SPR, by 1 RU = 10−6 RIU (see
Similar sensitivity and dynamic range can be achieved by CAR Methods). By fitting the CAR response curves to first-order
with s-polarization (see Discussion). In addition to the ethanol binding kinetics, the association rate constant ka, dissociation rate
calibration, which is a standard method in SPR, we also calibrated constant kd, and equilibrium constant KD were determined to be
the sensitivity by coating the sensor surface with a thin polymer (1.2 ± 0.5) × 106 M−1s−1, (1.8 ± 0.2) × 10−3 s−1, and 1.5 ± 0.4 nM,
layer (Supplementary Figure 4). We found approximately two respectively. Similar kinetic constants were obtained by measur-
times difference between the two calibration results, which ing the interaction under low and high CAR sensitivities (Sup-
implies that the Fresnel equation may not be fully accurate when plementary Figure 5), indicating incident angle does not affect the
describing reflectivity of a nanometer-scale non-uniform layer. measurement results. To validate the results, we measured the
Further investigation of this issue is beyond the scope of this binding pair again with SPR on a gold surface modified with BSA.
NATURE COMMUNICATIONS | (2021)12:3365 | https://doi.org/10.1038/s41467-021-23730-8 | www.nature.com/naturecommunications 3ARTICLE NATURE COMMUNICATIONS | https://doi.org/10.1038/s41467-021-23730-8
a b BSA - anti-BSA Buffer
c 600 BSA - anti-BSA Buffer
20 nM
SPR response (RU)
600 ka = (1.2±0.5)×106 M-1s-1 ka = (7.6±1.6)×105 M-1s-1 20 nM
CAR response (RU)
kd = (1.8±0.2)×10-3 s-1 kd = (2.0±0.2)×10-3 s-1
KD = 1.5±0.4 nM 400 KD = 2.8±0.7 nM Buffer
Anti-BSA 400 10 nM Buffer
10 nM
5.0 nM Buffer Buffer
200 2.5 nM Buffer Buffer 5.0 nM
200
2.5 nM
BSA
0
0
0 500 1000 1500 2000 2500 0 500 1000 1500 2000 2500
Time (s) Time (s)
d e 250 nM Buffer f 250 nM
240 125 nM
125 nM Buffer
SPR response (RU)
40
CAR response (RU)
62.5 nM
miRNA-21
idi A
62.5 nM Buffer 160
N
Buffer
ep -cD
n
20 Buffer
Str iotin
tav
cDNA - miRNA-21 80 cDNA - miRNA-21
B
ka = (1.3±0.8)×105 M-1s-1 Buffer ka = (3.1±1.2)×104 M-1s-1
kd = (1.5±0.7)×10-4 s-1 kd = (7.8±0.5)×10-5 s-1
0 KD = 1.2±0.9 nM 0 KD = 2.5±1.0 nM
0 30 60 90 120 0 30 60 90 120 150
Time (min) Time (min)
Fig. 2 Biomolecule detection. a Bovine serum albumin antibody (anti-BSA) binding to bovine serum albumin (BSA). BSA is immobilized on a glass or gold
surface for CAR or SPR measurements. b Measuring anti-BSA—BSA binding kinetics with CAR. The incident angle was set at 61.1 degrees with a sensitivity
of 25 RIU−1. Anti-BSA with different concentrations and buffer were sequentially flowed over the BSA-coated surface. The CAR response (black curve) was
fitted to the first order of kinetics (red curve). Note that 1 RU = 10−6 RIU = 1 pg/mm2 of mass density. c Measuring anti-BSA—BSA-binding kinetics with
SPR. The experimental conditions were the same as the CAR measurement. d MicroRNA-21 (miRNA-21) binding to complementary DNA (cDNA). The
biotinylated cDNA was immobilized on a streptavidin-coated glass or gold surface via streptavidin-biotin conjugation. The miRNA-21—cDNA binding was
measured with CAR (e) and SPR (f), and the curves (black) were fitted to the first-order kinetics (red curves). The CAR incident angle was set at 61.4
degrees with a sensitivity of 50 RIU−1.
By fitting the binding curves (Fig. 2c), the kinetic constants were carbonic anhydrase II (CAII) and its small molecule ligands:
determined, with ka = (7.6 ± 1.6) × 105 M−1 s−1, kd = (2.0 ± furosemide (331 Da), sulpiride (341 Da), and methylsulfonamide
0.2) × 10−3 s−1, and KD = 2.8 ± 0.7 nM. The kinetic constants (95 Da) (Fig. 3a). CAII is an enzyme responsible for the catalysis
obtained from CAR and SPR were close, suggesting CAR as an of CO2 hydration, and is found to be related to glaucoma, altitude
accurate method for binding kinetics measurements. sickness, obesity, and tumor growth28. To perform the
As an additional example, we measured the binding of a measurement, we set θi at 61.6 degrees with a sensitivity of 112
nucleic acid, microRNA-21 (miRNA-21), which is a biomarker RIU−1. CAII was immobilized on a glass surface at 5.8% coverage
for various cancers27, to its complementary DNA (cDNA). The (Supplementary Figure 7), and the small molecules were flowed
molecular weight of miRNA-21 is 7 kDa, much smaller than over the surface. The binding of each small molecule ligand was
proteins, so we set θi at a higher angle (61.4 degrees) to increase measured at several different concentrations and globally fitted to
the sensitivity to ~50 RIU−1. The glass surface was first modified the first-order kinetics. The results are shown in Fig. 3b–d. The
with streptavidin, and then biotinylated cDNA was immobilized small molecules were also measured with SPR on a gold surface
on the surface via biotin–streptavidin conjugation (Fig. 2d). We with 6.5% CAII coverage (Supplementary Figure 7) using
flowed miRNA-21 and buffer sequentially to the surface to the same experimental conditions, but no obvious signal could be
measure the association and dissociation of miRNA-21. The CAR found (Fig. 3e–g). We note that both the glass surface and the
response was recorded, and the kinetic constants were obtained gold surface used for this measurement were modified with a
by fitting the response curves (Fig. 2e). The same interaction was monolayer of protein receptors for a fair comparison.
also measured with SPR, and the results are shown in Fig. 2f. In Modifying a three-dimensional matrix such as dextran can
principle, the SNR of CAR in the experiment should be several further improve the density of the receptors and hence mass
times higher than SPR (Fig. 1e), but the results were not as change per unit area upon ligand binding. Previous studies4 show
expected. One reason was because of the difference in cDNA that the same interactions can be measured with SPR using a
surface coverage on glass and gold. We monitored the dextran-coated gold surface, however, the kinetic rate constants
immobilization of streptavidin and biotinylated cDNA on glass were up to 20 times faster than our CAR results. To investigate
and gold using CAR and SPR, respectively, and found that the the discrepancy, we used the same dextran sensor chip and
cDNA coverage on gold was 3.6 times as much as that on glass measured the small molecule binding again with SPR. The
(Supplementary Figure 6). Another reason for the unexpected dextran chip indeed amplified the binding signal. After fitting the
noise in CAR was that the streptavidin sample had some small kinetics curves, we found that the kinetic rate constants were
aggregates that could not be tightly immobilized on the surface, consistent with our CAR results (Supplementary Figure 8). Next,
which were washed off and tumbling around the surface in the we checked the diffusion within the sample delivery system,
following miRNA-21 measurement. This phenomenon was only because slow sample diffusion to the sensor surface can distort
observed in CAR because CAR is more sensitive to particles in the binding curve and lead to false slower kinetics. We examined
bulk solution (see Discussion). the sample diffusion time by flowing in 1% ethanol solution
(Supplementary Figure 9), which ideally should generate a sudden
change in reflectivity. In reality, the diffusion time was ~5 s, but
Small molecule detection. At higher incident angle close to the
still much faster than the time scale of association (~30 s,
critical angle, the enhanced sensitivity and SNR enable CAR to
Fig. 3b–d). Therefore, it is not likely that the kinetics is slowed
measure smaller molecules that are challenging for SPR. To
down by diffusion. Also, by fitting the equilibrium state of the
address this advantage, we measured the interaction between
4 NATURE COMMUNICATIONS | (2021)12:3365 | https://doi.org/10.1038/s41467-021-23730-8 | www.nature.com/naturecommunicationsNATURE COMMUNICATIONS | https://doi.org/10.1038/s41467-021-23730-8 ARTICLE
O Cl
a O
O O
O
Small molecules S O
HN S O N
H NH2 S NH2
NH2 N
O O
HO
CAII O
Furosemide Sulpiride Methylsulfonamide
(331 Da) (341 Da) (95 Da)
b 9 c d
CAR response (RU)
CAR response (RU)
CAR response (RU)
30 20
Furosemide Sulpiride Methylsulfonamide
ka = (3.9±0.2)×104 M-1s-1 ka = (1.7±0.6)×102 M-1s-1 ka = (1.2±0.6)×102 M-1s-1
6
kd = (5.8±0.2)×10-2 s-1 20 kd = (1.4±0.1)×10-1 s-1 kd = (1.0±0.1)×10-1 s-1
KD = 1.5±0.1 μM KD = (8.0±3.0)×102 μM KD = (8.0±4.2)×102 μM
3 10
10
0
0 0
0 100 200 300 0 100 200 300 0 100 200 300
Time (s) Time (s) Time (s)
e 15 f 15 g 15
Furosemide Sulpiride Methylsulfonamide
SPR response (RU)
SPR response (RU)
SPR response (RU)
10 10 10
5 5 5
0 0 0
0 100 200 300 0 100 200 300 0 100 200 300
Time (s) Time (s) Time (s)
Fig. 3 Measuring the binding kinetics of small molecule ligands to carbonic anhydrase II (CAII). a CAII was immobilized on glass for CAR and gold
surface for SPR measurements. Three different small molecules, furosemide (331 Da), sulpiride (341 Da), and methylsulfonamide (95 Da), were flowed
over the CAII functionalized chip. b–d CAR response curves for furosemide, sulpiride, and methylsulfonamide binding (black curves). The incident angle
was set at 61.6 degrees with a sensitivity of 112 RIU−1. The two arrows mark the starting point of association and dissociation, respectively. The red curves
are global fittings of the data to the first-order binding kinetics. Furosemide concentrations: 234 nM, 469 nM, 938 nM, 1.88 µM, and 3.75 µM; Sulpiride
concentrations: 62.5 µM, 125 µM, 250 µM, 500 µM, and 1.00 mM; Methylsulfonamide concentrations: 156 µM, 312 µM, 625 µM, 1.25 mM, and 2.50 mM.
e–g Same interactions were measured with SPR but no clear response was observed. The CAII surface coverages were 6.5% and 5.8% for the gold and the
glass surfaces, respectively.
interaction (Supplementary Figure 10), which is not affected by glycoproteins increased the surface refractive index and caused
diffusion, KD is determined to be 1.82 µM, 782 µM, and 1.10 mM the SPR signal to increase. After the association process, PBS
for furosemide, sulpiride, and methylsulfonamide, consistent with buffer was flowed in again to induce dissociation of WGA from
the real-time values. Based on the above analysis, we conclude the cells. The average SPR response of 10 cells was fitted to the
that the measured kinetic constants are real, and the discrepancy first-order kinetics, and ka, kd, and KD were determined to be
from the literature value could be due to different CAII protein (2.5 ± 0.1) × 103 M−1 s−1, (1.3 ± 0.1) × 10−4 s−1, and 53 ± 1 nM,
sources. respectively. The WGA was labeled with Alexa Fluor 488,
allowing us to verify the binding using fluorescence. Three
CAR imaging of glycoprotein—lectin interaction on cells. SPR fluorescence images were captured at different phases of the
imaging is known for measuring the binding kinetics between cell binding process: at the baseline, after association, and after
membrane protein and ligand directly on the cells without the dissociation, respectively (Fig. 4d). The fluorescence change,
need of protein extraction and purification6,29. Here, we although weak, confirmed that the SPR signal was owing to the
demonstrate that CAR imaging is also capable of cell-based binding.
measurements. We studied wheat germ agglutinin (WGA) as an Next, we used CAR imaging to repeat the glycoprotein–WGA
example and measured its interaction with glycoproteins on HeLa binding measurement. The cells were cultured on a glass surface,
cells. WGA is a lectin that can specifically bind to N-acet- and the bright-field image and the corresponding CAR image of 9
ylglucosamine structures in the sugar chain of glycoproteins. cells are shown in Fig. 4e. The cells show dark patterns because
Investigating the interactions between lectin and glycoprotein is they have a higher refractive index than the background. θi was
important for understanding the role of glycoprotein in many set at ~61.0 degrees with similar sensitivity to SPR. Kinetic
biological processes, including cell recognition, adhesion, growth, constants for WGA were determined from the average CAR
and differentiation30. response of the 9 cells, with ka = (6.0 ± 0.1) × 103 M−1 s−1, kd =
We first used SPR to measure glycoprotein–WGA interaction (2.6 ± 0.1) × 10−4 s−1, and KD = 42 ± 1 nM, respectively (Fig. 4f
on fixed HeLa cells (Fig. 4a). The cells were cultured on a gold and Supplementary Movie 2). The minor disagreement in kinetic
surface and fixed right before the measurement (Fig. 4b). We constants might reflect different surfaces and different light-
flowed phosphate-buffered saline (PBS) buffer over the surface to sensing depth between SPR and CAR (more in Discussion).
establish a baseline and then introduced 50 μg/mL WGA (Fig. 4c Fluorescence images captured during the CAR measurement
and Supplementary Movie 1). The binding of WGA to the confirmed the binding of WGA (Fig. 4g). Notably, the
NATURE COMMUNICATIONS | (2021)12:3365 | https://doi.org/10.1038/s41467-021-23730-8 | www.nature.com/naturecommunications 5ARTICLE NATURE COMMUNICATIONS | https://doi.org/10.1038/s41467-021-23730-8
a Fluorescently labeled WGA a b 0
CAR response (RU)
Glycoprotein
HeLa cell SH-EP1_α4β2 cell ACh
Glass or gold surface -20 ACh
nAChR
SH-EP1_α4β2 Buffer
b BF 1 SPR c 3600 -40 ka = (3.4±0.2)×104 M-1s-1
SPR response (RU)
2 4 WGA Buffer -3
kd = (1.5±0.1)×10 s -1
3
5 Glass or gold surface KD = 45±2 nM
6 2400
7 10 0 100 200
9 Time (s)
8
1200
d
c 0
d 1200
FL (0 s) (600 s) (2000 s)
CAR response (RU)
SPR response (RU)
ka = (2.5±0.1)×103 M-1s-1 SH-EP1_α4β2
0
kd = (1.3±0.1)×10-4 s-1 800
KD = 53±1 nM ACh Buffer
-1200 -20
Intensity 0 500 1000 1500 ACh Buffer 400
100 1550 3000
Time (s)
0
-40 SH-EP1_WT
e BF 1 CAR f 600
WGA Buffer -400
CAR response (RU)
2 5 0 100 200 300 400 0 100 200 300 400
3 4 400 Time (s) Time (s)
6 8 9
7 200 Fig. 5 Measuring acetylcholine binding to nicotinic acetylcholine receptor
g FL (0 s) (600 s) (2000 s)
(nAChR) on SH-EP1_α4β2 cells. a SH-EP1_α4β2 cells were grown on a
0 ka = (6.0±0.1)×103 M-1s-1 glass or gold surface for CAR or SPR measurements. The cells were fixed
kd = (2.6±0.1)×10-4 s-1
KD = 42±1 nM
with 4% paraldehyde before the measurement. b Acetylcholine (ACh)
Intensity -200 binding to SH-EP1_α4β2 cells measured by CAR. CAR angle was set at 61.6
100 15050 30000 0 500 1000 1500
Time (s)
degrees with a sensitivity of 112 RIU−1. The binding kinetic curves (black)
were obtained by averaging the CAR response of seven cells and globally
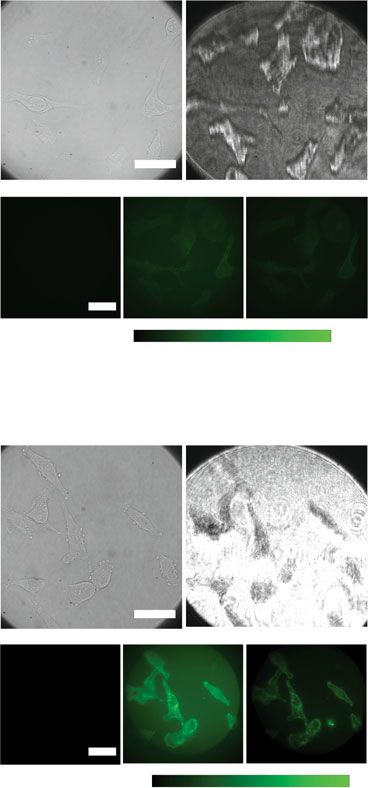
Fig. 4 Measuring wheat germ agglutinin (WGA) binding to glycoproteins fitted to the first-order kinetics (red) (see Supplementary Figure 12b for the
on fixed HeLa cells. a HeLa cells were grown on a glass or gold surface for response of individual cells). Acetylcholine concentrations: 25 nM, 100 nM,
CAR or SPR measurements. The cells were fixed with 4% paraldehyde prior and 200 nM. c Control experiments using wild-type SH-EP1 cells (SH-
to measurements. Alexa Fluor 488-labeled WGA was flowed over the cells EP_WT), which have no nAChR. Acetylcholine and PBS buffer flowed to the
and allowed to bind to the glycoproteins on the cell membrane. b Bright- cells as indicated by the arrows. No clear CAR response was observed (see
field (BF) and SPR images of 10 cells on gold surface. c Glycoprotein–WGA Supplementary Figure 12d for individual cells). Acetylcholine
binding kinetics measured by SPR. WGA concentration was 50 μg/mL. The concentrations: 50 nM, 100 nM, and 200 nM. d Measuring acetylcholine
black curve and gray shadows are the average SPR signal and standard binding to SH-EP1_α4β2 cells using SPR. No response was observed due to
deviation of the 10 cells (see Supplementary Figure 11a and Supplementary insufficient sensitivity of SPR (see Supplementary Figure 12f for individual
Movie 1 for details), respectively. The red curve is the fitting of the data to cells). Acetylcholine concentrations: 50 nM, 100 nM, and 200 nM.
the first-order kinetics. d Fluorescence (FL) images of the cells captured
before WGA binding (0 s), after WGA binding (600 s), and after WGA responsible for neurotransmission and drug addiction32. nAChR
dissociation (2000 s). Exposure time, 0.1 s. e BF and CAR images of 9 cells was expressed on brain neuroblastoma SH-EP1 cells by trans-
on the glass surface. f Glycoprotein–WGA binding kinetics measured by fecting the cells with human α4β2 receptor (SH-EP1_α4β2)33. In
CAR. WGA concentration was 50 μg/mL. The black curve and gray this experiment, we set θi at high-sensitivity region (61.6 degrees),
shadows are the average CAR signal and standard deviation of 8 out of the and flowed acetylcholine solution over the cells (Fig. 5a). The
9 cells (see Supplementary Figure 11b and Supplementary Movie 2 for averaged CAR responses of several cells were fitted globally as
details), respectively. The red curve is the fitting of the data to the first- shown in Fig. 5b. The binding of acetylcholine-induced negative
order kinetics. g Fluorescence images of the cells captured before WGA change to the refractive index on the cell membrane. Although
binding (0 s), after WGA binding (600 s), and after WGA dissociation the binding of acetylcholine added mass to the surface, the
(2000 s). Exposure time, 0.1 s. All the scale bars represent 50 μm. The binding also triggered cell membrane deformation and associated
WGA measurements using SPR or CAR were repeated with new sensor mass movement33,34, which may reduce the effective refractive
chips and cells twice, which showed similar results. index on the sensor surface (more in Discussion). The kinetic
constants were close to those measured by a cellular membrane
fluorescence intensity on glass is over 30 times stronger than that deformation detection method33,34. To verify that the CAR signal
on the gold surface, which is expected because gold film obstructs was indeed due to acetylcholine binding, we performed a control
light transmission and quenches the fluorescence. For this reason, experiment using wild-type SH-EP1 cells, which do not have
we believe CAR is more compatible with fluorescence than SPR, nAChR. The CAR response was negligible (Fig. 5c). The
and suitable for measuring biological samples that need acetylcholine–nAChR interaction was also measured using SH-
simultaneous fluorescent labeling. EP1_α4β2 cells with SPR, which showed no measurable response
due to insufficient sensitivity (Fig. 5d).
CAR imaging of ion channel-small molecule interaction on
cells. Most drugs are small molecules, and over 50% drug targets Discussion
are membrane proteins31. SPR imaging can measure interactions CAR presents several technical advances compared with SPR in
directly on cells, but the sensitivity is inadequate for small terms of tunable sensitivity and dynamic range, fluorescence
molecule ligands. This weakness can be compensated by CAR capability, and robust glass sensor surface. In this section, we
owing to its tunable sensitivity. To demonstrate this capability, we further explore the difference between CAR and SPR and discuss
measured the binding kinetics between acetylcholine (182 Da), a the potential benefits and limitations of CAR.
small molecule neurotransmitter, and nicotinic acetylcholine CAR has a deeper sensing range than SPR, which can be
receptor (nAChR), an ion channel membrane protein that is explained by the imaging principles of SPR and CAR. SPR occurs
6 NATURE COMMUNICATIONS | (2021)12:3365 | https://doi.org/10.1038/s41467-021-23730-8 | www.nature.com/naturecommunicationsNATURE COMMUNICATIONS | https://doi.org/10.1038/s41467-021-23730-8 ARTICLE
a BF CAR b BF SPR Another advantage of CAR over SPR is the broader selection of
Differential Differential light wavelength. SPR normally uses gold film and incident light
with wavelength longer than 600 nm to generate SPR. On the
contrary, CAR is compatible with any wavelength in the visible
range. In practice, shorter wavelength (such as green/blue light)
can be employed to achieve better spatial resolution and shorter
Ligands penetration depth, which reduces noise from the solution back-
c
ground. UV light also could be used to further improve the spatial
Sensing depth
Cell after binding resolution and sensitivity, as proteins and nucleic acids absorb
lights in the UV range and the signal will be boosted37. However,
CAR
Cell before binding
the optics and the camera also need to be UV compatible, and the
UV light may cause damage to the sample.
SPR
Unlike SPR which requires p-polarized light, CAR is not lim-
ited by light polarization. Both p- and s-polarized light present
Fig. 6 Sensing depth of CAR and SPR. a Bright-field (left) and differential similar sensitivity and dynamic range in CAR (Supplementary
CAR (right) images of a live single cell. The differential CAR image was Figure 13), indicating CAR measurements can be performed
obtained by subtracting two consecutive frames in an image sequence using either or both polarizations at the same time. This cap-
recorded at 10 frames per second. The white line marks the outline of the ability may allow CAR to measure polarization-sensitive samples
cell. The parabolic patterns within the cell (marked by the red square) are and couple with fluorescence anisotropy to determine the
generated by the motion of organelles. See Supplementary Movie 3 for orientations and dynamics of molecules.
details. About 90% of the cells imaged with CAR showed such patterns. The incident light in SPR imaging setup may not illuminate the
b Bright-field (left) and differential SPR images of a live single cell. The surface at a perfectly uniform angle, which also varies with dif-
images were captured and processed under the same condition as in ferent instruments. The slight angle difference can barely affect
a. Organelle motion was not revealed by SPR for the ~20 cells imaged. Scale the sensitivity of SPR because SPR has constant sensitivity near
bars in a and b represent 10 µm. c Schematic picture showing sensing a cell the SPR angle (Supplementary Figure 9a). For CAR, however, the
with CAR and SPR. SPR senses the sample with the surface-confined sensitivity is strongly dependent on the incident angle, and the
evanescent field and only the bottom section of the sample (several imperfect illumination could lead to a non-uniform surface sen-
hundred nanometers) can be imaged. CAR has a portion of transmitted sitivity (Supplementary Figure 9c). We calibrated the CAR sen-
light additional to the much deeper evanescent field, which enables CAR to sitivity of our prism-based setup with 1% ethanol and found that
detect the binding-induced deformation of the whole cell. the sensitivity at different regions could differ by up to four
times. The spatial sensitivity distribution stems from imperfect
above the critical angle, and the evanescent field is coupled by the collimation of light, because the distribution pattern was inde-
excited surface plasmon, which concentrates the field in the pendent of different sensor chips and samples (Supplementary
vicinity of the surface (100–200 nm). In CAR, the evanescent field Figure 9e). The microscope-based setup showed a more uniform
is much less confined to the surface in the absence of surface sensitivity because of tunable collimation of incident light and
plasmon. Also, the incident light is below the critical angle, smaller illumination area. For this reason, we always use regions
allowing a portion of the light to go beyond the evanescent field with similar sensitivities when comparing CAR signals in
range to further distances. An observation in our experiment this work.
shows a good example. We found many moving parabolic pat- The detection limit is determined by the noise level and sen-
terns inside live cells under CAR illumination, which are orga- sitivity. For CAR at high angle, the noise level is 1.7 × 10⁻⁴ (unit:
nelles such as mitochondria (Fig. 6a and Supplementary reflectivity) (Supplementary Figure 3d) and the sensitivity is 112
Movie 3)35,36. The parabolic shape arises from the interference RIU−1 (Fig. 1d). The noise thus corresponds to 1.5 × 10⁻⁶ RIU,
between the evanescent wave and scattered light from the or 1.5 RU, or ~1.5 pg/mm2 in mass density38. Similarly, the noise
organelles5,35. However, such patterns did not appear under SPR for SPR is determined to be 2.4 pg/mm2. The sensitivity is
illumination (Fig. 6b), because the organelles are beyond the intrinsic property of CAR (at a specific angle) and SPR and could
detection range of SPR. not be changed for a given instrument. Therefore, the only way to
The deeper sensing range also reveals cell deformation caused lower detection limit is to reduce noise. In an ideal scenario, the
by ligand binding (Fig. 6c)33,34. In fact, the CAR signal in WGA smallest noise for optical sensors is the shot noise, which is owing
binding (Fig. 4f) and acetylcholine binding (Fig. 5b) reflects to the quantum nature of light. To reach shot noise limit, all other
surface refractive index change caused by a combined effect of types of noise need to be well under control, such as light source
bound ligands induced surface mass increase and dynamic mass noise and environmental and system mechanical noise. We cal-
redistribution owing to binding-induced cell deformation. In both culated the theoretical shot noise for our prism-based setup,
cases, ligand binding increases the surface refractive index which is 25 times lower than the measured noise (Supplementary
because the refractive index of the ligand molecules is higher than Figure 14). The identified major noise source is mechanical noise
the buffer solution, and cell deformation decreases the surface from the system cooling fans. Therefore, over an order of mag-
refractive index because the mass center of the cell moves away nitude lower detection limit could be reached if the system
from the surface. The mass of WGA induces more refractive mechanical noise is reduced with a quiet cooling design.
index change than cell deformation, thus the net signal is positive. We have developed a label-free optical sensing method called
Acetylcholine is a small molecule and the signal is dominated by CAR imaging to quantify molecular binding kinetics on a cover
cell deformation, so the net CAR signal is negative. glass surface. CAR measures the reflectivity change near the cri-
For molecular interaction studies, the longer sensing depth tical angle in response to molecular binding-induced refractive
of CAR could pick up background noises from impurities in index changes on the sensor surface. The sensitivity and dynamic
the sample, because the motion of particles or aggregates range of CAR are tunable by varying the incident angle of light,
in the sample solution will generate noise to the CAR signal which allows optimizing the measurement for ligands with dif-
(Fig. 2e and Supplementary Figure 6b) but has minimal impact ferent sizes in both biomolecular and cell-based studies. CAR also
to SPR. has a longer vertical sensing range than SPR owing to deeper light
NATURE COMMUNICATIONS | (2021)12:3365 | https://doi.org/10.1038/s41467-021-23730-8 | www.nature.com/naturecommunications 7ARTICLE NATURE COMMUNICATIONS | https://doi.org/10.1038/s41467-021-23730-8
penetration depth. Compared with the gold-coated SPR sensor 2.2 µM CAII, or 6 µM streptavidin for 1 hour. Next, 20 mM ethanolamine was used
chips, the glass CAR sensor chips require no surface fabrication to quench the unreacted sites for 5 min, and 1 mg/mL BSA was applied to the CAII
and streptavidin-coated chips for 10 min to block non-specific sites. cDNA was
and are fully compatible with fluorescence imaging, providing the immobilized on the streptavidin-coated surface by incubation in 33 µM
capability of simultaneous fluorescence imaging. Broader wave- biotinylated cDNA solution for one hour.
length and polarization selection of CAR may also lead to new
applications. Since CAR imaging measurements can be per- Cell culture. HeLa and SH-EP1 cells were obtained from the American Type
formed on an SPR imaging setup with minimal efforts, we Culture Collection, and SH-EP1_α4β2 cells were provided as a gift from Dr. Jie
anticipate CAR imaging will become a useful addition to SPR Wu39. The cells were cultured in Dulbecco’s modified eagle medium (Lonza) with
10% fetal bovine serum (Invitrogen) and 1% penicillin and streptomycin in a
imaging in terms of expanding the capability in small molecule humidified incubator at 37°C with 5% CO2. The cells were harvested at 75%
detection, cell-based sensing, and simultaneous fluorescence confluence, transferred to glass or gold-coated glass chips, and cultured overnight
imaging. before experiments. The glass and gold surfaces were pretreated with 0.3 mg/mL
collagen type IV (Sigma-Aldrich) to improve cell attachment to the surface. For
experiments using fixed cells, the cells were fixed with 4% paraformaldehyde
Methods solution (Santa Cruz Biotechnology) for 20 min, washed with PBS, and immedi-
Experimental setup. The SPR and CAR measurements for principle demonstra- ately placed on an instrument for measurement.
tion (Fig. 1) and protein, miRNA, and small molecule detections (Figs. 2–3)
were conducted using a commercial prism-based SPR imaging system (SPRm
200, Biosensing Instrument Inc., Tempe, Arizona) with a 690 nm, 1 mW laser, Simulation and data processing. WinSpall (http://res-tec.de/downloads.html,
and a custom installed USB3 CMOS camera (MQ003MG-CM, XIMEA, Germany). Resonant Technologies GmbH, Germany) was used to simulate the reflectivity as a
The incident angle is controlled via a motor attached to the light source with function of incident angle for CAR and SPR.
an accuracy of 5.5 millidegrees and scanning range from 40 to 76 degrees. The For all SPR and CAR detections using the prism-based setup, the images were
system has ×20 magnification. Samples were delivered to the system via an initially recorded at 100 frames per second and then averaged over every one
autosampler (BI autosampler, Biosensing Instrument Inc.). The SPR instrument second by software (ImageAnalysis, Biosensing Instrument Inc.). For SPR and CAR
can be directly used for CAR measurement without any modification. The only measurements on the microscope-based setup, the images were recorded at 10
difference is using a glass sensor chip instead of the gold-coated glass chip and frames per second using HCImageLive software and averaged over every one
lowering the incident angle from ~70 degrees (SPR angle) to ~61 degrees (critical second. The averaged CAR and SPR images were processed with Fiji40 to obtain
angle). reflectivity change. Then reflectivity was converted to RIU using the ethanol
All the cell-related experiments including CAR, SPR, transmitted and calibration curves (Fig. 1c and Supplementary Figure 2b). The unit RIU was finally
fluorescence measurements (Figs. 4–6) were performed on an objective-based SPR converted to a RU by 1 RU = 10−6 RIU, which is often used in SPR sensorgrams
microscope setup, which consisted of an inverted microscope (Olympus IX-81) and for result presentation. If needed, RU can be used to estimate mass density or
a ×60 (NA 1.49) oil-immersion objective. The light source for CAR and SPR surface coverage of the molecule being measured (1 RU~1 pg/mm2)38. After unit
imaging was a superluminescent light-emitting diode (SLED) (SLD-260-HP-TOW- conversion, the response curve fitting and binding kinetics constant calculation
PD-670, Superlum, Ireland) with 670 nm wavelength and 1 mW power set by a were carried out with ImageAnalysis and Scrubber (BioLogic Software). All data
SLED current driver (PILOT4-AC, Superlum). The SLED was mounted on a were plotted using Origin and MATLAB.
translation stage (PT3, Thorlabs) with a motorized actuator (Z825B, Thorlabs) for
adjusting incident angle. The angle accuracy was determined to be ~10 Reporting summary. Further information on research design is available in the Nature
millidegrees. The light source for transmitted and fluorescence imaging were the Research Reporting Summary linked to this article.
stocking halogen and mercury lamp of the microscope, respectively. The excitation
and emission wavelength used for imaging Alexa Fluor 488 labelled WGA were
488 nm and 518 nm, respectively, and the power density on the sample was Data availability
~0.1 mW/cm2. A CMOS camera (ORCA-Flash 4.0, Hamamatsu) was used to The data that support the findings of this study are available in Dryad Digital Repository
record the images. A gravity-based drug perfusion system (SF-77B, Warner (https://doi.org/10.5061/dryad.47d7wm3d0).
Instruments, Connecticut) was used for delivering analytes to the cells.
Code availability
Materials. Cover glass (no.1) for CAR measurements was purchased from VWR. The codes that support the findings of this study are available from the corresponding
The cover glass was coated with 1.5 nm Cr followed by 43 nm gold using an e-beam author upon reasonable request.
evaporator for SPR measurements. Dextran-coated SPR sensor chips were pur-
chased from Biosensing Instrument Inc. (3-glycidyloxypropyl)trimethoxylsilane,
Received: 22 October 2020; Accepted: 6 May 2021;
N-hydroxysulfosuccinimide sodium salt (NHS), N-(3-dimethylaminopropyl)-N
′-ethylcarbodiimide hydrochloride (EDC), O-(2-Carboxyethyl)-O′-(2-mercap-
toethyl)heptaethylene glycol (SH-PEG8-COOH), BSA, carbonic anhydrase lyso-
zyme II from bovine erythrocytes (CAII), furosemide, sulpiride,
methylsulfonamide, and acetylcholine perchlorate were purchased from Sigma-
Aldrich. Mouse anti-BSA was purchased from MyBioSource and diluted with PBS
335 times to reach a final concentration of 20 nM. MicroRNA-21 (5′-UAG- References
CUUAUCAGACUGAUGUUGA-3′) and biotinylated cDNA with A5 spacer (5′ 1. Zhou, X. L., Yang, Y., Wang, S. & Liu, X. W. Surface plasmon resonance
biotin-AAAAATCAACATCAGTCTGATAAGCTA-3′) were purchased from microscopy: from single‐molecule sensing to single‐cell imaging. Angew.
Integrated DNA Technologies. Streptavidin, methyl-PEG4-thiol (MT(PEG)4), and Chem. Int. Ed. 59, 1776–1785 (2020).
WGA with Alexa Fluor 488 tag were purchased from Thermo Fisher Scientific. PBS 2. Patching, S. G. Surface plasmon resonance spectroscopy for characterisation of
was purchased from Corning. Deionized water with a resistivity of 18.2 MΩ·cm was membrane protein–ligand interactions and its potential for drug discovery.
used in all experiments. Biochim. Biophys. Acta 1838, 43–55 (2014).
3. Bellassai, N., D’Agata, R., Jungbluth, V. & Spoto, G. Surface plasmon
resonance for biomarker detection: advances in non-invasive cancer diagnosis.
Surface functionalization. The gold surface was rinsed with ethanol and water
for three times and then annealed with hydrogen flame. The cleaned chips were Front. Chem. 7, 570 (2019).
incubated in 0.2 mM SH-PEG8-COOH and 0.2 mM MT(PEG)4 in PBS overnight. 4. Myszka, D. G. Analysis of small-molecule interactions using Biacore S51
Then the -COOH groups were activated by incubating in a mixture of 50 mM NHS technology. Anal. Biochem. 329, 316–323 (2004).
and 200 mM EDC for 20 min. In all, 5 µM BSA, 2.2 µM CAII, or 6 µM streptavidin 5. Wang, S. et al. Label-free imaging, detection, and mass measurement of single
was applied to the surface immediately and incubated for one hour. The remaining viruses by surface plasmon resonance. Proc. Natl Acad. Sci. 107, 16028–16032
activated sites were quenched with 20 mM ethanolamine for 10 min. Finally, the (2010).
CAII and streptavidin functionalized surfaces were incubated with 1 mg/mL BSA 6. Wang, W. et al. Label-free measuring and mapping of binding kinetics
solution to block non-specific binding sites. To immobilize cDNA on the surface, of membrane proteins in single living cells. Nat. Chem. 4, 846–853
33 µM biotinylated cDNA was applied to the streptavidin functionalized surface (2012).
and incubated for one hour. 7. Syal, K. et al. Plasmonic imaging of protein interactions with single bacterial
The glass chip was rinsed with ethanol and water three times. Then the chips cells. Biosens. Bioelectron. 63, 131–137 (2015).
were dried with N2, treated with oxygen plasma, and incubated in 1% (3- 8. Liu, Q. et al. Mach–Zehnder interferometer (MZI) point-of-care system for
glycidyloxypropyl) trimethoxylsilane in isopropanol overnight. After rinsed with rapid multiplexed detection of microRNAs in human urine specimens.
isopropanol and DI water, the chips were immediately incubated with 5 µM BSA, Biosens. Bioelectron. 71, 365–372 (2015).
8 NATURE COMMUNICATIONS | (2021)12:3365 | https://doi.org/10.1038/s41467-021-23730-8 | www.nature.com/naturecommunicationsNATURE COMMUNICATIONS | https://doi.org/10.1038/s41467-021-23730-8 ARTICLE
9. Huertas, C. S., Fariña, D. & Lechuga, L. M. Direct and label-free quantification 34. Guan, Y. et al. Kinetics of small molecule interactions with membrane
of Micro-RNA-181a at attomolar level in complex media using a proteins in single cells measured with mechanical amplification. Sci. Adv. 1,
nanophotonic biosensor. ACS Sens. 1, 748–756 (2016). e1500633 (2015).
10. Shah, N. B. & Duncan, T. M. Bio-layer interferometry for measuring kinetics 35. Ma, G. et al. Optical imaging of single-protein size, charge, mobility, and
of protein-protein interactions and allosteric ligand effects. J. Vis. Exp. 18, binding. Nat. Commun. 11, 4768 (2020).
e51383-e51383 (2014). 36. Yang, Y. et al. Label-free tracking of single organelle transportation in cells
11. Vahala, K. J. Optical microcavities. Nature 424, 839–846 (2003). with nanometer precision using a plasmonic imaging technique. Small 11,
12. Ghasemi, F. et al. Multiplexed detection of lectins using integrated glycan- 2878–2884 (2015).
coated microring resonators. Biosens. Bioelectron. 80, 682–690 (2016). 37. Zeskind, B. J. et al. Nucleic acid and protein mass mapping by live-cell deep-
13. Baaske, M. D., Foreman, M. R. & Vollmer, F. Single-molecule nucleic acid ultraviolet microscopy. Nat. Methods 4, 567–569 (2007).
interactions monitored on a label-free microcavity biosensor platform. Nat. 38. Biacore AB. Sensor Surface Handbook, BR-1005-71 Edition AB (1998).
Nanotechnol. 9, 933 (2014). 39. Wu, J. et al. β-amyloid directly inhibits human α4β2-nicotinic acetylcholine
14. Wang, G. et al. A combined reflectometry and quartz crystal microbalance receptors heterologously expressed in human SH-EP1 cells*. J. Biol. Chem.
with dissipation setup for surface interaction studies. Rev. Sci. Instrum. 79, 279, 37842–37851 (2004).
075107 (2008). 40. Schindelin, J. et al. Fiji: an open-source platform for biological-image analysis.
15. Ralin, D. W. et al. Kinetic analysis of glycoprotein–lectin interactions by label- Nat. Methods 9, 676–682 (2012).
free internal reflection ellipsometry. Clin. Proteom. 4, 37–46 (2008).
16. Chen, Y., Liu, J., Yang, Z., Wilkinson, J. S. & Zhou, X. Optical biosensors based
on refractometric sensing schemes: a review. Biosens. Bioelectron. 144, 111693 Acknowledgements
(2019). We acknowledge financial support from the National Institute of General Medical Sci-
17. Garcı ̀a-Valenzuela, A., Peña-Gomar, M., Garcı ̀a-Segundo, C. & Flandes- ences of the National Institutes of Health under Award Number R01GM124335. We
Aburto, V. Dynamic reflectometry near the critical angle for high-resolution thank Dr. Pengfei Zhang for stimulus discussions. We also thank the reviewers (parti-
sensing of the index of refraction. Sens. Actuators B: Chem. 52, 236–242 cularly professor Augusto Garcia-Valenzuela) for constructive review comments.
(1998).
18. Márquez-Islas, R. et al. Optical device and methodology for optical sensing of Author contributions
hemolysis in hypotonic media. Meas. Sci. Technol. 31, 095701 (2020). S.W. conceived and supervised the project. G.M. designed the experiments. G.M. and R.
19. Peña-Gomar, M. C., González-González, M. L., García-Valenzuela, A., Antó- L. carried out the experiments and analyzed the data. Z.W. fabricated the gold chips. G.
Roca, J. & Pérez, E. Monitoring particle adsorption by use of laser M. and S.W. wrote the paper.
reflectometry near the critical angle. Appl. Opt. 43, 5963–5970 (2004).
20. Li, M. et al. Total internal reflection-based extinction spectroscopy of single
nanoparticles. Angew. Chem. Int. Ed. 58, 572–576 (2019). Competing interests
21. Kazarian, S. G. & Chan, K. L. Applications of ATR-FTIR spectroscopic A US provisional patent application (63/122.687) has been filed by Arizona Board of
imaging to biomedical samples. Biochim Biophys. Acta 1758, 858–867 (2006). Regents on behalf of Arizona State University based on an early draft of this article.
22. Andrew Chan, K. L. & Kazarian, S. G. Attenuated total reflection Fourier- Inventors: S.W., G.M., and R.L.
transform infrared (ATR-FTIR) imaging of tissues and live cells. Chem. Soc.
Rev. 45, 1850–1864 (2016).
23. Steiner, G. Surface plasmon resonance imaging. Anal. Bioanal. Chem. 379,
Additional information
Supplementary information The online version contains supplementary material
328–331 (2004).
available at https://doi.org/10.1038/s41467-021-23730-8.
24. Born, M. & Wolf, E. Principles of optics: electromagnetic theory of propagation,
interference and diffraction of light. 7th Edn. (Cambridge University Press,
Correspondence and requests for materials should be addressed to S.W.
1999).
25. García-Valenzuela, A., Peña-Gomar, M. & Fajardo-Lira, C. Measuring and Peer review information Nature Communications thanks Augusto García Valenzuela
sensing a complex refractive index by laser reflection near the critical angle. and the other anonymous reviewer(s) for their contribution to the peer review of this
Optical Eng. 41, 1704–1716 (2002). work. Peer reviewer reports are available.
26. Peña-Gomar, M. C. & García-Valenzuela, A. Reflectivity of a Gaussian beam
near the critical angle with external optically absorbing media. Appl. Opt. 39, Reprints and permission information is available at http://www.nature.com/reprints
5131–5137 (2000).
27. Feng, Y.-H. & Tsao, C.-J. Emerging role of microRNA-21 in cancer. Biomed.
Publisher’s note Springer Nature remains neutral with regard to jurisdictional claims in
Rep. 5, 395–402 (2016).
published maps and institutional affiliations.
28. Krishnamurthy, V. M. et al. Carbonic anhydrase as a model for biophysical
and physical-organic studies of proteins and protein-ligand binding. Chem.
Rev. 108, 946–1051 (2008).
29. Zhang, F. et al. Quantification of epidermal growth factor receptor expression Open Access This article is licensed under a Creative Commons
level and binding kinetics on cell surfaces by surface plasmon resonance Attribution 4.0 International License, which permits use, sharing,
imaging. Anal. Chem. 87, 9960–9965 (2015). adaptation, distribution and reproduction in any medium or format, as long as you give
30. Ghazarian, H., Idoni, B. & Oppenheimer, S. B. A glycobiology review: appropriate credit to the original author(s) and the source, provide a link to the Creative
carbohydrates, lectins and implications in cancer therapeutics. Acta Commons license, and indicate if changes were made. The images or other third party
Histochem. 113, 236–247 (2011). material in this article are included in the article’s Creative Commons license, unless
31. Santos, R. et al. A comprehensive map of molecular drug targets. Nat. Rev. indicated otherwise in a credit line to the material. If material is not included in the
Drug Discov. 16, 19–34 (2017). article’s Creative Commons license and your intended use is not permitted by statutory
32. Albuquerque, E. X., Pereira, E. F. R., Alkondon, M. & Rogers, S. W. regulation or exceeds the permitted use, you will need to obtain permission directly from
Mammalian nicotinic acetylcholine receptors: from structure to function. the copyright holder. To view a copy of this license, visit http://creativecommons.org/
Physiol. Rev. 89, 73–120 (2009). licenses/by/4.0/.
33. Zhang, F. et al. Label-free quantification of small-molecule binding to
membrane proteins on single cells by tracking nanometer-scale cellular
membrane deformation. ACS Nano 12, 2056–2064 (2018). © The Author(s) 2021
NATURE COMMUNICATIONS | (2021)12:3365 | https://doi.org/10.1038/s41467-021-23730-8 | www.nature.com/naturecommunications 9You can also read