Profiling variable-number tandem repeat variation across populations using repeat-pangenome graphs - Nature
←
→
Page content transcription
If your browser does not render page correctly, please read the page content below
ARTICLE
                  https://doi.org/10.1038/s41467-021-24378-0                OPEN

                  Profiling variable-number tandem repeat variation
                  across populations using repeat-pangenome
                  graphs
                  Tsung-Yu Lu          1,   The Human Genome Structural Variation Consortium* & Mark J. P. Chaisson                                      1✉
1234567890():,;

                  Variable number tandem repeats (VNTRs) are composed of consecutive repetitive DNA with
                  hypervariable repeat count and composition. They include protein coding sequences and
                  associations with clinical disorders. It has been difficult to incorporate VNTR analysis in
                  disease studies that use short-read sequencing because the traditional approach of mapping
                  to the human reference is less effective for repetitive and divergent sequences. In this work,
                  we solve VNTR mapping for short reads with a repeat-pangenome graph (RPGG), a data
                  structure that encodes both the population diversity and repeat structure of VNTR loci from
                  multiple haplotype-resolved assemblies. We develop software to build a RPGG, and use the
                  RPGG to estimate VNTR composition with short reads. We use this to discover VNTRs with
                  length stratified by continental population, and expression quantitative trait loci, indicating
                  that RPGG analysis of VNTRs will be critical for future studies of diversity and disease.

                  1 Department of Quantitative and Computational Biology, University of Southern California, Los Angeles, CA, USA. *A list of authors and their affiliations

                  appears at the end of the paper. ✉email: mchaisso@usc.edu

                  NATURE COMMUNICATIONS | (2021)12:4250 | https://doi.org/10.1038/s41467-021-24378-0 | www.nature.com/naturecommunications                                1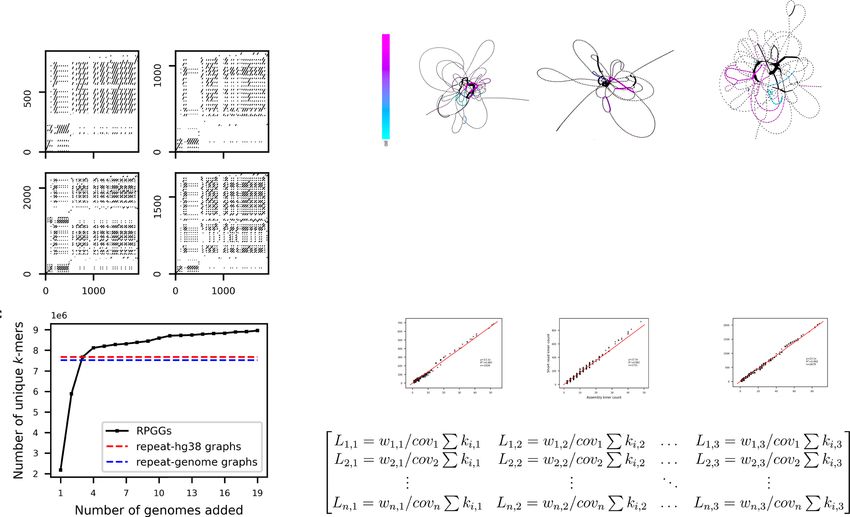
ARTICLE                                                                 NATURE COMMUNICATIONS | https://doi.org/10.1038/s41467-021-24378-0

T
       he human genome is composed of roughly 3% simple                         Here, we propose the representation of human VNTRs as a
       sequence repeats (SSRs)1, loci composed of short, tandemly            repeat-pangenome graph (RPGG), that encodes both the repeat
       repeated motifs. These sequences are classified by motif               structure and sequence diversity of VNTR loci. The most straight-
length into short tandem repeats (STRs) with a motif length of six           forward approach that combines a pangenome graph and a repeat
nucleotides or fewer, and variable-number tandem repeats                     graph is a de Bruijn graph, and was the basis of one of the earliest
(VNTRs) for repeats of longer motifs. SSRs are prone to hyper-               representations of a pangenome by the Cortex method31,32. The
mutability through motif copy number changes due to poly-                    de Bruijn graph has a vertex for every distinct sequence of length
merase slippage during DNA replication2. Variation in SSRs are               k in a genome (k-mer), and an edge connecting every two con-
associated with tandem repeat disorders including amyotrophic                secutive k-mers, thus k-mers occurring in multiple genomes or in
lateral sclerosis and Huntington’s disease3, and VNTRs are                   multiple times in the same genome are stored by the same vertex.
associated with a wide spectrum of complex traits and diseases               While the Cortex method stores entire genomes in a de Bruijn
including attention-deficit disorder, Type 1 Diabetes and                     graph, we construct a separate locus-RPGG for each VNTR and
schizophrenia4. While STR variation has been profiled in human                store a genome as the collection of locus-RPGGs, which deviates
populations5 and to find expression quantitative trait loci                   from the definition of a de Bruijn graph because the same k-mer
(eQTL)6,7, and variation at VNTR sequences may be detected for               may be stored in multiple vertices.
targeted loci8,9, the landscape of VNTR variation in populations                We developed a toolkit, Tandem Repeat Genotyping based on
and effects on human phenotypes are not yet examined genome-                 Haplotype-derived Pangenome Graphs (danbing-tk) to identify
wide. Large scale sequencing studies including the 1000 Genomes              VNTR boundaries in assemblies, construct RPGGs, align SRS
Project10, TOPMed11 and DNA sequencing by the Genotype-                      reads to the RPGG, and infer VNTR motif composition and
Tissue Expression (GTEx) project12 rely on short-read sequen-                length in SRS samples. We generate a RPGG from 19 haplotype-
cing (SRS) characterized by SRS reads up to 150 bases. Alignment             resolved LRS genomes sequenced for population references and
and standard approaches for detecting single-nucleotide variant              diversity panels14,20,22,23, showing that while ~85% of the com-
(SNV) and indel variation (insertions and deletions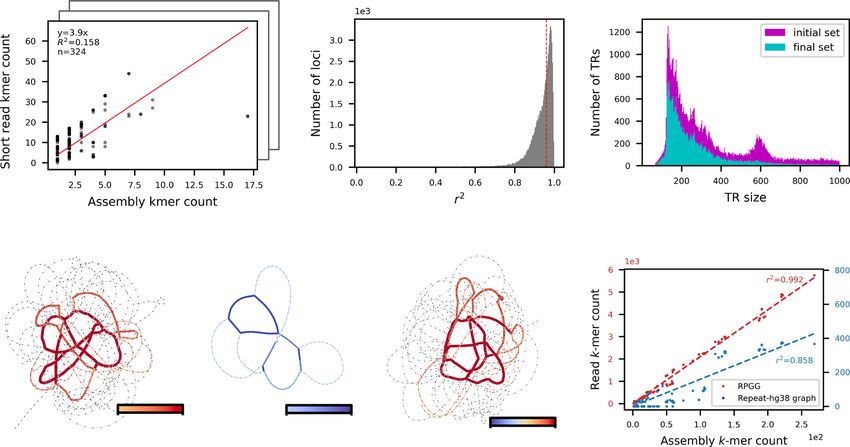
NATURE COMMUNICATIONS | https://doi.org/10.1038/s41467-021-24378-0                                                                   ARTICLE

Fig. 1 Sequence diversity of VNTRs in human populations. a Global diversity of long-read assemblies. b Dot-plot analysis of the VNTR locus
chr1:2280569–2282538 (SKI intron 1 VNTR) in genomes that demonstrate varying motif usage and length. c Diversity of RPGG as genomes are
incorporated, measured by the number of k-mers in the 32,138 VNTR graphs. Total graph size built from GRCh38 and an average genome are also shown.
d Danbing-tk workflow analysis. (top) VNTR loci defined from the reference are used to map haplotype loci. Each locus is converted to a de Bruijn graph,
from which the collection of graphs is the RPGG. The de Bruijn graphs shown illustrate sequences missing from the RPGG built only on GRCh38. The
alignments may be either used to select which loci may be accurately mapped in the RPGG using SRS that match the assemblies (red), or may be used to
estimate lengths on sample datasets (blue). Source data are provided as a Source Data file.

   In this study, the number of resolved VNTR loci is a more                    be properly annotated ranges from 19,800 to 73,212 depending
useful measurement of assembly contiguity than N50 because a                    on the assembly quality, with a final set of 73,582 loci (mean
disjoint RPGG is generated for each VNTR locus. An initial set of               length = 652 bp) across 19 genomes (Supplementary Fig. 4 and
84,411 VNTR intervals with motif size >6 bp, minimal length                     Supplementary Data 2).
>150 bp and
ARTICLE                                                                                   NATURE COMMUNICATIONS | https://doi.org/10.1038/s41467-021-24378-0

 Table 1 Source genomes for the RPGG.

 Genome            Continental population              Study          Coverage          Assembly N50 (Mb)                Fraction of VNTR annotated                 Ancestry
 AK1               EAS                                 KG             54                 0.88                            0.840                                      Korean
 HG00268           EUR                                 DP             67                  3.51                           0.967                                      Finnish
 HG00512           EAS                                 HGSVG          28                 8.83                            0.995                                      Han Chinese
 HG00513           EAS                                 HGSVG          30                  1.57                           0.993                                      Han Chinese
 HG00514           EAS                                 HGSVG          31                  1.32                           0.948                                      Han Chinese
 HG00731           AMR                                 HGSVG          31                  2.18                           0.995                                      Puerto Rican
 HG00732           AMR                                 HGSVG          16                  1.3                            0.992                                      Puerto Rican
 HG00733           AMR                                 HGSVG          46                 6.88                            0.992                                      Puerto Rican
 HG01352           AMR                                 DP             68                  5.97                           0.992                                      Colombian
 HG02059           EAS                                 DP             76                19.5                             0.992                                      Vietnamese
 HG02106           AMR                                 DP             57                 0.88                            0.640                                      Peruvian
 HG02818           AFR                                 DP             56                 0.66                            0.802                                      Gambian
 HG04217           SAS                                 DP             60                 0.86                            0.269                                      Telugu
 NA12878           EUR                                 DP             54                 4.67                            0.971                                      Central European
 NA19238           AFR                                 HGSVG          23                  2.64                           0.991                                      Yoruba
 NA19239           AFR                                 HGSVG          35                 4.87                            0.994                                      Yoruba
 NA19240           AFR                                 HGSVG          49                  3.4                            0.989                                      Yoruba
 NA19434           AFR                                 DP             62                 11                              0.980                                      Luhya
 NA24385           EUR                                 GIAB           54                  1.32                           0.981                                      Ashkenazim

 Continental populations represented are East Asian (EAS), European (EUR), Admixed Amerindian (AMR), South Asian (SAS), and African (AFR). Coverage is estimated diploid coverage based on
 alignment to GRCh38. Assembly N50 is of haplotype-resolved assemblies. The fraction of VNTR annotated are all VNTR with at least 700 flanking bases assembled.

(2,102,270 new nodes) of the sequences not contained in                                          Read-to-graph alignment in VNTR regions. Alignment of SRS
GRCh38 (7,672,357 nodes) are discovered after the inclusion of                                   reads to the RPGG enables estimation of VNTR length and motif
19 genomes, with diversity linearly increasing per genome after                                  composition. The count of k-mers in SRS reads mapped to the
the first four genomes are added to the RPGG (8,958,361                                           RPGG are reported by danbing-tk for each locus. For M samples
nodes, Fig. 1c).                                                                                 and L VNTR loci, the result of an alignment is L count matrices
   The alignment of a read to an RPGG may be defined by the                                       of dimension M ´ N i , where N i is the number of vertices in the de
path in the RPGG with a sequence label that has the minimum                                      Bruijn graph on the locus i, excluding flanking sequences. If SRS
edit distance to the read among all possible paths. We used                                      reads from a genome were sequenced without bias, sampled
~5.88 × 10⁸ error-free 150 bp paired-end reads simulated from six                                uniformly, and mapped without error to the RPGG, the count of
genomes (HG00512, HG00513, HG00731, HG00732, NA19238,                                            a k-mer in a locus mapped by an SRS sample should scale by a
and NA19239) to evaluate how reads are aligned to the RPGG.                                      factor of read depth with the sum of the count of the k-mer from
While methods exist to find alignments that do not reuse cycles38,                                the locus of both assembled haplotypes for the same genome. The
others allow alignment to cyclic graphs but with high computa-                                   quality of alignment (aln-r2) and sequencing bias were measured
tional costs when applied to RPGG27 or are limited to alignment                                  by comparing the k-mer counts from the 19 matched Illumina
in STR regions9. Efficient alignment with cycles is a more                                        and LRS genomes (Fig. 2a). In total, 44% (32,138/73,582) loci had
challenging problem recently solved by GraphAligner39 to map                                     a mean aln-r2 ≥ 0.96 between SRS and assembly k-mer counts,
long reads to pangenome graphs. Although >99.99% of the reads                                    and were marked as “valid” loci to carry forward for downstream
simulated from VNTR loci were aligned, 6.03% of reads matched                                    diversity and expression analysis (Fig. 2b). Valid had an average
with less than 90% identity, indicating misalignment. We                                         length of 341 bp, compared to 657 bp in the entire database
developed an alternative approach tuned for RPGG alignments                                      (Fig. 2c). VNTR loci that did not align well (invalid) were enri-
in danbing-tk (Fig. 1d) to realign all SRS reads within a bam/fastq                              ched for sequences that map within Alu (21,820), SVA (1762),
file to the RPGG in two passes, first by finding locus-RPGGs with                                   and other 26,752 mobile elements (Supplementary Fig. 3); loci
a high number (>45 in each end) shared k-mers with reads, and                                    with false mapping in the simulation experiment are also enri-
next by threading the paired-end reads through the locus-RPGG,                                   ched in the invalid set (Supplementary Table 2). Specifically,
allowing for up to two edits (mismatch, insertion, or deletion)                                  71.6% (4,297/5,999) of loci with false-positive mapping, 84.7%
and at least 50 matched k-mers per read against the threaded path                                (8,065/9,525) of loci with false-negative mapping are not marked
(Methods). Using danbing-tk, 99.997% of VNTR-simulated reads                                     as valid. Loci with false mapping but retained in the final set have
were aligned with >90% identity. The RPGG is only built on                                       lower but still decent length-prediction accuracy (0.79 versus
VNTRs and their flanking sequences, excluding the rest of the                                     0.82). The complete RPGG on valid loci contains 8,958,361 ver-
genome. When reads from the entire genome are considered, for                                    tices, in contrast to the corresponding RPGG on GRCh38 only
96.6% of the loci (71,080/73,582), danbing-tk can map >90% of                                    (repeat-GRCh38), which has 7,672,357 vertices. We validate that
the reads back to their original VNTR regions. Misaligned reads                                  the additional vertices in the RPGG are indeed important for
from either other VNTR loci included in the RPGG or the                                          accurately recruiting reads pertinent to a VNTR locus, using the
remainder of the genome not included in the RPGG target                                          CACNA1C VNTR as an example (Fig. 2d). It is known that the
relatively few loci; 3.6% (2,635/73,582) loci have at least one read                             reference sequence at this locus is truncated compared to the
misaligned from outside the locus. The graph pruning step is the                                 majority of the populations (319 bp in GRCh38 versus 5669 bp
primary cause of missed alignments, and affects on average 2,772                                 averaged across 19 genomes). The limited sequence diversity
loci per assembly. On real data, danbing-tk required 18.5 GB of                                  provided by repeat-GRCh38 at this locus failed to recruit reads
memory to map 150 base paired-end reads at 10.1 Mb/sec on                                        that map to paths existing in the RPGG but missing or only
16 cores.                                                                                        partially represented in repeat-GRCh38. A linear fit between the

4                      NATURE COMMUNICATIONS | (2021)12:4250 | https://doi.org/10.1038/s41467-021-24378-0 | www.nature.com/naturecommunications
NATURE COMMUNICATIONS | https://doi.org/10.1038/s41467-021-24378-0                                                                       ARTICLE

Fig. 2 Mapping short reads to repeat-pangenome graphs. a An example of evaluating the alignment quality of a locus mapped by SRS reads. The
alignment quality is measured by the r2 of a linear fit between the k-mer counts from the ground truth assemblies and from the mapped reads (Methods).
b Distribution of the alignment quality scores of 73,582 loci. Loci with alignment quality less than 0.96 when averaged across samples are removed from
downstream analysis (Methods). c Distribution of VNTR lengths in GRCh38 removed or retained for downstream analysis. d, e Comparing the read
mapping results of the CACNA1C VNTR using RPGG or repeat-GRCh38. d The k-mer counts in each graph and the differences are visualized with edge
width and color saturation. To visualize paths with less mapped reads, k-mer counts are clipped at 750 (left), 120 (middle), and 700 (right), respectively,
with the maximal k-mer count of each graph being 5744, 375, and 5378, respectively. e The k-mer counts from the ground truth assemblies are regressed
against the counts from reads mapped to the RPGG (red) and repeat-GRCh38 (blue), respectively. Source data are provided as a Source Data file.

k-mers from mapped reads and the ground truth assemblies                        of an unseen SRS sample (Methods), giving a median length-
shows that there is a 13-fold gain in slope, or measured read                   prediction accuracy of 0.82 for 16 unrelated genomes (Fig. 3a left,
depth, when using RPGG compared to repeat-GRCh38 (Fig. 2e).                     Supplementary Fig. 10). The read depth of a repetitive region
The k-mer counts in the RPGGs also correlate better with the                    correlates to the locus length when aligning short reads to a linear
assembly k-mer counts compared to the repeat-GRCh38 (aln-                       reference genome. However, estimation of VNTR length from
r2 = 0.992 versus 0.858).                                                       read depth has an accuracy of 0.75 (Fig. 3a left). We also
    New genomes with arbitrary combinations of motifs and copy                  compared the performance for length prediction using the RPGG
numbers in VNTRs should still align to an RPGG as long as the                   versus repeat-GRCh38, and observed a 58% improvement in
motifs are represented in the graph. We used leave-one-out                      accuracy (0.82 versus 0.52, Fig. 3a left and Supplementary
analysis to evaluate alignment of unseen genomes to RPGGs and                   Fig. 11). The overall error rate, measured with mean absolute
estimation of VNTR length. In each experiment, an RPGG was                      percentage error (MAPE), of all loci (n = 32,138) are also
constructed with one LRS genome missing. SRS reads from the                     significantly lower when using RPGGs (MAPE = 0.18, Fig. 3a
missing genome were mapped into the RPGG, and the estimated                     right) compared with the repeat-GRCh38 (0.23, paired t-test
locus lengths were compared to the average diploid lengths of                   P = 4.2 × 10⁻³²) or reference-aligned read depth (0.20, paired
corresponding loci in the missing LRS assembly. The locus length                t-test P = 2.4 × 10⁻³³). Furthermore, a 62% reduction in error
is estimated as the adjusted sum of k-mer counts kms mapped                     size is observed for the 6,383 loci poorly genotyped (MAPE > 0.4)
from SRS sample s: kms=ðcovs ´ ^bÞ, where covs is sequencing                    using repeat-GRCh38 (Fig. 3b, MAPE = 0.235 versus 0.610). Loci
depth of s, ^b is a correction for locus-specific sampling bias (LSB).           with low accuracy in length estimates from RPGG can be mostly
LSB measures the deviation of an observed read depth from the                   explained by the estimation error in LSB due to varying data
expected value within an interval (see “Methods” for formal                     quality (r2 = 0.89, Supplementary Fig. 12; example given in
definition). As the SRS datasets used in this study during                       Supplementary Fig. 13), and to a slight degree by the presence of a
pangenome construction were collected from a wide variety of                    missing haplotype (Supplementary Fig. 14), the fraction of k-mers
studies with different biases, there was no consistent LSB in either            in a locus unique to a sample (Supplementary Fig. 15), GC bias
repetitive or nonrepetitive regions for samples from different                  (Supplementary Fig. 16), and the difference in the VNTR GC
sequencing runs (Supplementary Figs. 6 and 7). However,                         content across samples (Supplementary Fig. 17).
principal component analysis (PCA) of repetitive and nonrepe-
titive regions showed highly similar projection patterns (Supple-               Profiling VNTR length and motif diversity. To explore global
mentary Fig. 8), which enabled using LSB in nonrepetitive regions               diversity of VNTR sequences and potential functional impact, we
as a proxy for finding the nearest neighbor of LSB in VNTR                       aligned reads from 2,504 individuals from diverse populations
regions (Supplementary Fig. 9). Leveraging this finding, a set of                sequenced at 30-fold coverage from the 1000-Genomes project
397 nonrepetitive control regions were used to estimate the LSB                 (1KGP)10,40, and 879 GTEx genomes12 to the RPGG. The

NATURE COMMUNICATIONS | (2021)12:4250 | https://doi.org/10.1038/s41467-021-24378-0 | www.nature.com/naturecommunications                                 5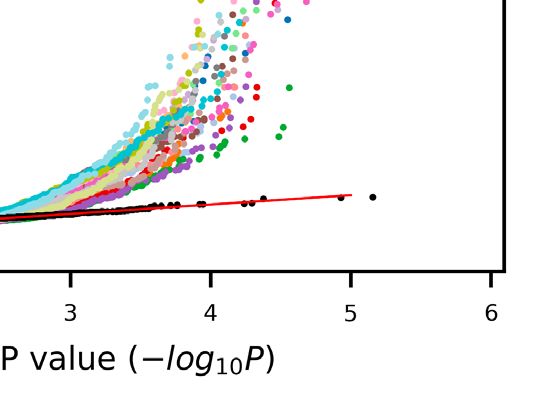
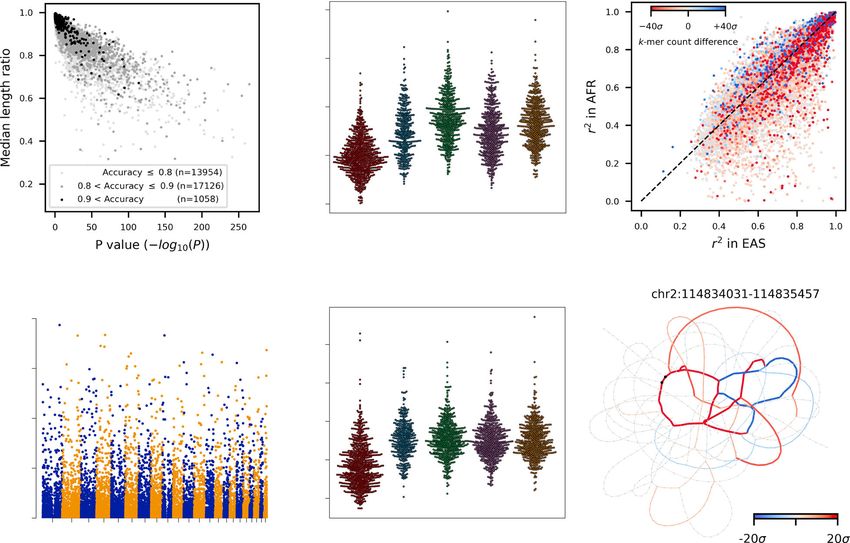
ARTICLE                                                                  NATURE COMMUNICATIONS | https://doi.org/10.1038/s41467-021-24378-0

Fig. 3 VNTR length prediction. a Accuracies of VNTR length-prediction measured for each genome (left; n = 16) and each locus (right; n = 32,138). Mean
absolute percentage error (MAPE) in VNTR length is averaged across loci and genomes, respectively. Lengths were predicted based on repeat-pangenome
graphs (RPGG), repeat-GRCh38 (RHG) or naive read depth method (RD), respectively. Boxes span from the lower quartile to the upper quartile, with
horizontal lines indicating the median. Whiskers extend to points that are within 1.5 interquartile range (IQR) from the upper or the lower quartiles.
b Relative performance of RPGG versus repeat-GRCh38. Loci are ordered along the x-axis by genotyping accuracy in repeat-GRCh38. The y-axis shows the
decrease in MAPE using RPGG versus repeat-GRCh38. The subplot shows loci poorly genotyped (MAPE > 0.4) in repeat-GRCh38. The red dotted line
indicates the baseline without any improvement. the counts from reads mapped to the RPGG (red) and repeat-GRCh38 (blue), respectively. Source data
are provided as a Source Data file.

fraction of reads from these datasets that align to the RPGG                  variation, and then filtered for deletions or unreliable samples
ranges from 1.11 to 1.37%, similar to the matched LRS/SRS data                (Methods) to characterize 477 loci as potentially unstable
(1.23%). PCA on the LSB of both datasets showed the 1KGP and                  (Supplementary Data 3). These loci are inside 115 genes and
GTEx genomes as separate clusters in both repetitive and non-                 are significantly reduced from the number expected by chance
repetitive regions (Supplementary Fig. 7), indicating experiment-             (P < 1 × 10⁻⁵, one-sided permutation test; n = 10,000). Of these
specific bias that prevents cross dataset comparisons. Consistent              loci, 64 have an individual with >10 standard deviations above
with the finding in previous leave-one-out analysis, genomes                   the mean, of which two overlap genes, KCNA2, and GRM4
from the same study cluster together in the PCA plot of LSB, and              (Supplemental Fig. 18).
so within each dataset and locus, k-mer counts from SRS reads                    Alignment to an RPGG provides information about motif
normalized by sequencing depth were used to compare VNTR                      usage in addition to estimates of VNTR length because genomes
content across genomes.                                                       with different motif composition will align to different vertices in
   The k-mer dosage: kms=cov, was used as a proxy for locus                   the graph. To detect differential motif usage, we searched for loci
length to compare tandem repeat variation across populations in               with a k-mer that was more frequent in one population than
the 1KGP genomes. The 1KGP samples contain individuals from                   another and not simply explained by a difference in locus length,
African (26.5%), East Asian (20.1%), European (19.9%), Admixed                comparing African (AFR) and East Asian populations for
American (13.9%), and South Asian (19.5%) populations. When                   maximal genetic diversity. Lasso regression against locus length
comparing the average population length to the global average                 was used to find the k-mer with the most variance explained
length, 60.8% (19,530/32,138) have differential length between                (VEX) in EAS genomes, denoted as the most informative k-mer
populations (FDR = 0.05 on ANOVA P-values), with similar                      (mi-kmer). Two statistics are of interest when comparing the two
distributions of differential length when loci are stratified by the           populations: the difference in the count of mi-kmers (kmcd ) and
accuracy of length prediction (Fig. 4a). Population stratification             the difference between proportion of VEX (r 2d ) by mi-kmers.
was calculated using the VST statistic41 on VNTR length (Fig. 4b).            Kmcd describes the usage of an mi-kmer in one population
Previous studies have used >3 standard deviations above the                   relative to another, while r 2d indicates the degree that the mi-kmer
mean to define for highly stratified copy number variants42.                    is involved in repeat contraction or expansion in one population
Under this measure, 785 variants are highly stratified, including              relative to another. We observe that 8216 loci have significant
266 that overlap genes, however this is not significantly enriched             differences in the usage of mi-kmers between the two populations
(P = 0.079, one-sided permutation test). Two of the top five loci              (two-sided P < 0.01, bootstrap, Supplementary Fig. 19). Among
ranked by VST are intronic: a 72 base VNTR in PLCL1                           these, the mi-kmers of 1913 loci are crucial to length variation in
(VST = 0.37), and a 148 base locus in SPATA18 (VST = 0.35)                    the EAS but not in the AFR population (two-sided P < 0.01,
(Fig. 4c, d). These values for VST are lower than what are observed           bootstrap) (Fig. 4e and Supplementary Fig. 19). A top example of
for large copy number variants41 and may be the result of neutral             these loci with r2 at least 0.9 in the EAS population was visualized
variation, however, this may be affected by the high variance of              with a heatmap of relative k-mer count from both populations,
the length estimate, as VST decreases as the variance of the copy             and clearly showed differential usage of cycles in the RPGG
number/dosage values increase (Methods).                                      (Fig. 4f).
   VNTR loci that are unstable may undergo hyper-expansion
and are implicated as a mechanism of multiple diseases4. To
discover potentially unstable loci, we searched the 1 KGP                     Association of VNTR with nearby gene expression. As the
genomes for evidence of rare VNTR hyper-expansion. Loci were                  danbing-tk length estimates showed population genetic patterns
screened for individuals with extreme (>6 standard deviations)                expected for human diversity, we assessed whether danbing-tk

6                 NATURE COMMUNICATIONS | (2021)12:4250 | https://doi.org/10.1038/s41467-021-24378-0 | www.nature.com/naturecommunications
NATURE COMMUNICATIONS | https://doi.org/10.1038/s41467-021-24378-0                                                                          ARTICLE

Fig. 4 Population properties of VNTR loci. a Ratios of median length between populations for loci with significant differences in average length. Loci are
stratified by accuracy prediction (
ARTICLE NATURE COMMUNICATIONS | https://doi.org/10.1038/s41467-021-24378-0
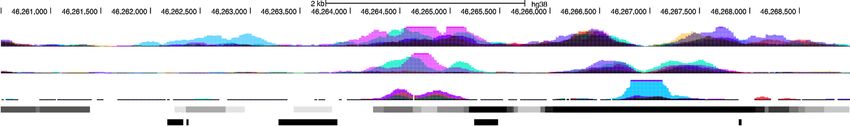
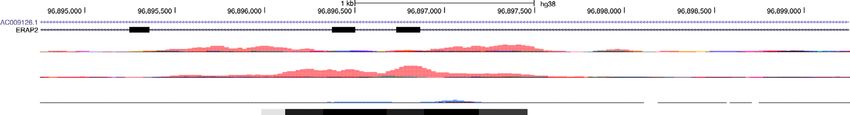
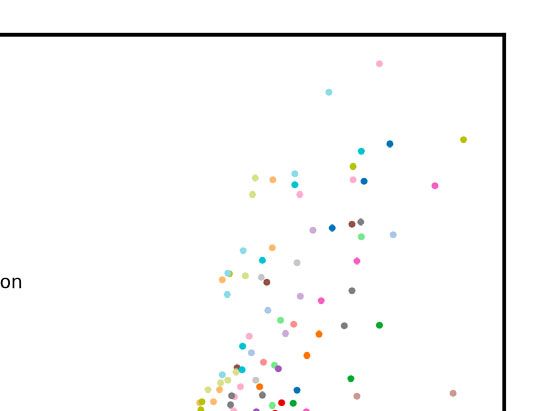
Fig. 5 cis-eQTL mapping of VNTRs. a eVNTR discoveries in 20 human tissues. The quantile-quantile plot shows the observed P-value of each association
test (two-sided t-test) versus the P-value drawn from the expected uniform distribution. Black dots indicate the permutation results from the top 5%
associated (gene, VNTR) pairs in each tissue. The regression plots for ERAP2 and KANSL1 are shown in c and d. b Effect size distribution (n = 2510) of
significant associations from all tissues. c, d Genomic view of disease-related (eGene,eVNTR) pairs (ERAP2, chr5:96896863–96896963) (c) and (KANSL1,
chr17:46265245–46265480) (d) are shown. Red boxes indicate the location of eGenes and eVNTRs.
intergenic VNTR at chr17:46,265,245–46,265,480 that associates with whole-genome sequencing15. To address this, we have pro-
with the expression of KANSL1 ~40 kb upstream (Fig. 5c and posed an approach that combines multiple genomes into a pan-
Supplementary Fig. 21). The eVNTR has a maximal effect size of genome graph that represents the repeat structure of a
+0.45 and is significant across 40 tissues. The protein product population. This is supported by the software, danbing-tk and
of KANSL1, or KAT8 regulatory NSL complex subunit 1, is a part associated RPGG. We used danbing-tk to generate a pangenome
of the histone acetylation machinery. Deletion of this gene is from 19 haplotype-resolved assemblies, and applied it to detect
linked to Koolen-de Vries syndrome47, and the locus is associated VNTR variation across populations and to discover eQTL.
with Parkinson disease48. The eVNTR colocalizes with strong The structure of the RPGG can help to organize the diversity of
ChIP signals, and the association of this VNTR with the assembled VNTR sequences with respect to the standard refer-
epigenetic landscape warrants further investigation. ence. In particular, the RPGG on 19 genomes is 27% larger than
repeat-GRCh38. Combined with the observation that using the
Discussion 19-genome RPGG gives a 63% decrease in length-prediction
Previous commentaries have proposed that variation in VNTR error, this indicates that the pan-genomes add detail for the
loci may represent a component of undiagnosed disease and missing variation. With the availability of additional genomes
missing heritability49, which has remained difficult to profile even sequenced through the Pangenome Reference Consortium
8 NATURE COMMUNICATIONS | (2021)12:4250 | https://doi.org/10.1038/s41467-021-24378-0 | www.nature.com/naturecommunicationsNATURE COMMUNICATIONS | https://doi.org/10.1038/s41467-021-24378-0 ARTICLE
(https://humanpangenome.org/) and the HGSVC (https://www. following QC step removes a haplotype if its VNTR annotation is within 700 bp to
internationalgenome.org), combined with advanced haplotype- breakpoints or if the orthology mapping location to GRCh38 is different from the
majority of haplotypes. A VNTR locus with the number of supporting haplotypes
resolve assembly methods50, the spectrum of this variation will be less than 90% of the total number of haplotypes is also removed. Adjacent VNTR
revealed in the near future. While we anticipate that eventually loci within 700 bp to each other in any of the haplotypes will induce a merging step
the full spectrum of VNTR diversity will be revealed through LRS over all haplotypes. Haplotypes with distance between adjacent loci inconsistent
of large cohorts, the RPGG analysis will help organize analysis by with the majority of haplotypes are removed. Finally, VNTR loci with the number
characterizing repeat domains. For example, with our approach, of supporting haplotypes less than 80% of the total number of haplotypes are
removed, leaving 73,582 of the initial 84,411 loci.
we are able to detect 1913 loci with differential motif usage
between populations, which could be difficult to characterize Read-to-graph alignment. For the two haplotypes of an individual, three data
using an approach such as multiple-sequence alignment of VNTR structures are used to encode the information of all VNTR loci, including VNTRs
sequences from assembled genomes. and their 700 bp flanking sequences. The first data structure allows fast locus
There are several caveats to our approach. Datasets combined lookup for each k-mer (k = 21) by hashing each canonical k-mer in the VNTRs and
the flanking sequences to the index of the original locus. The second data structure
from disparate sequencing runs with batch effects will affect enables graph threading by storing a bi-directional de Bruijn graph for each locus.
dosage estimates. In contrast to other pangenome The third data structure is used for counting k-mers originating from VNTRs. The
approaches27,38, danbing-tk does not keep track of a reference read mapping algorithm maps each pair of Illumina paired-end reads to a unique
(e.g., GRCh38) coordinate system. Furthermore, because it is VNTR locus in three phases: (1) In the k-mer set mapping phase, the read pair is
converted to a pair of canonical k-mer multisets. The VNTR locus with the highest
often not possible to reconstruct a unique path in an RPGG, only count of intersected k-mers is detected with the first data structure. (2) In the
counts of mapped reads are reported rather than the order of threading phase, the algorithm tries to map the k-mers in the read pair to the bi-
traversal of the RPGG. An additional caveat of our approach is directional de Bruijn graph such that the mapping forms a continuous path/cycle.
that genotype is calculated as a continuum of k-mer dosage rather To account for sequencing and assembly errors, the algorithm is allowed to edit a
limited number of nucleotides in a read if no matching k-mer is found in the graph.
than discrete units, prohibiting direct calculation of linkage- The read pair is determined feasible to map to a VNTR locus if the number of
disequilibrium for fine-scale mapping51. Finally this approach mapped k-mers is above an empirical threshold. (3) In the k-mer counting phase,
only profiles loci where k-mer counts from reads and assemblies canonical k-mers of the feasible read pair are counted if they existed in the VNTR
are correlated; loci for which every k-mer appears the same locus. Finally, the read mapping algorithm returns the k-mer counts for all loci as
number of times are excluded from analysis (on average 8,058/ mapped by SRS reads. Alignment timing was conducted on an Intel Xeon E5-
2650v2 2.60 GHz node.
73,582 per genome).
The rich data (Supplementary Data 7–9) provided by danbing- Graph pruning and merging. Pan-genome representation provides a more thorough
tk and pangenome analysis provide the basis for additional description of VNTR diversity and reduces reference allele bias, which effectively
association studies. While most analysis in this study focused on improves the quality of read mapping and downstream analysis. Considering the
the diversity of VNTR length or association of length and fact that haplotypes assembled from long-read datasets are error prone in VNTR
regions, it is necessary to prune the graphs/k-mers before merging them as a pan-
expression, it is possible to query differential motif usage using genome. We ran the read mapping algorithm with error correction disabled so as
the RPGG. The ability to detect motifs that have differential usage to detect k-mers unsupported by SRS reads. The three data structures were updated
between populations brings the possibility of detecting differential by deleting all unsupported k-mers for each locus. By pooling and merging the
motif usage between cases and controls in association studies. reference regions corresponding to the VNTR regions in all individuals, we
obtained a set of “pan-reference” regions, each indicating a location in GRCh38
This can help distinguish stabilizing versus fragile motifs52, or that is likely to map to a VNTR region in any other unseen haplotype. By refer-
resolve some of the problem of missing heritability by discovering encing the mapping relation of VNTR loci across individuals, we encoded the
new associations between motif and disease18. Finally, this work variability of each VNTR locus by merging the three data structures across
is a part of ongoing pangenome graph analysis53,54, and repre- individuals.
sents an approach to generating pangenome graphs in loci that
Alignment quality analysis. To evaluate the quality of the haplotype assemblies and
have difficult multiple-sequence alignments or degenerate graph the performance of the read mapping algorithm, VNTR k-mer counts in the ori-
topologies. Additional methods may be developed to harmonize ginal assemblies were regressed against those mapped from SRS reads. The r2 of the
danbing-tk RPGGs with genome-wide pangenome graphs con- linear fit was used as the alignment quality score (referred to as aln-r2). To measure
structed from other methods. alignment quality in the pan-genome setting, only the k-mer set derived from the
genotyped individual was retained as the input for regression.
Methods Data filtering. A final set of 32,138 VNTR regions was called by filtering based on
Repeat-pangenome graph construction aln-r2. The quality of a locus was measured by the mean aln-r2 across individuals.
Initial discovery of tandem repeats. TRF37 v4.09 (option: 2 7 7 80 10 50 500 -f -d -h) Loci with mean aln-r2 below 0.96 were removed from the final call set. The final
was used to roughly annotate the SSR regions of five PacBio assemblies (AK1, pan-genome graphs were used to genotype large Illumina datasets, measure length-
HG00514, HG00733, NA19240, NA24385). The scope of this work focuses on prediction accuracy, analyze population structures and map eQTL.
VNTRs that cannot be resolved by typical short-read sequencing methods. We
selected the set of SSR loci with a motif size greater than 6 bp and a total length Predicting VNTR lengths. Read depths at VNTR regions usually vary considerably
greater than 150 bp andARTICLE NATURE COMMUNICATIONS | https://doi.org/10.1038/s41467-021-24378-0
With the above bias terms, the VNTR length of locus l in sample s can be appeared as an outlier was used to select a set of genomes with an over abundant
computed by: contribution to fragile loci. Any candidate locus with an individual that was an
outlier in at least four other loci was removed from the candidate list. The loci were
kmss;l
Ls;l ¼ ð3Þ compared to gencode v34, excluding readthrough, pseudogenes, noncoding RNA,
covs ´ b^s and nonsense transcripts.
where covs is same as described above; b^s is the estimated LSBs computed from
sample ^s with ground truth VNTR lengths; kmss;l is the sum of k-mer counts of Identifying differential motif usage and expansion. Sample outliers in the 1000
locus l mapped by sample s. We assume the LSBs that best approximates bs come Genomes were detected from the LSBs over 397 control regions and the VNTR
from samples within the same sequencing run. Without prior knowledge on the dosages over 32,138 loci using DBSCAN. A total of 119/2504 samples were
ground truth VNTR lengths of s and therefore bs , we determine the “closest” removed from downstream analysis. We use the EAS population as the reference
sample ^s w.r.t. s based on r2 between the read depths, RD, of the 397 unique regions for measuring differential motif usage and expansion. Initially, a lasso fit using the
as follows: statsmodel.api.OLS function in python statsmodel v0.10.155 was performed for
each locus to identify the k-mer with the most variance explained (VEX) in VNTR
^s ¼ argmax r 2 ðRDs0 ; RDs Þ ð4Þ
s0;s02GT;s0≠s
lengths using the following formula: y ¼ Xb þ ϵ, where y ∈ RN is the VNTR
length of N individuals in the EAS population; X ∈ RN ´ M is the k-mer dosage
where GT is the set of samples with ground truths and within the same sequencing
matrixfor N individuals with M k-mers; b ∈ RN is the model coefficient, and
run as s. We cross-validate our approach by leaving one sample out of the pan-
ϵ N 0; σ 2 is the error term. The lasso penalty weight α was scanned starting at
genome database and evaluating the prediction accuracy on the excluded sample.
For comparison, VNTR lengths were also estimated by a read depth method. 0.9 with at a step size of −0.1 until at least one covariate has a positive weight or α
For each VNTR region, the read depth, computed with samtools bedcov -j, was is below 0.1. The k-mer with the highest weight is denoted as the most informative
divided by the global read depth, computed from the 397 nonrepetitive regions, to k-mer (mi-kmer) for the locus.
give the length estimate. To identify loci with differential motif usage between populations, we
subtracted the median count of the mi-kmer of the AFR from the EAS population
for each locus, denoted as kmcd . The null distribution of kmcd was estimated by
Comparing with GraphAligner. The compact de Bruijn graph of each VNTR locus bootstrap. Specifically, EAS individuals were sampled with replacement N EAS þ
was generated with bcalm v2.2.3 (option: -kmer-size 21 -abundance-min 1) using N AFR times, matching the sample sizes of the EAS and AFR populations,
the VNTR sequences from all assemblies as input.
GFA files were then reindexed and concatenated to generate the RPGGs for respectively. The bootstrap statistics, kmc*d , were computed by subtracting the
32,138 loci. Error-free paired-end reads were simulated from all VNTR regions at median count of the mi-kmer of the last N AFR from the first N EAS bootstrap
2x coverage with 150 bp read length and 600 bp insert size (300 bp gap between samples for each locus. The estimated null distribution is then used to determine
each end). Reads were aligned to the RPGG using GraphAligner v1.0.11 with the threshold for calling a locus having significant differential motif usage between
option -x dbg --seeds-minimizer-length 21. Reads with alignment identity >90% populations (two-sided P < 0.01).
were counted from the output gam file. To compare in a similar setting, danbing-tk To identify loci with differential motif expansion between populations, we
was run with option -gc -thcth 117 -k 21 -cth 45 -rth 0.5 to assert >90% identity for subtracted the proportion of VEX by mi-kmer in the AFR from the EAS
all reads aligned, given that ðread length kmer size þ 1Þ ´ 0:9 ¼ 117. population, denoted as r 2d . The null distribution of r 2d was estimated by bootstrap in
a similar sampling procedure as kmcd , except for subtracting the proportion of
VEX by the mi-kmer in the last N AFR from the first N EAS bootstrap samples for
Population analysis each locus. The estimated null distribution is used to determine the threshold for
VST calculation. VST was calculated according to Redon et al.41: calling a locus having significant differential motif expansion between populations
! (two-sided P < 0.01).
varall n1 ∑p2P varp ´ np
V ST ½i ¼ max 0; ð5Þ
varall
eQTL mapping
Top VST loci were considered as the sites with VST at least three standard Retrieving datasets. WGS datasets of 879 individuals, normalized gene expression
deviations above the mean. matrices and covariates of all tissues are accessed from the GTEx Analysis V8
(dbGaP Accession phs000424.v8.p2).
Properties of VST. The dosage of a VNTR for an individual j is xj ≥ 0. Consider nT
individuals consisting of P populations, with ni individuals each, with population Genotype data preprocessing. VNTR lengths are genotyped using daunting-tk with
mean and variance, μi and σ 2i , and a global mean and variance μT and σ 2T for all options: -gc -thcth 50 -cth 45 -rth 0.5. All the k-mer counts of a locus are summed
∑σ 2i ni
individuals. Population stratification is calculated as V ST ¼ σ12 σ 2T . ∑ni
and adjusted by global read depth and ploidy to represent the approximate length
T of a locus. Sample outliers were detected from the LSBs over 397 control regions
The mean across populations, μT is calculated as ∑μi ni =∑ni . The variance is and the VNTR dosages over 32,138 loci using DBSCAN. A total of 26/838 samples
Eðxj μT Þ2 for all individuals, and this may be separated out by population as were removed from downstream analysis. Adjusted values are then z-score nor-
2
∑i Eðxik μT Þ ni =∑i ni , using xik to denote the kth individual in population i. The malized as input for eQTL mapping.
2
value ∑i Eðxik μT Þ may be computed as:
2 2 Expression data preprocessing. The downloaded expression matrices are already
E xik μT ¼ E xik μi þ μi μT preprocessed such that outliers are rejected and expression counts are quantile
normalized as standard normal distribution. Confounding factors such as sex,
2 2 sequencing platform, amplification method, technical variations and population
¼E xik μi þ 2 xik μi μi μT þ μi μT
structure are removed prior to eQTL mapping to avoid spurious associations.
Technical variations are corrected with the covariates, including PEER factors,
since E xik ¼ μi ; E xik μi ¼ E xik E μi ¼ 0 provided by the GTEx Consortium. Population structures are corrected with the
2 top 10 principal components (PCs) from the SNP matrix of all samples. Particu-
¼ σ 2i þ E μi μT larly, principal component analysis (PCA) was performed jointly on the intersec-
tion of the SNP sets from GTEx samples and 1KGP Omni 2.5 SNP genotyping
2 arrays (ftp://ftp.1000genomes.ebi.ac.uk/vol1/ftp/release/20130502/supporting/
¼ σ 2i þ μi μT ð6Þ
hd_genotype_chip/ALL.chip.omni_broad_sanger_combined.20140818.snps.geno-
The total population variance σ 2T relative to the population mean, variance, size, types.vcf.gz). This is done by first using CrossMap v0.4.0 to liftover the SNP sites
and global mean is: from Omni 2.5 arrays to GRCh38, followed by extracting the intersection of the
2 two SNP sets using vcftools isec. The SNP set is further reduced by LD-pruning
∑i ni σ 2i þ μi μT
σT ¼
2 ð7Þ with plink v1.90b6.12 using the options: --indep 50 5 2, leaving a total of
∑ i ni 757,000 sites. Finally, PCA on the joint SNP matrix was done by smartpca v13050.
Replacing this in the calculation of VST gives: The normalized expression matrix are residualized with the above covariates using
0 2 1 the following formula:
2
1 @∑i ni σ i þ μi μT
2
∑i σ 2i ni A ∑i ni μi μT
V ST ¼ 2 ¼ ð8Þ Y ¼ ðI H ÞY 0 ð9Þ
σT ∑ i ni ∑ i ni nT ´ σ T
2
Identifying unstable loci. A locus was annotated as a candidate for being unstable if 1
at least one individual had outlying k-mer dosage ≥ six standard deviations above H ¼ C CT C CT ð10Þ
the mean, using population and locus-specific summary statistics on data dis-
carding individuals with dosage 0.9). Among this set, the number of times each genome matrix; H is the projection matrix; I is the identity matrix; C is the covariate matrix
10 NATURE COMMUNICATIONS | (2021)12:4250 | https://doi.org/10.1038/s41467-021-24378-0 | www.nature.com/naturecommunicationsNATURE COMMUNICATIONS | https://doi.org/10.1038/s41467-021-24378-0 ARTICLE
where each column corresponds to a covariate mentioned above. The residualized 5. Mallick, S. et al. The Simons Genome Diversity Project: 300 genomes from 142
expression values are z-score normalized as the input of eQTL mapping. diverse populations. Nature 538, 201–206 (2016).
6. Fotsing, S. F. et al. The impact of short tandem repeat variation on gene
Association test. VNTRs within 100 kb to a gene are included for eQTL mapping. expression. Nat. Genet. 51, 1652–1659 (2019).
Linear regression was done using the statsmodel.api.OLS function in python 7. Gymrek, M. et al. Abundant contribution of short tandem repeats to gene
statsmodel v0.10.155 with expression values as the dependent variable and genotype expression variation in humans. Nat. Genet. 48, 22–29 (2016).
values as the independent variable. Nominal P-values are computed by performing 8. Bakhtiari, M., Shleizer-Burko, S., Gymrek, M., Bansal, V. & Bafna, V. Targeted
t-tests on slope. Adjusted P-values are computed by Bonferroni correction on genotyping of variable number tandem repeats with adVNTR. Genome Res.
nominal P-values. Under the assumption of at most one causal VNTR per gene, we 28, 1709–1719 (2018).
control gene-level false -discovery rate at 5%. Specifically, the adjusted P-values of 9. Dolzhenko, E. et al. ExpansionHunter: a sequence-graph-based tool to analyze
the lead VNTR for each gene are taken as input for Benjamini–Hochberg proce- variation in short tandem repeat regions. Bioinformatics 35, 4754–4756
dure using statsmodels.stats.multitest.fdrcorrection v0.10.1. Lead VNTRs that (2019).
passed the procedure are identified as eVNTRs. 10. 1000 Genomes Project Consortium. et al. A global reference for human
genetic variation. Nature 526, 68–74 (2015).
Reporting summary. Further information on research design is available in the Nature 11. Taliun, D. et al. Sequencing of 53,831 diverse genomes from the NHLBI
Research Reporting Summary linked to this article. TOPMed Program. Nature 590, 290–299 (2021).
12. Consortium, G., GTEx Consortium. Genetic effects on gene expression across
human tissues. Nature 550, 204–213 (2017).
Data availability 13. Li, H. et al. A synthetic-diploid benchmark for accurate variant-calling
Data accession IDs are given in Supplementary Table 4. Six HGSVC diploid assemblies evaluation. Nat. Methods 15, 595–597 (2018).
that support the finding of this study are available at https://www.internationalgenome. 14. Chaisson, M. J. P. et al. Multi-platform discovery of haplotype-resolved
org/data-portal/data-collection/hgsvc2. The remaining 13 diploid assemblies, the RPGG structural variation in human genomes. Nat. Commun. 10, 1784 (2019).
data structure and the k-mer dosage table for 1KGP samples are available at https://doi. 15. Mousavi, N., Shleizer-Burko, S., Yanicky, R. & Gymrek, M. Profiling the
org/10.5281/zenodo.4758205. The whole-genome sequencing data of 1KGP samples genome-wide landscape of tandem repeat expansions. Nucleic Acids Res. 47,
(PRJEB36890) are available at https://www.internationalgenome.org/data-portal/data- e90 (2019).
collection/30x-grch38. The following cell lines/DNA samples were obtained from the 16. Koren, S. et al. Canu: scalable and accurate long-read assembly via adaptive k-
NIGMS Human Genetic Cell Repository at the Coriell Institute for Medical Research: mer weighting and repeat separation. Genome Res. 27, 722–736 (2017).
[NA06984, NA06985, NA06986, NA06989, NA06991, NA06993, NA06994, NA06995, 17. Chin, C.-S. et al. Phased diploid genome assembly with single-molecule real-
NA06997, NA07000, NA07014, NA07019, NA07022, NA07029, NA07031, NA07034, time sequencing. Nat. Methods 13, 1050–1054 (2016).
NA07037, NA07045, NA07048, NA07051, NA07055, NA07056, NA07340, NA07345, 18. Song, J. H. T., Lowe, C. B. & Kingsley, D. M. Characterization of a human-
NA07346, NA07347, NA07348, NA07349, NA07357, NA07435, NA10830, NA10831, specific tandem repeat associated with bipolar disorder and schizophrenia.
NA10835, NA10836, NA10837, NA10838, NA10839, NA10840, NA10842, NA10843, Am. J. Hum. Genet. 103, 421–430 (2018).
NA10845, NA10846, NA10847, NA10850, NA10851, NA10852, NA10853, NA10854, 19. Du, Z. et al. Whole genome analyses of chinese population and de novo
NA10855, NA10856, NA10857, NA10859, NA10860, NA10861, NA10863, NA10864, assembly of a northern han genome. Genomics Proteom. Bioinforma. 17,
NA10865, NA11829, NA11830, NA11831, NA11832, NA11839, NA11840, NA11843, 229–247 (2019).
NA11881, NA11882, NA11891, NA11892, NA11893, NA11894, NA11917, NA11918, 20. Shi, L. et al. Long-read sequencing and de novo assembly of a Chinese
NA11919, NA11920, NA11930, NA11931, NA11932, NA11933, NA11992, NA11993, genome. Nat. Commun. 7, 12065 (2016).
NA11994, NA11995, NA12003, NA12004, NA12005, NA12006, NA12043, NA12044, 21. Hickey, G. et al. Genotyping structural variants in pangenome graphs using
NA12045, NA12046, NA12056, NA12057, NA12058, NA12144, NA12145, NA12146, the vg toolkit. Genome Biol. 21, 35 (2020).
NA12154, NA12155, NA12156, NA12234, NA12239, NA12248, NA12249, NA12264, 22. Audano, P. A. et al. Characterizing the major structural variant alleles of the
NA12272, NA12273, NA12274, NA12275, NA12282, NA12283, NA12286, NA12287, human genome. Cell 176, 663–675.e19 (2019).
NA12329, NA12335, NA12336, NA12340, NA12341, NA12342, NA12343, NA12344, 23. Chen, S. et al. Paragraph: a graph-based structural variant genotyper for short-
NA12347, NA12348, NA12375, NA12376, NA12383, NA12386, NA12399, NA12400, read sequence data. Genome Biol. 20, 291 (2019).
NA12413, NA12414, NA12485, NA12489, NA12546, NA12707, NA12708, NA12716, 24. Saini, S., Mitra, I., Mousavi, N., Fotsing, S. F. & Gymrek, M. A reference
NA12717, NA12718, NA12739, NA12740, NA12748, NA12749, NA12750, NA12751, haplotype panel for genome-wide imputation of short tandem repeats. Nat.
NA12752, NA12753, NA12760, NA12761, NA12762, NA12763, NA12766, NA12767, Commun. 9, 4397 (2018).
NA12775, NA12776, NA12777, NA12778, NA12801, NA12802, NA12812, NA12813, 25. Gymrek, M., Willems, T., Reich, D. & Erlich, Y. Interpreting short tandem
NA12814, NA12815, NA12817, NA12818, NA12827, NA12828, NA12829, NA12830, repeat variations in humans using mutational constraint. Nat. Genet. 49,
NA12832, NA12842, NA12843, NA12864, NA12865, NA12872, NA12873, NA12874, 1495–1501 (2017).
NA12875, NA12877, NA12878, NA12889, NA12890, NA12891, NA12892]. The whole- 26. Eggertsson, H. P. et al. GraphTyper2 enables population-scale genotyping of
genome sequencing and expression data of GTEx samples (phs000424.v8.p2) can be structural variation using pangenome graphs. Nat. Commun. 10, 5402 (2019).
accessed from https://www.gtexportal.org/home/datasets. The Source Data for Figs. 1c, 27. Garrison, E. et al. Variation graph toolkit improves read mapping by
2b, c, e, 3, 4e, Supplementary Figs. 1, 5–17, 19-20, 29, 32, 34–40 and Supplementary representing genetic variation in the reference. Nat. Biotechnol. 36, 875–879
Table 6 are available at https://doi.org/10.5281/zenodo.4758205. Source data are provided (2018).
with this paper. 28. Pevzner, P. A., Tang, H. & Tesler, G. De novo repeat classification and
fragment assembly. Genome Res. 14, 1786–1796 (2004).
Code availability 29. Jiang, Z. et al. Ancestral reconstruction of segmental duplications reveals
The overall analysis pipeline is delivered in a software package at https://github.com/
punctuated cores of human genome evolution. Nat. Genet. 39, 1361–1368
ChaissonLab/danbing-tk56. (2007).
30. Raphael, B., Zhi, D., Tang, H. & Pevzner, P. A novel method for multiple
alignment of sequences with repeated and shuffled elements. Genome Res. 14,
Received: 24 December 2020; Accepted: 10 June 2021; 2336–2346 (2004).
31. Iqbal, Z., Turner, I. & McVean, G. High-throughput microbial population
genomics using the Cortex variation assembler. Bioinformatics 29, 275–276
(2013).
32. Iqbal, Z., Caccamo, M., Turner, I., Flicek, P. & McVean, G. De novo assembly
and genotyping of variants using colored de Bruijn graphs. Nat. Genet. 44,
References 226–232 (2012).
1. Consortium, I. H. G. S., International Human Genome Sequencing 33. Seo, J.-S. et al. De novo assembly and phasing of a Korean human genome.
Consortium. Initial sequencing and analysis of the human genome. Nature Nature 538, 243–247 (2016).
409, 860–921 (2001). 34. Zook, J. M. et al. A robust benchmark for detection of germline large deletions
2. Viguera, E., Canceill, D. & Ehrlich, S. D. Replication slippage involves DNA and insertions. Nat. Biotechnol. https://doi.org/10.1038/s41587-020-0538-8.
polymerase pausing and dissociation. EMBO J. 20, 2587–2595 (2001). (2020).
3. Gatchel, J. R. & Zoghbi, H. Y. Diseases of unstable repeat expansion: 35. Porubsky, D. et al. Dense and accurate whole-chromosome haplotyping of
mechanisms and common principles. Nat. Rev. Genet. 6, 743–755 (2005). individual genomes. Nat. Commun. 8, 1293 (2017).
4. Hannan, A. J. Tandem repeats mediating genetic plasticity in health and 36. Kolmogorov, M., Yuan, J., Lin, Y. & Pevzner, P. A. Assembly of long, error-
disease. Nat. Rev. Genet. 19, 286–298 (2018). prone reads using repeat graphs. Nat. Biotechnol. 37, 540–546 (2019).
NATURE COMMUNICATIONS | (2021)12:4250 | https://doi.org/10.1038/s41467-021-24378-0 | www.nature.com/naturecommunications 11ARTICLE NATURE COMMUNICATIONS | https://doi.org/10.1038/s41467-021-24378-0
37. Benson, G. Tandem repeats finder: a program to analyze DNA sequences. Acknowledgements
Nucleic Acids Res. 27, 573–580 (1999). This work is funded by NHGRI U01 HG010973 and U24 HG007497. 1000 Genomes
38. Rakocevic, G. et al. Fast and accurate genomic analyses using genome graphs. Acknowledgement: the cell lines/DNA samples obtained from the NIGMS Human
Nat. Genet. 51, 354–362 (2019). Genetic Cell Repository at the Coriell Institute for Medical Research were generated at
39. Rautiainen, M., Mäkinen, V. & Marschall, T. Bit-parallel sequence-to-graph the New York Genome Center with funds provided by NHGRI Grants 3UM1HG008901-
alignment. Bioinformatics 35, 3599–3607 (2019). 03S1 and 3UM1HG008901-04S2.
40. Fairley, S., Lowy-Gallego, E., Perry, E. & Flicek, P. The International Genome
Sample Resource (IGSR) collection of open human genomic variation
resources. Nucleic Acids Res. 48, D941–D947 (2020).
Author contributions
T.Y.L. and M.J.P.C. performed data analysis and wrote the manuscript. M.J.P.C.
41. Redon, R. et al. Global variation in copy number in the human genome.
supervised the work. The Human Genome Structural Variation Consortium generated
Nature 444, 444–454 (2006).
sequencing data.
42. Sudmant, P. H. et al. Global diversity, population stratification, and selection
of human copy-number variation. Science 349, aab3761 (2015).
43. Bakhtiari, M. et al. Variable number tandem repeats mediate the expression of Competing interests
proximal genes. Nat. Commun. 12, 1–12 (2021). The authors declare no competing interests.
44. Wellcome Trust Case Control Consortium. et al. Association scan of 14,500
nonsynonymous SNPs in four diseases identifies autoimmunity variants. Nat.
Genet. 39, 1329–1337 (2007). Additional information
45. Franke, A. et al. Genome-wide meta-analysis increases to 71 the number of Supplementary information The online version contains supplementary material
confirmed Crohn’s disease susceptibility loci. Nat. Genet. 42, 1118–1125 (2010). available at https://doi.org/10.1038/s41467-021-24378-0.
46. Ye, C. J. et al. Genetic analysis of isoform usage in the human anti-viral
response reveals influenza-specific regulation of transcripts under balancing Correspondence and requests for materials should be addressed to M.J.P.C.
selection. Genome Res. 28, 1812–1825 (2018).
Peer review information Nature Communications thanks Sai Chen, Erik Garrison and
47. Koolen, D. A. et al. Clinical and molecular delineation of the 17q21.31
the other, anonymous, reviewer(s) for their contribution to the peer review of this work.
microdeletion syndrome. J. Med. Genet. 45, 710–720 (2008).
Peer reviewer reports are available.
48. Witoelar, A. et al. Genome-wide pleiotropy between parkinson disease and
autoimmune diseases. JAMA Neurol. 74, 780–792 (2017).
Reprints and permission information is available at http://www.nature.com/reprints
49. Hannan, A. J. Tandem repeat polymorphisms: modulators of disease
susceptibility and candidates for ‘missing heritability’. Trends Genet. 26, 59–65
(2010). Publisher’s note Springer Nature remains neutral with regard to jurisdictional claims in
50. Porubsky, D. et al. Fully phased human genome assembly without parental published maps and institutional affiliations.
data using single-cell strand sequencing and long reads. Nat. Biotechnol.
https://doi.org/10.1038/s41587-020-0719-5 (2020).
51. LaPierre, N. et al. Identifying causal variants by fine mapping across multiple Open Access This article is licensed under a Creative Commons
studies. https://doi.org/10.1101/2020.01.15.908517 (2020). Attribution 4.0 International License, which permits use, sharing,
52. Braida, C. et al. Variant CCG and GGC repeats within the CTG expansion adaptation, distribution and reproduction in any medium or format, as long as you give
dramatically modify mutational dynamics and likely contribute toward appropriate credit to the original author(s) and the source, provide a link to the Creative
unusual symptoms in some myotonic dystrophy type 1 patients. Hum. Mol. Commons license, and indicate if changes were made. The images or other third party
Genet. 19, 1399–1412 (2010). material in this article are included in the article’s Creative Commons license, unless
53. Paten, B., Novak, A. M., Eizenga, J. M. & Garrison, E. Genome graphs and the indicated otherwise in a credit line to the material. If material is not included in the
evolution of genome inference. Genome Res. 27, 665–676 (2017). article’s Creative Commons license and your intended use is not permitted by statutory
54. Li, H., Feng, X. & Chu, C. The design and construction of reference regulation or exceeds the permitted use, you will need to obtain permission directly from
pangenome graphs with minigraph. Genome Biol. 21, 265 (2020). the copyright holder. To view a copy of this license, visit http://creativecommons.org/
55. Seabold, S. & Perktold, J. Statsmodels: econometric and statistical modeling with licenses/by/4.0/.
python. In Proc. 9th Python in Science Conference. Vol. 5761 (Austin, TX, 2010).
56. Lu, T.-Y. & Chaisson, M. ChaissonLab/danbing-tk: manuscript-1. Zenodo
https://doi.org/10.5281/ZENODO.4758205 (2021). © The Author(s) 2021
The Human Genome Structural Variation Consortium
Katherine M. Munson2, Alexandra P. Lewis2, Qihui Zhu3, Luke J. Tallon4, Scott E. Devine4, Charles Lee3,5,6 &
Evan E. Eichler2,7
2
Department of Genome Sciences, University of Washington School of Medicine, Seattle, WA, USA. 3The Jackson Laboratory for Genomic
Medicine, Farmington, CT, USA. 4Institute for Genome Sciences, University of Maryland School of Medicine, Baltimore, MD, USA. 5Precision
Medicine Center, The First Affiliated Hospital of Xi’an Jiaotong University, Xi’an, Shaanxi, China. 6Department of Graduate Studies–Life Sciences,
Ewha Womans University, Ewhayeodae-gil, Seodaemun-gu, Seoul, South Korea. 7Howard Hughes Medical Institute, University of Washington,
Seattle, WA, USA.
12 NATURE COMMUNICATIONS | (2021)12:4250 | https://doi.org/10.1038/s41467-021-24378-0 | www.nature.com/naturecommunicationsYou can also read