Brown bear damage: patterns and hotspots in Croatia - Cambridge University Press
←
→
Page content transcription
If your browser does not render page correctly, please read the page content below
Brown bear damage: patterns and hotspots in Croatia
DÁRIO HIPÓLITO, SLAVEN RELJIĆ, LUÍS MIGUEL ROSALINO, SETH M. WILSON
C A R L O S F O N S E C A and Đ U R O H U B E R
Abstract Human–bear conflicts resulting from livestock Introduction
depredation and crop use are a common threat to the brown
bear Ursus arctos throughout its range. Understanding these
conflicts requires the recording and categorization of in-
cidents, assessment of their geographical distribution and
N egative interactions between people and wildlife, often
referred to as human–wildlife conflict, are one of the
primary challenges to large carnivore conservation (Treves
frequency, and documentation of the financial costs and & Karanth, ), particularly in Europe where human po-
the presence of any preventative measures. Damage com- pulations and activities often overlap with the ranges of
pensation schemes can help mitigate conflicts and, in large carnivores. Such negative interactions are often related
some cases, improve acceptance of bears. This study to wild animals’ use of biological resources that are pro-
aims to elucidate the major factors determining the pat- duced (e.g. crops, livestock, beehives) or exploited (e.g.
terns of damage caused by bears, examine the effective- game) by humans (Kruuk, ). The evaluation of such
ness of preventative measures in reducing such damage, damage, the underlying drivers and the efficacy of damage
and identify bear damage hotspots in Croatia. Our ana- prevention and compensation frameworks is crucial for
lysis is based on damage reports provided by hunting or- large carnivore conservation (Schwerdtner & Gruber,
ganizations to the Croatian Ministry of Agriculture ; Rigg et al., ). This is particularly important for
during –. The highest number of claims were species such as the brown bear Ursus arctos because damage
made for damage to field crops and orchards. Damage caused by bears tends to attract less public attention than
to livestock, agricultural crops and beehives resulted in that caused by wolves or large felids. As a result, public in-
the highest total cost to farmers. Damage to beehives stitutions focus less on assessing the impact of such damage
and to automatic corn feeders for game species incurred on rural populations, which limits the efficiency of mitiga-
the highest cost per damage event. We identified a hotspot tion measures (Can et al., ). In this analysis we use the
for bear damage claims in Croatia, located near Risnjak term conflict to refer broadly to incidents caused by brown
National Park and the border with Slovenia. Damage ap- bears and the term damage to refer specifically to economic
pears higher in areas that have more villages closer to pro- losses.
tected areas and a greater per cent of forest cover, Brown bears were present historically throughout con-
indicating a synergistic effect of protected environments tinental Europe (Zedrosser et al., ; Trouwborst, ),
that facilitate bear movements and the presence of but were nearly extirpated from western and southern
human activities that provide easily accessible food for Europe and from many areas in eastern and northern
bears. Europe before World War II, primarily as a result of defor-
estation and human persecution (Zedrosser et al., ;
Keywords Brown bear, Croatia, damage compensation,
Huber et al., a; Trouwborst, ). However, bear be-
Dinaric Mountains, human–wildlife conflict, large carni- haviour is plastic and bears can adapt to certain levels of dis-
vores, Ursus arctos, wildlife management turbance. This, along with increasing conservation efforts,
Supplementary material for this article is available at rural abandonment and rewilding of many European re-
https://doi.org/./S gions, has allowed bears to gradually reoccupy former habi-
tats (Huber et al., a).
In Croatia brown bears occur in the Dinaric Mountains,
from Slovenia to Bosnia and Herzegovina and further
south-east (Servheen et al., ; Zedrosser et al., ),
DÁRIO HIPÓLITO* (Corresponding author), SLAVEN RELJIĆ and ĐURO HUBER with an estimated population of c. , (Kocijan &
Biology Department, Faculty of Veterinary Medicine, University of Zagreb, Huber, ; Majić et al., ; Knott et al., ). Brown
Heinzelova, Zagreb, Croatia. E-mail dhipolito@ua.pt
bear management is challenging because of the species’ bio-
LUÍS MIGUEL ROSALINO and CARLOS FONSECA Departamento de Biologia &
CESAM, Universidade de Aveiro, Aveiro, Portugal
logical and ecological characteristics (large body, long gesta-
tion period and opportunistic feeding strategy) and its
SETH M. WILSON Northern Rockies Conservation Cooperative, Jackson, USA
history of conflicts with people. In Croatia the majority of
*Also at: Departamento de Biologia & CESAM, Universidade de Aveiro, Aveiro,
Portugal human–bear conflicts result from livestock depredation
Received July . Revision requested September .
and crop use (Nyhus et al., ; Majić et al., ;
Accepted January . First published online September . Bautista et al., ). The most common strategies to
Oryx, 2020, 54(4), 511–519 © 2018 Fauna & Flora International doi:10.1017/S0030605318000236
Downloaded from https://www.cambridge.org/core. IP address: 46.4.80.155, on 15 Feb 2021 at 13:38:23, subject to the Cambridge Core terms of use, available at https://www.cambridge.org/core/terms.
https://doi.org/10.1017/S0030605318000236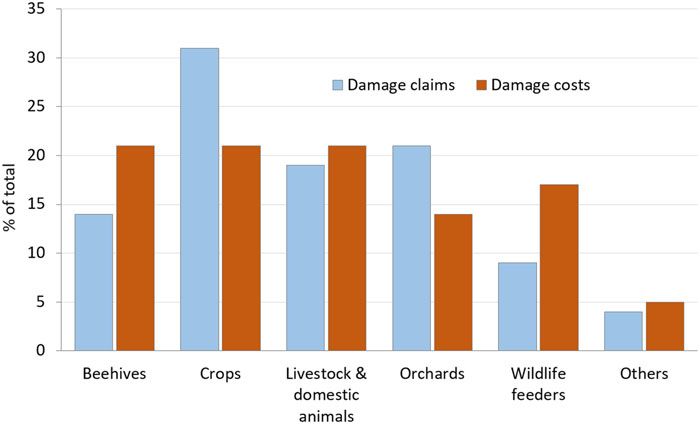
512 D. Hipólito et al.
minimize these conflicts include prevention tools and com- organization responsible for managing the area fills out a re-
pensation schemes (Treves & Karanth, ). In Croatia the port and sends it to the Croatian Ministry of Agriculture,
latter have been the focal approach, aiming to distribute where the information about the type and amount of dam-
damage costs between the conservation beneficiary (govern- age, date and location of the incident, name of the injured
ment or hunting organizations) and the person or institu- party, and presence of any preventative measures are com-
tion suffering the damage (Fourli, ; Nyhus et al., piled. We included in our analysis all reported claims that
). There are two types of compensation schemes: ex- were confirmed as damage caused by bears, including claims
post compensation, which is paid after damage occurs, that were and were not subsequently compensated for.
and compensation in advance, which is paid prior to any We analysed the number of damage claims, the cost asso-
damage occurring and based on an estimation of expected ciated with the damage and the frequency of incidents by
losses (Schwerdtner & Gruber, ). Regardless of the damage type. Damage type was categorized as losses asso-
type of scheme being used, the priority should be to prevent ciated with crops, orchards/vineyards (including domestic
damage from occurring or to minimize its impact. This re- gardens), beehives, and wildlife/game feeders. Corn feeders
quires an understanding of the types and cost of damage are widely used in Croatia to provide extra food for game spe-
events, their frequency, and the spatial distribution and pat- cies such as red deer Cervus elaphus, wild boar Sus scrofa and
terns of such incidents. (Gunther et al., ; Wilson et al., bears. Additionally, we analysed incidents involving damage
; Can et al., ). to property such as barn doors, vehicles, shooting posts or
In Croatia mitigation of human–bear conflict is based pri- silage depots, and losses of livestock and domestic animals.
marily on the ex-post compensatory approach, although bear For the latter category, we assessed the number of bear at-
hunting is also allowed as a strategy to minimize conflicts. tacks per type of livestock and domestic animal (poultry, cat-
Ex-post compensation is managed and paid by local hunting tle, red deer, dogs, donkeys, goats, horses, ostriches, pigs,
organizations, which have an allocated quota for bear hunting rabbits and sheep). To test whether there was a positive or
(Huber et al., a; Majić et al., ; Bišćan et al., ). negative trend in the total number of damage events per
However, when damage occurs in national parks, the govern- year we used a linear regression model (Zar, ), and χ
ment is responsible for paying compensation (Huber et al., tests (Zar, ) to assess if the number of damage events (ob-
a). Damage will usually be fully compensated only if served values) differed between damage types. We gathered
the person or institution suffering it has previously implemen- data on the intensity of livestock depredation by bears across
ted protection measures (e.g. proper fencing) and behaves re- Europe using the estimations of the annual per capita loss
sponsibly (e.g. by guarding livestock and not planting crops presented by Kazcensky (), i.e. the number of livestock
that entice bears near the forest edge; Huber et al., a,b); lost per year and per bear. For Croatia, we used the method-
but occasionally hunting organizations compensate for dam- ology described by Kazcensky () to estimate this metric,
age in the absence of protection measures by providing the allowing us to compare livestock depredation across all
farmer with an amount of crops equivalent to the damage European countries where brown bears occur. The number
caused by bears. To apply compensation strategies efficiently, of bears used for this calculation was the annual estimate of
it is crucial to review available data, so that damage patterns the total bear population in Croatia, as provided by the hunt-
can be detected and research needs identified (Bruggers ing organizations. To identify damage types that have the big-
et al., ). No such analysis has previously been carried gest impact in terms of cost, we defined the following damage
out in Croatia, and we aim to contribute new insights for a bet- categories: Wildlife feeder, Beehive, Orchards, Crops,
ter understanding of human–bear conflicts. Specifically, our Livestock and domestic animals, and Other. We used partial
objectives are to () analyse brown bear damage in Croatia least square regressions (Roy & Roy, ; Carrascal et al.,
during –, including the type of damage, associated ) to determine the influence of these damage categories
costs, and the factors determining damage patterns, () deter- (all binary variables), together with the presence of protective
mine if preventative tools reduce brown bear damage and as- measures on the damage compensation paid. Model signifi-
sociated costs, and () identify bear damage hotspots. cance was assessed by a Stone–Geisser Q test, which evalu-
ates the accuracy of models and their parameters compared
to observed values through a cross-validation process (Götz
Methods et al., ). We used Q $ . (Cao et al., ) to assign
significance to the contribution of the predictors, and R to
Damage claims and costs assess the proportion of the total variance that was explained
by the model (Zar, ).
We analysed all damage reports for – that were We evaluated whether the frequency of damage to do-
systematically collected and provided annually by hunting mestic animals decreased when protective measures were
organizations to the Croatian Ministry of Agriculture. used, by testing whether the number of damage claims dif-
When damage occurs and is reported, the hunting fered between properties using protection measures (Cat)
Oryx, 2020, 54(4), 511–519 © 2018 Fauna & Flora International doi:10.1017/S0030605318000236
Downloaded from https://www.cambridge.org/core. IP address: 46.4.80.155, on 15 Feb 2021 at 13:38:23, subject to the Cambridge Core terms of use, available at https://www.cambridge.org/core/terms.
https://doi.org/10.1017/S0030605318000236Brown bear damage patterns in Croatia 513
and those without them (Cat), using a χ test. All analyses The landscape protection status hypothesis (H) tests
were performed using R .. (R Development Core Team, whether areas where bears were not hunted acted as source
), and partial least square regression models were built environments (Hansen, ) and were therefore subject to
using the package plsdepot (Sanchez, ). more frequent damage events. The landscape protection sta-
tus is the distance in km between the edge of a hunting re-
serve and the nearest edge of a protected area.
Damage hotspots The bear population characteristic hypothesis (H) ex-
amines whether more stable populations and constant pres-
We analysed the spatial distribution of damage claims using
ence of bears lead to more frequent damage events. Bear
a geographical information system. Hotspot areas were de-
occurrence was based on the Croatian Bear Management
lineated using the Optimized Hot Spot Analysis tool in
Plan and the LIFE DinAlp Bear project report (i.e. constant
ArcMap .. (Esri, Redlands, USA). Each damage location,
vs sporadic presence; Huber et al., b; Skrbinšek et al.,
defined by its latitude and longitude coordinates, was as-
) and the number of bears $ years old that were
signed to a × km grid cell on a map of Croatia. For
hunted and killed in hunting reserves was used as a surro-
each grid cell, we tallied the number of damage events and
gate for population stability.
calculated the Getis–Ord Gi* statistic (Songchitruksa &
The hybrid hypothesis (H) used variables included in
Zeng, ) by scoring it with a z-score and probability.
the best-fit models from each of the previous hypotheses
The resulting z-score was based on the distance between
where the % confidence interval of their coefficients did
cells and the number of damage events within them.
not include zero. This allowed us to detect a positive or
Thus, cells with high numbers of damage events that were
negative influence on the damage frequency.
in close proximity to each other produced high z-scores.
We first tested for data multicollinearity using Spearman’s
To be characterized as a statistically significant hotspot, a
correlation coefficient (ρ; Zar, ), and identified outliers
cell had to be surrounded by cells with high z-scores and
by using a χ test (Komsta, ). Variables were considered
probabilities (Ord & Getis, ). These statistics allowed
highly correlated if ρ . .. When two covariates were cor-
us to compare the number of damage events in each cell
related we excluded those less correlated with the dependent
and its neighbouring cells to the mean number of damage
variable.
events per grid cell across the entire study area. Where
We built models using all possible combinations of
any observed difference is larger than expected by chance,
the covariates for each hypothesis and based our model
a statistically significant z-score is achieved. We used the
selection on the Akaike Information Criterion corrected
Getis–Ord Gi* statistic to identify patterns in positive spatial
for small samples (AICc; Burnham & Anderson, ).
clustering. This allowed us to discriminate between cells of
Models with ΔAICc , were considered the most parsimo-
high and low spatial association (Songchitruksa & Zeng,
nious (Burnham & Anderson, ).
), and to generate a density surface raster layer.
We compared the AICc of the best models in each hy-
pothesis and that of the hybrid hypothesis (H) using R (R
Factors influencing bear damage frequency Development Core Team, ) together with the MuMIn
package (Barton, ). Model evaluation was performed
To evaluate which factors influence damage frequency (the using the pseudo R and the likelihood ratio test comparing
number of damage claims per area) in each hunting reserve the deviance of the null best model (Dobson, ).
(the damage compensation management unit in Croatia),
we used generalized linear models (Zuur et al., ), with
a Gaussian distribution. We defined four hypotheses that Results
could potentially explain differences in damage frequency
between different areas. Damage claims and costs
The land cover hypothesis (H) assumes that herbaceous
vegetation is a habitat used by bears (Posillico et al., ) During – a total of claims for damage caused
and examines whether damage occurred more frequently in by bears were reported to the Croatian Ministry of
such areas. Land cover variables were extracted from Corine Agriculture, a mean of c. per year. A total of EUR ,
land cover maps (CLC, ): per cent of forests, scrub was paid in compensation during this period, with a mean
and/or herbaceous vegetation, artificial surfaces or houses, of EUR , per year. There was no trend in the annual
arable land and permanent crops, heterogeneous agricultur- number of claims over this period (Spearman correlation
al areas (a surrogate for the presence of human activities) coefficient = −., P = .). There was a significantly
and wetlands, water bodies, and the number of villages with- higher proportion of claims associated with crop damage to
in each hunting reserve (see CLC, , for definitions of corn, oat and hay fields compared to the other types of dam-
these categories). age (% of all damage claims; χ = .; P , .; Fig. ).
Oryx, 2020, 54(4), 511–519 © 2018 Fauna & Flora International doi:10.1017/S0030605318000236
Downloaded from https://www.cambridge.org/core. IP address: 46.4.80.155, on 15 Feb 2021 at 13:38:23, subject to the Cambridge Core terms of use, available at https://www.cambridge.org/core/terms.
https://doi.org/10.1017/S0030605318000236514 D. Hipólito et al.
FIG. 1 Proportion (%) of different
types of asset damaged by brown
bears Ursus arctos of the total
number of bear-related damage
claims and associated costs in Croatia
(–).
A different pattern was evident when we analysed the TABLE 1 Influence of assessed variables on compensation paid for
amount of damage costs. The majority of the total compen- damage caused by brown bears Ursus arctos in Croatia during
sation was paid for damage to beehives, crops and domestic –, with their loads and weights on the first component
animals, including livestock (% each; Fig. ). The number of partial least squares regression. A variable’s weight is its contri-
of damage claims and associated costs from beehives, crops bution to the first component of partial least squares regression.
and domestic animals was significantly higher (χ = .; Variable Load Weight
P , .) where protective measures were absent. Most live-
Wildlife feeders 0.448 0.482
stock damage claims were associated with sheep (%, Beehives 0.408 0.406
sheep killed in attacks, mean . per attack) and chickens Crops 0.113 0.073
(%; chickens killed in attacks, mean . per attack), Livestock & domestic animals 0.108 0.103
with multiple individuals usually killed in an incident. Attacks Orchards −0.780 −0.750
on individual animals involved mostly large mammals such Other 0.082 0.058
as donkeys, horses and red deer (which are also raised as Protection measures −0.064 −0.141
farm animals in Croatia), but also ostriches and dogs
(Supplementary Table ). The number of animals killed per with beehives (load = ., weight = .; Table ) and
attack was typically greater where protective measures had wildlife feeders (load = ., weight = .; Table ).
been implemented compared to those where protective mea- Conversely, orchard damage contributed less to damage
sures had not been implemented (Supplementary Table ). costs, with a negative correlation with the total cost of dam-
The reports showed that beehives, of which were age (load = −., weight = −.; Table ).
unprotected, were damaged in events. The mean number
of beehives damaged per attack was . (. without and .
with protection) and the mean monetary value per damaged Damage hotspots
beehive was EUR .
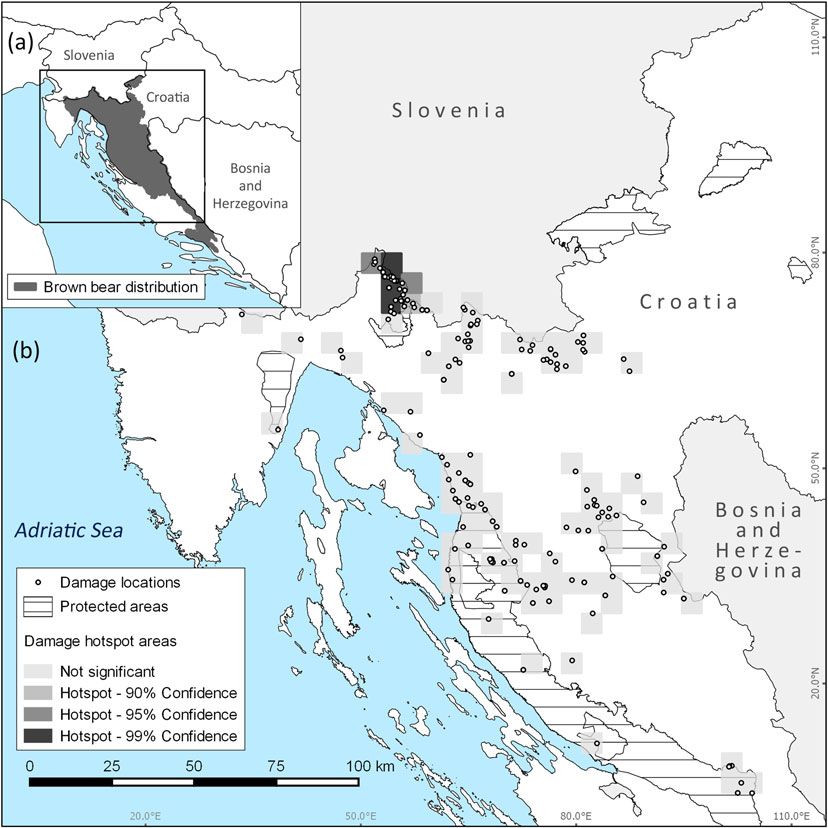
The mean intensity of livestock depredation (annual per We identified a hotspot where most damage claims were
capita loss) during – was . livestock per bear clustered, in the north-west of the brown bear range in
per year. For beehives, the intensity of depredation was Croatia, near the border with Slovenia (Fig. ).
. hives per bear per year. These calculations are based
on the estimated annual bear population in the country, Factors influencing bear damage frequency
which ranged from in to , in .
Partial least squares regression analysis showed that The values for per cent cover of forests and scrub and/or
c. % of damage cost variability was explained by the herbaceous vegetation were highly correlated (r = −.,
type of damage and whether protective measurements P , .) and therefore we excluded the latter from the
were present. The Stone–Geisser Q test value was ., in- generalized linear model analysis, as it was less correlated
dicating that model estimates were accurate (i.e. . .). than the former with the dependent variable. We identified
The amount of compensation was most influenced by the three outliers, which were also excluded. Five, one and three
type of damage, with higher values primarily associated models were identified as the best models for the land cover,
Oryx, 2020, 54(4), 511–519 © 2018 Fauna & Flora International doi:10.1017/S0030605318000236
Downloaded from https://www.cambridge.org/core. IP address: 46.4.80.155, on 15 Feb 2021 at 13:38:23, subject to the Cambridge Core terms of use, available at https://www.cambridge.org/core/terms.
https://doi.org/10.1017/S0030605318000236Brown bear damage patterns in Croatia 515
FIG. 2 Brown bear distribution (a) and damage claim locations and hotspots (b) in Croatia for –.
landscape protection status and bear population character- the per cent of forest cover within the hunting reserves had a
istics hypotheses, respectively (Table ; Supplementary positive effect (Table ). The best model’s pseudo R was
Material ). The hybrid hypothesis models had lower . (Table ) and was better fitted than the null model
AICc values (.–.), with a minimum ΔAICc of (χ = .; P , .; Table ).
. for the lowest model for the other hypotheses, and
thus had the highest support. Of the models built for this
hypothesis, two were the most parsimonious, having Discussion
ΔAICc , (Table ). However, the ΔAICc values of the
second-best model were close to the threshold of : the differ- To address human–bear conflicts effectively it is imperative
ence is because the best model has one variable less (see AICc to identify the types of damage and the geographical distri-
formula in Burnham & Anderson, ). Model averaging is bution of damage events. This is critical for effective wildlife
less appropriate in such situations and the most parsimonious management, conservation planning and for targeting con-
model should be selected (Banner & Higgs, ). For the flict mitigation measures in areas where negative impacts on
three variables included in the best models of the hybrid hy- people and bears can be minimized.
pothesis, the % confidence interval did not include zero, so The majority (%) of compensation claims related to
it is possible to determine whether their effect on the depend- bears in Croatia were made for damage to crops and orch-
ent value is positive or negative. Distance to the nearest pro- ards. In contrast, Bautista et al. () found that . % of
tected area had a negative effect on the number of bear bear damage events in western Europe involved livestock
damage events per km, whereas the number of villages and losses and destruction of apiaries. This difference is
Oryx, 2020, 54(4), 511–519 © 2018 Fauna & Flora International doi:10.1017/S0030605318000236
Downloaded from https://www.cambridge.org/core. IP address: 46.4.80.155, on 15 Feb 2021 at 13:38:23, subject to the Cambridge Core terms of use, available at https://www.cambridge.org/core/terms.
https://doi.org/10.1017/S0030605318000236516 D. Hipólito et al.
TABLE 2 Best generalized linear regression models (ΔAICc , ) for each hypothesis formulated to explain variation in bear damage fre-
quency, ranked by the ΔAICc values. Overall best models are in bold.
Degrees of Overall Akaike
Model freedom AICc1 ΔAICc2 ΔAICc3 weight
Hypothesis 1: Land cover
No. of villages + % Forest cover 4 1281.61 0.00 4.70 0.178
% Forest cover 3 1282.63 1.02 5.72 0.107
No. of villages + % Forest cover + % Artificial surfaces & houses 5 1282.75 1.14 5.84 0.101
% Forest cover + % Heterogeneous agricultural areas 5 1283.20 1.59 6.29 0.08
% Arable land & permanent crops + % Forest cover 5 1283.26 1.65 6.35 0.078
Hypothesis 2: Landscape protection status
Distance to protected areas 3 1284.60 0.00 7.69 1.000
Hypothesis 3: Bear population characteristics
No. of bears $ 8 years old hunted + Type of bear occurrence 4 1285.24 0.00 8.33 0.400
Type of bear occurrence 3 1285.49 0.25 8.58 0.355
No. of bears $ 8 years old hunted 3 1286.87 1.63 9.96 0.177
Hypothesis 4: Hybrid
Distance to protected areas + No. of villages + % Forest cover 5 1276.91 0.00 0.004 0.395
Type of bear occurrence + Distance to protected areas + No. of 6 1278.89 1.98 1.985 0.146
villages + % Forest cover
Akaike Information Criterion, adjusted for small sample size.
Difference from best ranking (lowest AIC) model for the same hypothesis.
Difference from best ranking (lowest AIC) model across all hypotheses.
Best model.
Second-best model.
TABLE 3 Variables included in overall best model (hybrid hypothesis), and their coefficients (standardized using the partial standard de-
viations), standard errors, z-values, significance and % CI. Variables for which the % CI does not include zero are in bold.
Significance
Variable Coefficient ± SE z-value P (.|z|) 95% CI
Intercept −0.399 ± 1.764 −0.226 0.821 −3.858–3.060
Distance to protected areas −0.080 ± 0.031 −2.606 0.010 −0.140–−0.020
No. of villages 0.158 ± 0.077 2.064 0.041 0.008–0.309
% Forest cover 0.066 ± 0.025 2.631 0.009 0.017–0.115
probably a result of higher accessibility and availability of damage claims was particularly high, with recorded
crops and orchards to bears in Croatia, although no system- events. Local communities reported a sharp decrease in
atic data are currently available regarding the availability of beechnut Fagus sylvatica and wild berry abundance in this
such commodities in Croatia. Compensation costs were year (DH, pers. obs.). This shortage of forest foods may have
highest for damage to crops, livestock or domestic animals, led bears closer to villages in search of alternative food
and beehives, each accounting for c. % of the total com- sources and may have resulted in an increased number of
pensation payments made (i.e. together, representing % damage events. Although the bear population appears to
of the total payments). There was a high, positive correlation be increasing in Croatia (Bautista et al., ), the mean
between the compensation paid and the damage associated number of damage claims per year per bear is one of the
with beehives and wildlife feeders, with the converse for lowest in Europe (Bautista et al., ).
orchards. Beehives and feeder structures are highly valuable The application of effective preventative measures or an
and damage to them often results in complete economic increase in habitat productivity may be contributing to the
loss. In orchards, bears may feed in a less destructive man- relatively low and stable number of damage claims.
ner, picking fruit from trees and causing less damage as a However, further research is needed to examine the me-
result, although they may occasionally destroy trees chanisms behind this pattern.
(Mahmoud et al., ). A possible factor could be supplementary feeding during
There was no trend in the number of damage events per hunting periods (March–May and September–December)
year during –, although in the number of in Croatia, which, together with abundant wild forest
Oryx, 2020, 54(4), 511–519 © 2018 Fauna & Flora International doi:10.1017/S0030605318000236
Downloaded from https://www.cambridge.org/core. IP address: 46.4.80.155, on 15 Feb 2021 at 13:38:23, subject to the Cambridge Core terms of use, available at https://www.cambridge.org/core/terms.
https://doi.org/10.1017/S0030605318000236Brown bear damage patterns in Croatia 517
foods, may keep bears away from human settlements be- in Croatia (Kaczensky, ). However, annual per capita
cause it reduces their need to seek and exploit anthropogen- loss estimates are dependent on the robustness of bear popu-
ic food sources (Bautista et al., ). However, it is the lation estimates. We used the official estimates published by
converse in Slovenia (Jerina et al., ; Kavčič et al., the Croatia government, but these may not be accurate be-
), with an increase in bear densities and bear-related cause hunting organizations often deal with compensation
damage events apparently linked to supplementary feeding. claims without reporting them to government institutions;
Such differences may be linked to specific landscape charac- our results should therefore be interpreted cautiously. This
teristics and species distribution patterns, but the exact rea- situation could be related to the compensation method
sons are difficult to determine. The bear population in used in Croatia. Because a majority (. %) of hunters are
Slovenia is concentrated in only % of the country, reach- also farmers, and as a hunting right, land owners are respon-
ing mean densities of bears/ km and high natality sible for damage management in Croatia, they may be more
rates in those areas, which are supported by supplementary protective of their livestock or domestic animals compared to
feeding sites (Jerina et al., ; Kavčič et al., ). In their counterparts elsewhere in Europe, for example by keep-
Croatia the bear population is concentrated in % of the ing their animals in shelters during the night when bears are
country and the mean density is lower than in Slovenia ( more active. Most of the damage associated with livestock is
bears/ km). The higher bear density in Slovenia results a result of predation on sheep, one of the preferred prey of
in a higher number of bears inhabiting areas near human brown bears in the area, which is consistent with data col-
settlements, and the spatial distribution of forests and settle- lected in other European countries (e.g. Slovenia; Kavčič
ments allows bears to visit feeding sites in forests and et al., ). Farmers in Croatia traditionally manage sheep
human settlements during the same night (Kavčič et al., flocks in open areas, making them easier prey for bears
), increasing the likelihood of damage. (Fourli, ; Dečak et al., ; Huber et al., b).
Our data confirm that agricultural or livestock areas Similarly, the high number of chickens killed per attack is
without protective measures are more likely to be damaged a result of the management practice of keeping large num-
by bears. Most damage to beehives and livestock is avoidable, bers of chickens in henhouses.
considering that effective protection measures exist (Swenson Beehive annual per capita loss in Croatia (.) is lower
et al., ). Electric fences, for example, are effective against than in other European countries, e.g. Greece (.;
bears (Coordination Board for Bear Management in Austria, Karamanlidis et al., ). This may be a result of the higher
), but many farmers are still reluctant to use them, prob- numbers of beehives available per location in the brown
ably because of the associated cost. Little research has been bear range in Greece compared to Croatia and probably ex-
done in Croatia to test the efficacy and functionality of plains a higher number of beehives being damaged in an at-
damage protection measures, but farmers should be involved tack when unprotected (Svečnjak et al., ).
in developing and implementing preventative measures that Preventative measures are an important tool for mitigat-
could reduce damage claims. Crop protection can be more ing brown bear damage, but some stakeholders do not apply
costly than the protection of livestock and beehives, particu- them. We recommend that compensation should be linked
larly for large fields, but alternative approaches can be imple- to the implementation of damage prevention measures
mented. For example, it is common practice in Croatia for (Coordination Board for Bear Management in Austria,
hunting ground managers to compensate the owners of da- ) to encourage their use and ensure a low level of dam-
maged cereal crop fields by providing an amount of replace- age (and consequently of cost and conflict). Hunter-farmers
ment cereals equal to the crop loss caused by bears rather are more likely to implement preventative measures because
than through financial compensation. they are involved with the institutions that pay for bear
Although the number of damage events affecting livestock damage. The amount of damage and number of claims
or domestic animals was lower when protective measures may decrease when protective measures are implemented,
were in place, there is a tendency for a greater number of an- with a consequent amelioration of human–bear conflict.
imals to be killed per attack. This could be because confined We detected a damage hotspot in the north of Croatia
domestic animals become more vulnerable when bears de- near Risnjak National Park. This protected area (. km)
stroy or overcome the protective measures, as their ability to is relatively small compared to the size of a typical brown
escape is limited by the barriers put in place to prevent access. bear home range ( and km for males and females,
Although Croatia has intermediate levels of livestock respectively; Huber & Roth, ). However, the Park is a
density within the European Union (EU; Eurostat, ) refuge for wildlife because of its undisturbed habitat and it
and bears do cause damage to livestock or domestic animals, is probably important for bears because it provides dens
the country’s annual per capita loss of livestock to bears where they can hibernate more safely than in agricultural
(.) is the lowest among European countries. For example, areas (Petram et al., ).
in Sweden, which has one of the lowest EU livestock densities The conflict in this area could be a result of the bears’
(Eurostat, ), the annual per capita loss value is twice that population dynamics in the adjacent protected area. Our
Oryx, 2020, 54(4), 511–519 © 2018 Fauna & Flora International doi:10.1017/S0030605318000236
Downloaded from https://www.cambridge.org/core. IP address: 46.4.80.155, on 15 Feb 2021 at 13:38:23, subject to the Cambridge Core terms of use, available at https://www.cambridge.org/core/terms.
https://doi.org/10.1017/S0030605318000236518 D. Hipólito et al.
model results indicated that hunting reserves close to pro- brown bear damage on a continental scale. Journal of Applied
tected areas had a higher damage frequency, and that Ecology, , –.
B I Š Ć A N , A., B U D O R , I., D O M A Z E T O V I Ć , Z., F O N TA N A P U D I Ć , K.,
areas with higher forest cover and a higher concentration
F R A N C E T I Ć , I., G O S P O Č I Ć , S. et al. () Action Plan for Brown
of villages were more likely to suffer damage. This may in- Bear Management in Republic of Croatia for . Ministry of
dicate a synergistic effect of forests as a protective environ- Agriculture and Ministry of Environmental and Nature Protection.
ment where bears can move freely without being detected Zagreb, Croatia. [In Croatian]
(Posillico et al., ), and the presence of human activity, B R U G G E R S , R.L., O W E N S , R. & H O F F M A N , T. () Wildlife damage
management research needs: perceptions of scientists, wildlife
which may provide easily accessible food for bears, resulting
managers, and stakeholders of the USDA/Wildlife Services program.
in an increased number of damage events (Northrup et al., International Biodeterioration & Biodegradation, , –.
). Mitigation efforts should therefore be focused on B U R N H A M , K.P. & A N D E R S O N , D.R. () Model Selection and
agricultural landscapes near protected areas and forests. Multimodel Inference: A Practical Information-theoretic Approach.
The robustness of our analysis depends on the quality of Springer Verlag, New York, USA.
the data on damage reports, and not all damage claims may C A N , Ö.E., D’C R U Z E , N., G A R S H E L I S , D.L., B E E C H A M , J. &
M AC D O N A L D , D.W. () Resolving human–bear conflict: a global
be reported to the national authorities. However, given that survey of countries, experts, and key factors. Conservation Letters, ,
compensation is paid only if damage is reported, we are con- –.
fident that the hotspot we identified is based on a real pat- C AO , K.-A.L., R O S S OW , D., R O B E R T -G R A N I É , C. & B E S S E , P. () A
tern of damage clustering in this area. sparse PLS for variable selection when integrating omics data.
Although our analysis has the potential to improve Statistical Applications in Genetics and Molecular Biology, , –.
C A R R A S C A L , L.M., G A LV Á N , I. & G O R D O , O. () Partial least
human–wildlife coexistence in Croatia, our results also
squares regression as an alternative to current regression methods
show that only a small fraction of the data variability is ex- used in ecology. Oikos, , –.
plained by our models. Other factors that were not considered CLC () CORINE Land Cover . European Environment
may influence patterns of damage, indicating the need for a Agency, Copenhagen, Denmark. Http://land.copernicus.eu/pan-
broader analysis of the determinants of damage in Croatia. european/corine-land-cover/clc-/view [accessed June ].
C O O R D I N AT I O N B O A R D F O R B E A R M A N A G E M E N T I N A U S T R I A ()
The close relation between those making claims (i.e. farmer-
Bears in Austria – A Management Plan. Reviewed version .
hunters) and the organizations responsible for compensation WWF Österreich, Wien, Austria.
payments presents an opportunity to reduce conflict further D E Č A K , Đ., F R KO V I Ć , A., G R U B E Š I Ć , M., H U B E R , Đ., I V I Č E K , B.,
through prevention. Such an approach would help maintain K U L I Ć , B. et al. () Brown Bear Management Plan for the
economic sustainability and cultural traditions in Croatia Republic of Croatia. Ministry of Agriculture, Forestry and Water
Management, Zagreb, Croatia.
while also protecting the brown bear population.
D O B S O N , A.J. () An Introduction to Generalized Linear Models.
Chapman & Hall, Boca Raton, USA.
Acknowledgements This study was supported by the LIFE E U R O S T AT () Agriculture, Forestry and Fishery Statistics –
DINALP BEAR project, EURONATUR and Bernd Thies Edition. Publications Office of the European Union, Luxembourg.
Foundation, and the Ministry of Agriculture of Croatia. DH, LMR F O U R L I , M. () Compensation for Damage Caused by Bears and
and CF were supported financially by the University of Aveiro Wolves in the European Union: Experiences from LIFE-Nature
(Department of Biology), CESAM (UID/AMB/50017), and FCT/ Projects. European Commission, Luxembourg City, Luxembourg.
MEC through national funds, and co-funding by the FEDER within G Ö T Z , O., L I E H R -G O B B E R S , K. & K R A F F T , M. () Evaluation of
the PT2020 Partnership Agreement and Compete 2020. structural equation models using the partial least squares (PLS)
approach. In Handbook of Partial Least Squares, Springer
Author contributions Data collection: DH and SR; data analysis: Handbooks of Computational Statistics (eds V.E. Vinzi, W.W. Chin,
DH, SR and LMR; writing and revisions: DH, LMR, CF, ĐH and J. Henseler & H. Wang), pp. –. Springer Verlag, Berlin and
SMW; project coordination: ĐH. Heidelberg, Germany.
G U N T H E R , K.A., H A R O L D S O N , M.A., F R E Y , K., C A I N , S.L., C O P E L A N D ,
Conflicts of interest None. J. & S C H WA R T Z , C.C. () Grizzly bear–human conflicts in the
Greater Yellowstone ecosystem, –. Ursus, , –.
H A N S E N , A.J. () Contribution of source–sink theory to protected
Ethical standards This research complies with the Oryx Code of
area science. In Sources, Sinks, and Sustainability Across Landscapes
Conduct for authors.
(eds J. Liu, V. Hull, A. Morzillo & J. Wiens), pp. –. Cambridge
University Press, Cambridge, UK.
References H U B E R , D. & R O T H , H.U. () Movements of European brown bears
in Croatia. Acta Theriologica, , –.
B A N N E R , K.M. & H I G G S , M.D. () Considerations for assessing H U B E R , Đ., K U S A K , J., M A J I Ć -S K R B I N Š E K , A., M A J N A R I Ć , D. &
model averaging of regression coefficients. Ecological Applications, S I N D I Č I Ć , M. (a) A multidimensional approach to managing
, –. the European brown bear in Croatia. Ursus, , –.
B A R T O N , K. () MuMIn: Multi-Model Inference. R package version H U B E R , Đ., J A K Š I Ć , Z., F R KO V I Ć , A., Š T A H A N , Ž., K U S A K , J.,
... Http://CRAN.R-project.org/package=MuMIn [accessed M A J N A R I Ć , D. et al. (b) Brown Bear Management Plan for the
June ]. Republic of Croatia. Ministry of Regional Development, Forestry
B A U T I S T A , C., N AV E S , J., R E V I L L A , E., F E R N Á N D E Z , N., A L B R E C H T , J., and Water Management, Directorate for Hunting and Ministry of
S C H A R F , A.K. et al. () Patterns and correlates of claims for Culture, Directorate for the Protection of Nature, Zagreb, Croatia.
Oryx, 2020, 54(4), 511–519 © 2018 Fauna & Flora International doi:10.1017/S0030605318000236
Downloaded from https://www.cambridge.org/core. IP address: 46.4.80.155, on 15 Feb 2021 at 13:38:23, subject to the Cambridge Core terms of use, available at https://www.cambridge.org/core/terms.
https://doi.org/10.1017/S0030605318000236Brown bear damage patterns in Croatia 519
J E R I N A , K., J O N O Z O V I Č , M., K R O F E L , M. & S K R B I N Š E K , T. () Statistical Computing, Vienna, Austria. Http://www.R-project.org
Range and local population densities of brown bear Ursus arctos in [accessed June ].
Slovenia. European Journal of Wildlife Research, , –. R I G G , R., F I N Ď O , S., W E C H S E L B E R G E R , M., G O R M A N , M.L.,
K AC Z E N S K Y , P. () Large carnivore depredation on livestock in S I L L E R O -Z U B I R I , C. & M AC D O N A L D , D.W. () Mitigating
Europe. Ursus, , –. carnivore–livestock conflict in Europe: lessons from Slovakia. Oryx,
K A R A M A N L I D I S , A., S A N O P O U LO S , A., G E O R G I A D I S , L. & Z E D R O S S E R , , –.
A. () Structural and economic aspects of human–bear conflicts R O Y , P.P. & R O Y , K. () On some aspects of variable selection for
in Greece. Ursus, , –. partial least squares regression models. QSAR & Combinatorial
K AV Č I Č , I., A D A M I Č , M., K AC Z E N S K Y , P., K R O F E L , M. & J E R I N A , K. Science, , –.
() Supplemental feeding with carrion is not reducing brown S A N C H E Z , G. () plsdepot: Partial Least Squares (PLS) data analysis
bear depredations on sheep in Slovenia. Ursus, , –. methods. R package version ... Http://CRAN.R-project.org/
K N O T T , E.J., B U N N E F E L D , N., H U B E R , Đ., R E L J I Ć , S., K E R E Ž I , V. & package=plsdepot [accessed June ].
M I L N E R -G U L L A N D , E.J. () The potential impacts of changes in S C H W E R D T N E R , K. & G R U B E R , B. () A conceptual framework
bear hunting policy for hunting organisations in Croatia. European for damage compensation schemes. Biological Conservation, ,
Journal of Wildlife Research, , –. –.
K O C I J A N , I. & H U B E R , Đ. () Conservation Genetics of Brown Bears S E R V H E E N , C., H E R R E R O , S. & P E Y T O N , B. (eds) () Bears: Status
in Croatia. Final Report. Project: Gaining and Maintaining Public Survey and Conservation Action Plan. International Union for
Acceptance of Brown bear in Croatia (BBI-Matra// through the Conservation of Nature and Natural Resources, Gland,
ALERTIS), Zagreb, Croatia. Switzerland.
K O M S T A , L. () Outliers: Tests for outliers. R package version .. S K R B I N Š E K , T., B R A G A L A N T I , N., C A L D E R O L L A , S., G R O F F , C., H U B E R ,
Http://CRAN.R-project.org/package=outliers [accessed June ]. D., K AC Z E N S K Y , P. et al. () Annual Population Status
K R U U K , H. () Hunter and Hunted. Relationships between Carnivores Report for Brown Bears in Northern Dinaric Mountains and Eastern
and People. Cambridge University Press, Cambridge, UK. Alps. Life DinAlp bear report (LIFE NAT/SI/), Zagreb,
M A H M O U D , M., Q A S H Q A E I , A.T., M A R A S H I , M. & N E J AT , F. () Croatia.
Seasonal human–brown bear conflicts in northern Iran: S O N G C H I T R U K S A , P. & Z E N G , X. () Getis–Ord spatial statistics to
implications for conservation. Zoology and Ecology, , –. identify hot spots by using incident management data.
M A J I Ć , A., M A R I N O T A U S S I G D E B O D O N I A , A., H U B E R , Đ. & Transportation Research Record: Journal of the Transportation
B U N N E F E L D , N. () Dynamics of public attitudes toward bears Research Board, , –.
and the role of bear hunting in Croatia. Biological Conservation, , S V E Č N J A K , L., H E G I Ć , G., K E Z I Ć , J., T U R Š I Ć , M., D R A Ž I Ć , M.M.,
–. B U B A LO , D. & K E Z I Ć , N. () The state of beekeeping in Croatia.
N O R T H R U P , J.M., S T E N H O U S E , G.B. & B O Y C E , M.S. () Agricultural Central European Journal of Agriculture, , –.
lands as ecological traps for grizzly bears. Animal Conservation, , S W E N S O N , J.E., G E R S T L , N., D A H L E , B. & Z E D R O S S E R , A. ()
–. Action plan for the conservation of the brown bear (Ursus arctos) in
N Y H U S , P., F I S C H E R , H., M A D D E N , F. & O S O F S K Y , S. () Taking the Europe. Nature and Environment Series (Council of Europe,
bite out of wildlife damage. Conservation in Practice, , –. Strasbourg), , –.
N Y H U S , P., O S O F S K Y , S., F E R R A R O , P., F I S C H E R , H. & M A D D E N , F. T R E V E S , A. & K A R A N T H , U.K. () Human–carnivore conflict and
() Bearing the costs of human–wildlife conflict: the challenges perspectives on carnivore management worldwide. Conservation
of compensation schemes. In People and Wildlife: Conflict or Biology, , –.
Coexistence? (eds R. Woodroffe, S. Thirgood & A. Rabinowitz), pp. T R O U W B O R S T , A. () Managing the carnivore comeback:
–. Cambridge University Press, Cambridge, UK. international and EU species protection law and the return of lynx,
O R D , J.K. & G E T I S , A. () Local spatial autocorrelation statistics: wolf and bear to Western Europe. Journal of Environmental Law, ,
distributional issues and an application. Geographical Analysis, , –.
–. W I L S O N , S.M., G R A H A M , J.A., M AT T S O N , D.J. & M A D E L , M.J. ()
P E T R A M , W., K N A U E R , F. & K A C Z E N S K Y , P. () Human influence landscape conditions predisposing grizzly bears to conflict on
on the choice of winter dens by European brown bears in Slovenia. private agricultural lands in the western USA. Biological
Biological Conservation, , –. Conservation, , –.
P O S I L L I C O , M., M E R I G G I , A., P A G N I N , E., L O VA R I , S. & R U S S O , L. Z A R , J.H. () Biostatistical Analysis. Pearson Prentice Hall, Upper
() A habitat model for brown bear conservation and land Saddle River, London, UK.
use planning in the central Apennines. Biological Conservation, , Z E D R O S S E R , A., D A H L E , B., S W E N S O N , J.E. & G E R S T L , N. () Status
–. and management of the brown bear in Europe. Ursus, , –.
R D E V E LO P M E N T C O R E T E A M () R: A Language and Z U U R , A.F., I E N O , E.N. & S M I T H , G.M. () Analysing Ecological
Environment for Statistical Computing. R Foundation for Data. Springer, New York, USA.
Oryx, 2020, 54(4), 511–519 © 2018 Fauna & Flora International doi:10.1017/S0030605318000236
Downloaded from https://www.cambridge.org/core. IP address: 46.4.80.155, on 15 Feb 2021 at 13:38:23, subject to the Cambridge Core terms of use, available at https://www.cambridge.org/core/terms.
https://doi.org/10.1017/S0030605318000236You can also read