Whole genome optical mapping of bone marrow myeloma cells reveals association of extramedullary multiple myeloma with chromosome 1 abnormalities
←
→
Page content transcription
If your browser does not render page correctly, please read the page content below
www.nature.com/scientificreports

                OPEN              Whole‑genome optical mapping
                                  of bone‑marrow myeloma
                                  cells reveals association
                                  of extramedullary multiple
                                  myeloma with chromosome 1
                                  abnormalities
                                  Eva Kriegova1*, Regina Fillerova1, Jiri Minarik2, Jakub Savara1,3, Jirina Manakova1,
                                  Anna Petrackova1, Martin Dihel1, Jana Balcarkova2, Petra Krhovska2, Tomas Pika2,
                                  Petr Gajdos3, Marek Behalek3, Michal Vasinek3 & Tomas Papajik2

                                  Extramedullary disease (EMM) represents a rare, aggressive and mostly resistant phenotype of
                                  multiple myeloma (MM). EMM is frequently associated with high-risk cytogenetics, but their complex
                                  genomic architecture is largely unexplored. We used whole-genome optical mapping (Saphyr,
                                  Bionano Genomics) to analyse the genomic architecture of CD138+ cells isolated from bone-marrow
                                  aspirates from an unselected cohort of newly diagnosed patients with EMM (n = 4) and intramedullary
                                  MM (n = 7). Large intrachromosomal rearrangements (> 5 Mbp) within chromosome 1 were detected
                                  in all EMM samples. These rearrangements, predominantly deletions with/without inversions,
                                  encompassed hundreds of genes and led to changes in the gene copy number on large regions of
                                  chromosome 1. Compared with intramedullary MM, EMM was characterised by more deletions (size
                                  range of 500 bp–50 kbp) and fewer interchromosomal translocations, and two EMM samples had
                                  copy number loss in the 17p13 region. Widespread genomic heterogeneity and novel aberrations
                                  in the high-risk IGH/IGK/IGL, 8q24 and 13q14 regions were detected in individual patients but were
                                  not specific to EMM/MM. Our pilot study revealed an association of chromosome 1 abnormalities in
                                  bone marrow myeloma cells with extramedullary progression. Optical mapping showed the potential
                                  for refining the complex genomic architecture in MM and its phenotypes.

                                  Abbreviations
                                  EMM	Extramedullary multiple myeloma
                                  MM	Multiple myeloma
                                  BM	Bone marrow
                                  HMW DNA	High molecular weight DNA
                                  FISH	Fluorescence in situ hybridization
                                  NGS	Next-generation sequencing
                                  BMMC	Bone marrow mononuclear cell
                                  SV	Structural variant
                                  VAF	Variant allele frequency
                                  CNV	Copy number variation

                                  1
                                   Department of Immunology, Faculty of Medicine and Dentistry, Palacky University Olomouc and University
                                  Hospital Olomouc, Hnevotinska 3, 779 00 Olomouc, Czech Republic. 2Department of Hemato‑Oncology,
                                  Faculty of Medicine and Dentistry, Palacky University Olomouc and University Hospital Olomouc, Olomouc,
                                  Czech Republic. 3Department of Computer Science, Faculty of Electrical Engineering and Computer Science,
                                  VŠB-Technical University of Ostrava, Ostrava, Czech Republic. *email: eva.kriegova@email.cz

Scientific Reports |   (2021) 11:14671              | https://doi.org/10.1038/s41598-021-93835-z                                        1

                                                                                                                                    Vol.:(0123456789)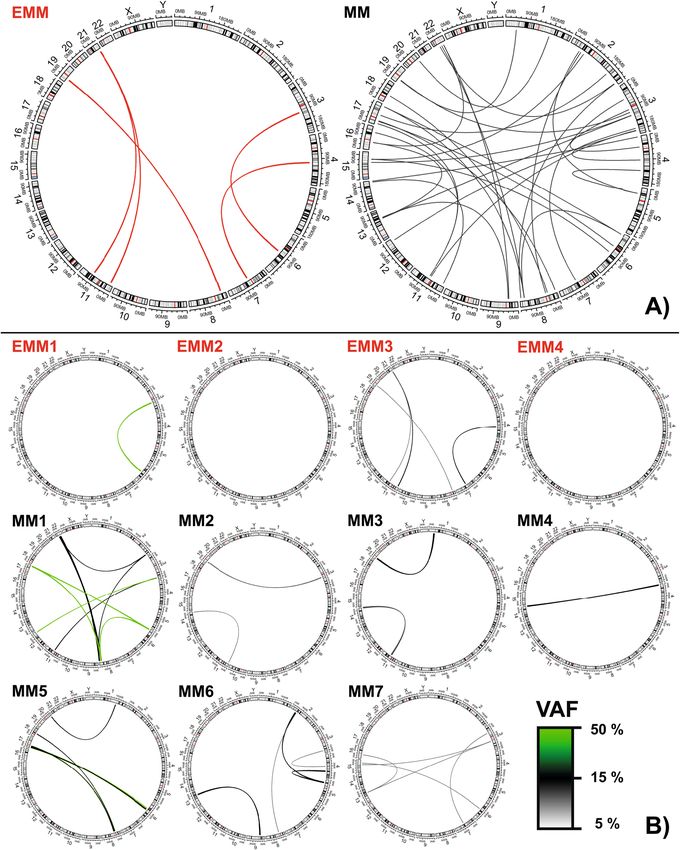
www.nature.com/scientificreports/
FICTION Fluorescence immunophenotyping and interphase cytogenetics as a tool for investigation of
neoplasms
CT Chromosome territory
Multiple myeloma (MM) is a clonal plasma cell proliferative disorder usually limited to a bone marrow (BM)
microenvironment. Rarely, patients present with extramedullary disease (EMM), in which myeloma cells spread
to other organ s ystems1–3. This aggressive and mostly treatment-resistant sub-entity of MM can either accompany
a newly diagnosed disease, occurring at a frequency of 3–18%4,5, or develop with disease progression or relapse,
with a frequency of 6–20%4,6. Currently, little is known about the mechanisms leading to the development of
EMM, stroma-independent growth and the survival of myeloma cells at extramedullary sites or the reasons for
poor treatment responses. There is growing evidence that genetic factors may contribute to EMM pathogenesis
and evolution1,4,5.
Genetic studies have shown that high-risk abnormalities, such as 1q21 gain and del(1p32) (detected in > 55%
of EMM patients), t(4;14) (~ 52%), MYC overexpression (~ 38%), del(17p13) (~ 35%) and del(13q14) (~ 31%),
are commonly associated with E MM1,4,5. The disruption of the TP53 gene by del(17p) and/or mutations seems
to be a crucial driver of EMM (EMM vs MM: 34.5% vs 11.9%)7,8. Mutations in the RAS9, KRAS, PIK3CA, ATM
and NFKB21 genes have also been associated with the presence of EMM, including CRBN mutations leading
to treatment r esistance10. Other important aberrations in EMM include the activating mutations in the NF-κB
pathway genes and the homozygous deletion of the genes encoding inhibitors of this pathway11. The resulting
constitutive activation of NF-κB enhances the expression of adhesion molecules, such as integrin VLA-4, CD-44,
P-selectin and numerous chemokines/receptors6,12, leading to the migration and stroma-independent growth of
myeloma cells11. Additional genetic aberrations may occur in patients with extramedullary mass due to clonal
evolution7,13. However, the complex genetic architecture in MM and EMM is still poorly understood, likely due
to its complexity and heterogeneity.
Therefore, we applied novel whole-genome optical mapping to investigate the complex genomic architecture
of BM myeloma cells in newly diagnosed MM and EMM patients. This method has an advantage in detecting
small and large structural rearrangements as well as complex rearrangements across the whole genome that are
undetectable by traditional methods, such as sequencing and c ytogenetics14. The characterisation of genetic
architecture in EMM could significantly contribute to the understanding of EMM pathogenesis with the potential
to discover new prognostic and diagnostic biomarkers and improve the outcome of this MM entity. Moreover,
a comparison of MM and EMM may help to elucidate genetic events, allowing the dissemination of myeloma
cells from BM to blood and distant tissues.
Materials and methods
Subject enrolment. BM aspirates were obtained from an unselected cohort of 11 newly diagnosed MM
patients with EMM presentation (n = 4; median age: 77 years, min–max: 51–79; M/F: 3/1) and without EMM
(MM, n = 7; 75 years, 62–82; 5/2). Patients were diagnosed according to the International Myeloma Working
Group criteria15. The only criteria for patient enrolment were sampling at diagnosis and a sufficient number of
sorted cells to perform all genetic analyses (≥ 2 million myeloma cells). In our patients, all EMM sites were bone
related, with two in the thoracic spine and two in the pelvis (one in the iliac bone and one in the acetabulum).
Patient’s clinical and demographic data are summarised in Table 1 and Table S1. For all patients, karyotype, FISH
(fluorescence in situ hybridization, Table S2), arrayCGH (Table S3) and next-generation sequencing (NGS) for
mutations in the TP53, KRAS, NRAS and BRAF genes (Table S2) were available.
All patients provided written informed consent about the usage of BM for this study, which was performed
in accordance with the Helsinki Declaration and approved by the ethics committee of the University Hospital
and Palacký University Olomouc.
Collection of BM aspirates. BM aspirates (2.5–10 ml) were collected in a 5 ml RPMI-1640 medium
(Sigma-Aldrich, MO, USA) containing 5000 IU/ml heparin (Zentiva, Prague, Czech Republic). BM mon-
onuclear cells (BMMCs) were collected after red blood cell lysis (155 mM N H4Cl, 10 mM K HCO3, 0.1 mM
Na2EDTA, pH 7.3) by centrifugation (1000g, 5 min). After washing with phosphate-buffered saline containing
0.5 M EDTA (Sigma-Aldrich) and 2% FBS (Thermo Fisher Scientific, MA, USA), the total count of BMMCs and
the infiltration of CD138+ cells were determined by BD FACSCanto II (BD Biosciences, CA, USA). CD138+
plasma cells were enriched using an EasySep Human CD138 positive Selection Kit II (STEMCELL Technologies,
Vancouver, Canada), according to the manufacturer’s instructions. The enriched myeloma cells were quantified
by BD FACSCanto II (BD Biosciences, CA, USA) using a combination of CD19/CD38/CD45/CD56/CD138
antibodies (BioLegend, CA, USA). After centrifugation (2000g, 2 min), dry pellets of 0.6–2.5 million myeloma
cells were stored at − 80 °C for further analysis.
Isolation of high molecular weight DNA, labelling and analysis. Frozen myeloma cell pellets were
processed following the Bionano Prep SP Frozen Cell Pellet DNA Isolation Protocol16. High molecular weight
(HMW) genomic DNA was isolated using the SP Blood and Cell Culture DNA Isolation Kit (Bionano Genom-
ics, CA, USA, #80030), according to the manufacturer’s recommendations. DNA quantification was performed
using the Qubit dsDNA BR assay kit (Thermo Fisher Scientific) with a Qubit 2.0 Fluorometer (Thermo Fisher
Scientific).
A total of 750–1000 ng of HMW DNA was then labelled using the Bionano Prep Direct Label and Stain DLS
DNA Kit (Bionano Genomics, #80005), according to the manufacturer’s p rotocol17. The HMW-labelled DNA
(within the recommended range of 8–25 labels/100 kbp) was loaded into the Saphyr Chip (Bionano Genomics,
Scientific Reports | (2021) 11:14671 | https://doi.org/10.1038/s41598-021-93835-z 2
Vol:.(1234567890)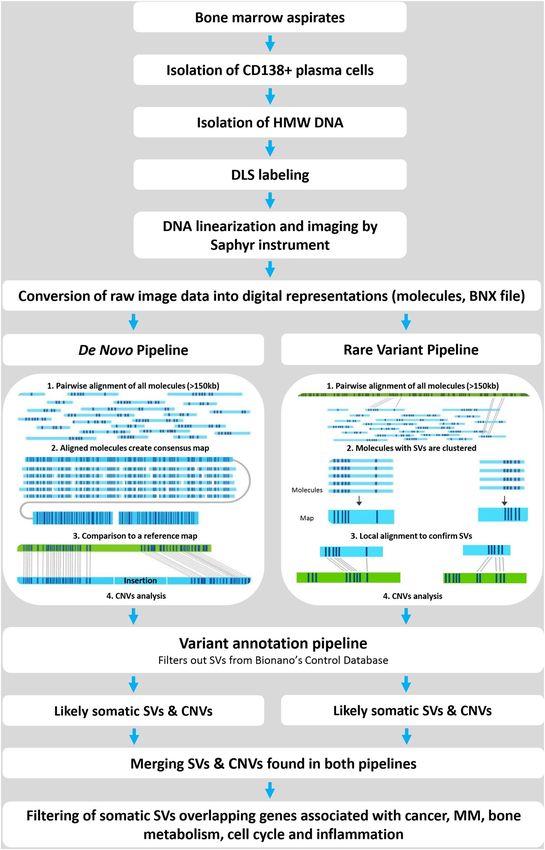
www.nature.com/scientificreports/
Clinical features All patients (n = 11) EMM (n = 4) MM (n = 7)
Male/female 8/3 3/1 5/2
Age (years), median (min–max) 77 (51–82) 77 (51–79) 75 (62–82)
ISS staging, n (%)
ISS I 5 (45.5) 2 (50.0) 3 (42.9)
ISS II 1 (9.1) 0 (0.0) 1 (14.3)
ISS III 5 (45.5) 2 (50.0) 3 (42.9)
Durie-Salmon stage, n (%)
IA 1 (9.1) 0 (0.0) 1 (14.3)
IIA 4 (36.4) 1 (25.0) 3 (42.9)
IIIA 4 (36.4) 2 (50.0) 2 (28.6)
IB 1 (9.1) 0 (0.0) 1 (14.3)
IIIB 1 (9.1) 1 (25.0) 0 (0.0)
LC + FLC, n (%)
IgG kappa 5 (45.5) 3 (75.0) 2 (28.6)
IgA kappa 4 (36.4) 0 (0.0) 4 (57.1)
IgA lambda 2 (18.2) 1 (25.0) 1 (14.3)
Cytogenetic analysisa, n (%)
t(4;14) 1 (9.1) 0 (0.0) 1 (14.3)
t(11;14) 1 (9.1) 0 (0.0) 1 (14.3)
Gain (1q21) 6 (54.5) 2 (50.0) 4 (57.1)
del(13q14) 4 (36.4) 1 (25.0) 3 (42.8)
del(1p32) 1 (9.1) 1 (25.0) 0 (0.0)
del(17p) 0 (0.0) 0 (0.0) 0 (0.0)
Monosomy 5 (45.5) 2 (50.0) 3 (42.8)
Trisomy 9 (81.8) 4 (100.0) 5 (71.4)
Tetrasomy 5 (45.5) 3 (75.0) 2 (28.6)
NGS analysisb, n (%)
TP53 0 (0.0) 0 (0.0) 0 (0.0)
KRAS 2 (18.2) 1 (25.0) 1 (14.3)
NRAS 0 (0.0) 0 (0.0) 0 (0.0)
BRAF 3 (27.3) 1 (25.0) 2 (28.6)
Table 1. Basic demographic and clinical characteristics of enrolled MM and EMM patients. ISS International
Staging System, LC monoclonal protein’s light chain, FLC free light chain. a 10% positive cut-off level used. b The
full coding sequence of the TP53 gene (exons 2–11, plus 5′ and 3′UTR; NM_000546) and the hotspot regions
in NRAS (exons 2–4; NM_002524), KRAS (exons 2–4; NM_004985) and BRAF (exons 11 and 15; NM_004333)
were sequenced.
#20319) flow cell at a concentration of 4–12 ng/μl and analysed using a Bionano Saphyr instrument, according
to the manufacturer’s instructions18, targeting 100–300× human genome coverage by collecting 500–1300 GB
of data per sample.
Data assembly, structural variant calling and the identification of breakpoint regions. All data
were analysed using Bionano Access software (v1.5) containing the Bionano Solve tool (v3.5) and featuring both
de novo and rare variant bioinformatics pipelines (Fig. 1), according to the manufacturer’s recommendations1–21.
Only DNA molecules with a minimum length of 150 kbp were used for bioinformatics analysis along with a
minimum of nine labels per molecule.
Briefly, the de novo pipeline’s first assembly of all single molecules was based on the distinct distribution
of sequence labels by pairwise alignment. The aligned molecules created consensus maps (contigs) in de novo
genome maps, which were compared with the in silico DLE1 labelled human hg38 reference map. This pipe-
line revealed structural variants (SVs) from 500 bp to tens of Mbp long. In the rare-variant pipeline, all single
molecules were pairwise aligned against the hg38 reference assembly; molecules with SVs were clustered, and
the obtained maps were locally aligned to the hg38 reference sequence. This pipeline was sensitive enough to
detect SVs from 5 kbp to tens of Mbp long at a variant allele frequency (VAF) as low as 5%. SVs were considered
subclonal (i.e. low-allele frequency) when VAF was ≤ 25% and clonal (i.e. high-allele frequency) when VAF was
M11. Additionally, both pipelines included copy number
> 25%, based on a cut-off value for neutral evolution in M
variation (CNV) analysis to detect the fractional copy number changes and chromosomal aneuploidy events.
Specific hg38 masks concealing common structural variation in a human genome, N-base reference gaps and
problematic sub-centromeric and sub-telomeric regions were used in both pipelines. To annotate the SV calls
Scientific Reports | (2021) 11:14671 | https://doi.org/10.1038/s41598-021-93835-z 3
Vol.:(0123456789)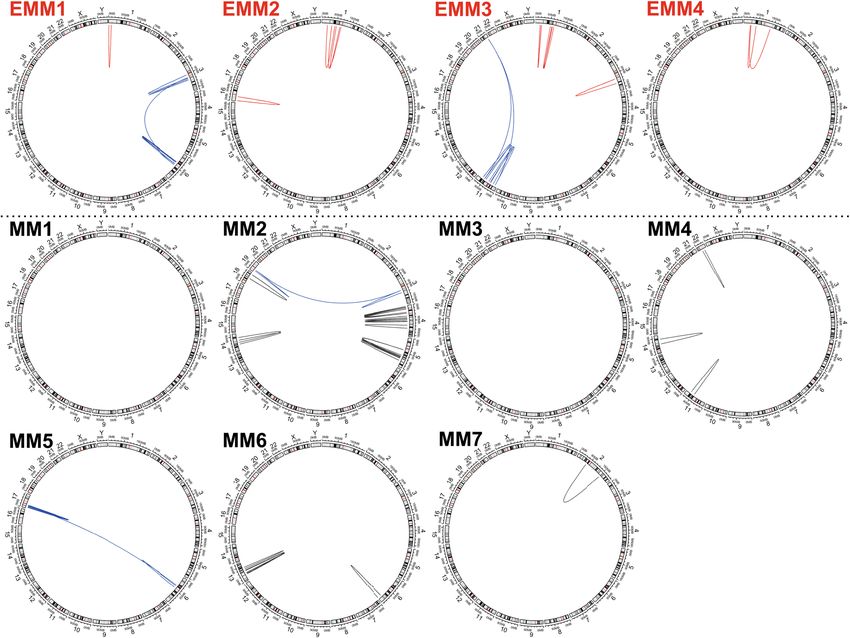
www.nature.com/scientificreports/

                                            Figure 1.  Workflow of optical mapping and bioinformatics pipelines used. HMW DNA is isolated from
                                            CD138+ plasma cells of BM aspirates and labelled by DLS chemistry in specific sequences across entire
                                            genomes. Labelled DNA is loaded on the chip and linearised and visualised in a Saphyr instrument. Images
                                            are converted to BNX molecules. The architecture of the bioinformatics pipeline includes two pipelines (de
                                            novo and rare variant), constructing optical genome maps and comparing them with a human reference map
                                            (hg38), filtering detected variants for somatic SVs and merging data from both pipelines. The last step enables a
                                            comparison of the data with the gene panels created from NCBI gene datasets.

          Scientific Reports |   (2021) 11:14671 |               https://doi.org/10.1038/s41598-021-93835-z                                                     4

Vol:.(1234567890)
www.nature.com/scientificreports/
that were likely somatic variants, a variant annotation pipeline was applied to filter SVs out of the database of
ethnically diverse, mapped control human genomes with no reported disease phenotypes.
In the next step, annotated SVs and CNVs from both pipelines were merged (Fig. 1), including aberrations
sized 500 bp–5 Mbp (deletions, insertions, duplications and inversions) as well as inter- and intrachromosomal
aberrations larger than 5 Mbp. The intrachromosomal rearrangements with breakpoints at least 5 Mbp apart,
e.g. large deletions (supported by copy number loss), insertions (copy number gains) or inversions (no change
in CNVs) were called intrachromosomal translocations by the Bionano software (Fig. S1). Only SVs with VAF
> 5% and a minimum of ten self-molecules were further analysed in this study. Identified candidate SVs were
confirmed by arrayCGH, FISH, breakpoint-specific PCR amplification and/or long-read whole-genome sequenc-
ing (TELL-Seq, Universal Sequencing Technology, CA, USA). For a comparison of optical mapping and long-read
sequencing data, we developed our own tool, which is available at http://olgen.cz/en/resources22.
Finally, the sample-specific SVs were compared with BED masks generated from the NCBI gene database
(https://www.ncbi.nlm.nih.gov/gene) for gene panels associated with cancer (created using the keywords cancer,
tumour suppressor and oncogene; panel of 10,812 genes), MM (696 genes), bone metabolism (osteolysis, cel-
lular calcium signalling, bone metabolism; 1810 genes), cell cycle (cell signalling, cell division, apoptosis, cell
cycle, DNA repair; 9750 genes) and inflammation (inflammation, cell migration, adhesion molecules, cytokine/
receptor, chemokine/receptor; 4741 genes).
NGS mutation assessment. The full coding sequence of the TP53 gene (exons 2–11, plus 5′ and 3′UTR;
NM_000546) and the hotspot regions in NRAS (exons 2–4; NM_002524), KRAS (exons 2–4; NM_004985) and
BRAF (exons 11 and 15; NM_004333) were analysed by targeted, ultra-deep NGS, as reported previously23,24.
Amplicon-based libraries were sequenced as paired ends on MiSeq (2 × 151 bp, Illumina, CA, USA), with a
minimum target read depth of 5000×. The detection limit was set up to 1%, and the variants within 1–3% were
confirmed by replication.
Cytogenetic and molecular cytogenetic analysis. After culturing the heparinised BM aspirates in the
BM medium (Biological Industries, CN, USA) overnight with colcemid (Gibco, Thermo Fisher Scientific), the
samples were processed as reported p reviously25, and at least ten metaphases were karyotyped. A combination of
FISH with immunophenotyping, called fluorescence-immunophenotyping and interphase cytogenetics as a tool
for investigation of neoplasms (FICTION), was used to assess the cytogenetic abnormalities using the following
probes: LSI RB1 (Abbott Molecular, IL, USA), SPEC IGH, SPEC CKS1B/CDKN2C, TP53/c17, CCND1/IGH,
FGFR3/IGH (Zytovision, Bremerhaven, Germany), XL MAF/IGH, CCND3/IGH, MAFB/IGH (MetaSystems,
Altlussheim, Germany) and centromeric probes for chromosomes 7, 9, 11 and 15 (Cytocell, Cambridge, United
Kingdom), as reported previously25. ArrayCGH was performed using SurePrint G3 CGH/CGH + SNP 4 × 180 K
microarray (Agilent Technologies, CA, USA)26.
Ethics declarations. All patients provided written informed consent about the usage of bone marrow sam-
ples for this study, which was performed in accordance with the Helsinki Declaration and approved by the ethics
committee of the University Hospital Olomouc and Palacký University Olomouc.
Consent for publication. This manuscript has been viewed and approved by all authors for publication.
Results
Sample analysis by optical mapping. The infiltration of myeloma cells in BM aspirates based on immu-
nophenotyping was highly variable in enrolled patients (3–36%); more than 10% infiltration of plasma cells was
found in the BM smears of all enrolled patients. The inter-individual variability in the myeloma cell infiltra-
tion may be linked to patchy or site-varied myeloma cell distribution, haemodilution, aspirate pull order, the
aggregation of myeloma cells in aspirated BM, myeloma cell immunophenotypes and time-dependent losses of
surface markers23, as well as disease heterogeneity itself27. The infiltration of myeloma cells in all samples after
enrichment was > 80% (81–96%). Optical mapping was performed in all enriched samples with the following
run parameters: average effective coverage, 154× (min–max: 78–324×); collected data per sample, 699 GB (427–
1710 GB); DNA molecule size (N50), 316 kbp (219–446 kbp); label density 17.3 labels per 100 kbp (14.1–22.6);
and map rate, 74.4% (41.5–93.3%). The quality control parameters for each sample are summarised in Table S4.
Detection of SVs and CNVs in myeloma samples. The median number of SVs per patient was as fol-
lows: deletions, 1700 (min–max: 1583–1755); insertions, 4433 (4268–4550); inversions, 62 (44–75); duplications,
54 (48–79); chromosome translocations, 2 (0–8); and intrachromosomal rearrangements, 6 (0–24) (Table S5).
After filtering only for likely somatic variants, the number of deletions per patient (41, 24–62) dominated over
insertions (18, 10–30), inversions (3, 1–9) and duplications (3, 0–13) (Table S5, Fig. 2A), reaching high inter-
individual variability. All detected chromosome translocations and intrachromosomal rearrangements were
identified as somatic-like in all samples.
The EMM genome contained more deletions than the MM (median number of 45 vs 34, P = 0.05), particularly
small deletions of 500 bp–50 kbp (37 vs 24, P = 0.01) (Fig. 2). The number of inversions and duplications did not
differ between EMM and MM (P > 0.05). The spectrum of SVs and affected genes and chromosomes displayed
high inter-individual variability. In addition to the deletion of the CCSER1 gene on chromosome 4 found in
~ 45% of our patients, the SVs in two patients covered NKAIN2, and two others covered the EYS gene, both
within a commonly affected region, 6q.
Scientific Reports | (2021) 11:14671 | https://doi.org/10.1038/s41598-021-93835-z 5
Vol.:(0123456789)www.nature.com/scientificreports/
Figure 2. (A) Distribution of SVs (deletions, insertions, inversions and duplications) and (B) deletions
subdivided according to their size in EMM (red columns) and MM (grey columns) patients. Each column
represents an individual patient and the column height the number of SVs detected.
Regarding CNVs, losses in copy numbers (CN = 1) (median per patient 13, min–max 5–38), as well as gains
(CN = 3–25) (37, 4–56), were common in all patients. Except for two MM patients, the majority of patients had
a mean of five regions of CN > 3 (range 1–16 per patient) in their genomes. The distribution of CNVs across the
genome was highly variable in enrolled EMM and MM patients.
Optical mapping confirmed 98% of SV and CNV changes detected by diagnostic cytogenetic and arrayCGH
assessments (Tables S2, Tables S3) and revealed numerous novel rearrangements in all enrolled patients.
Interchromosomal translocations in MM and EMM. In three MM patients, optical mapping detected
translocations within IGH/IGK/IGL immunoglobulin loci, t(4;14) and t(11;14) (confirmed by diagnostic FISH),
and one t(8;22)(q24;q11) translocation that was detected by mapping only (this region is not routinely assessed
by FISH). In EMM patients, no translocations within IGH/IGK/IGL immunoglobulin loci were detected.
Additionally, numerous other translocations were detected across all MM patients, frequently affecting chro-
mosomes 2, 3, 6 and 8 (Table S6). All MM patients carried at least two translocations, except for one MM patient
with only t(4;14) (Table S6, Fig. 3). Complex chromosomal rearrangements involving three chromosomes were
detected in four (57%) MM patients but not in any EMM patients (Table S6, Fig. 3). The translocations were
present at clonal and subclonal levels (VAF 5–43%). The affected genes and putative fusion genes are shown in
Table S6.
EMM genomes were associated with fewer translocations than MM; two EMM patients had no transloca-
tions, one EMM patient had one translocation and the only EMM patient that reached complete response after
first-line therapy had four translocations. The translocations were present at clonal and subclonal levels (VAF
5–49%) (Fig. 3).
Intrachromosomal rearrangements in MM and EMM. Large chromosomal rearrangements encom-
passing regions longer than 5 Mbp on chromosome 1 were detected in all EMM genomes but not in any MM
genomes (Fig. 4, Table 2). The large rearrangements, together with the small SVs (predominantly deletions),
affected various regions across chromosome 1, often involving deletions and inversions accompanying the CNV
changes. EMM1 had one large intrachromosomal rearrangement of 14.5 Mbp, encompassing 230 genes in the
1p36 region, and five deletions; EMM2 had three large intrachromosomal rearrangements of 47.5 Mbp, 57.9 Mbp
and 21.5 Mbp, encompassing 1093 genes in the 1p35-p31, 1p32-p12 and 1p22-p13 regions, and an additional six
deletions and one insertion. EMM3 had four rearrangements on chromosome 1 of 7.6 Mbp, 7.5 Mbp, 12.6 Mbp
and 12.8 Mbp, encompassing 794 genes in the 1p35-p34, 1p22-p21 and 1p21-p13 regions, and two deletions.
EMM4 had two large rearrangements of 36.1 Mbp and 12.0 Mbp, encompassing 564 genes in the 1p34-p31 and
1p34-1q23 regions, three deletions and five insertions (Fig. S1). The majority of the affected genes by intrachro-
mosomal rearrangement across chromosome 1 in EMM were associated with cancer (~ 35%), cell cycle (~ 30%)
and inflammation (~ 10%); very few affected genes were associated with MM (~ 10%) (Table S7).
In contrast, no intrachromosomal rearrangements, fewer deletions (2, 0–4) and more insertions and duplica-
tions (4, 0–6) on chromosome 1 were detected in MM compared with EMM. The number of affected genes was
also low (2, 0–40).
Additionally, intrachromosomal rearrangements were distributed across other chromosomes in both MM
and EMM (Table S8, Fig. S2). The typical patterns of intrachromosomal translocation were large deletions with
partial inversion, accompanied by copy number loss. Multiple rearrangements within the same chromosome
Scientific Reports | (2021) 11:14671 | https://doi.org/10.1038/s41598-021-93835-z 6
Vol:.(1234567890)www.nature.com/scientificreports/
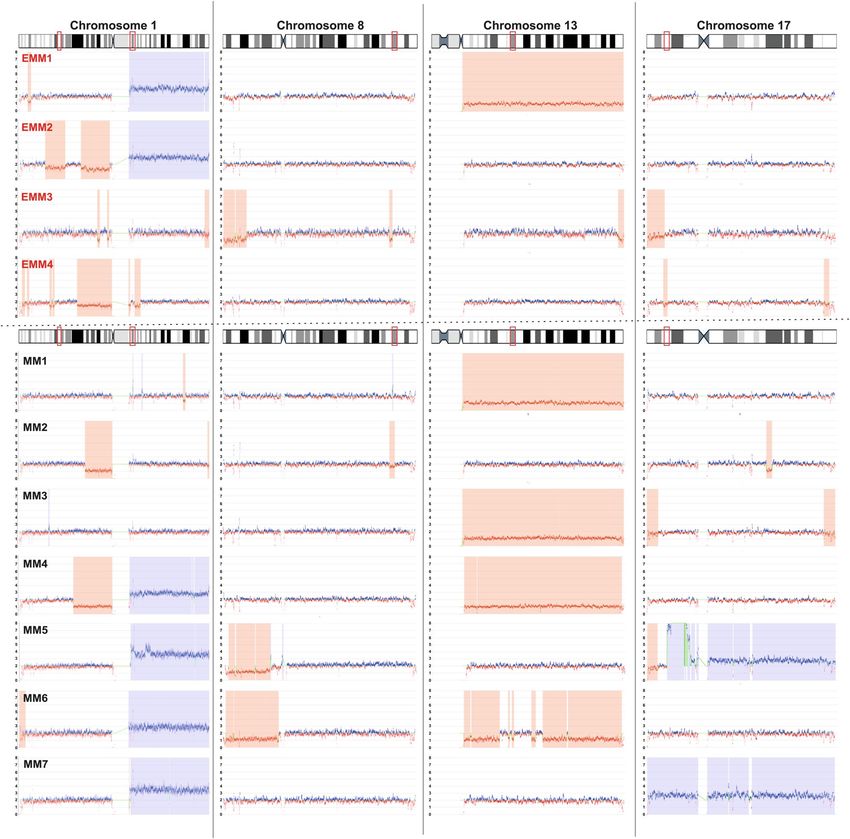
Figure 3. Distribution of chromosome translocations in EMM (red lines) and MM (black lines) patients.
Large circos plots (A) show the sum of translocation in EMM and MM groups; (B) small circos show detected
translocations in a particular patient. The VAF of each translocation is denoted by the thickness and colour of
lots28.
the line (key bottom right). SVs were visualised using circos p
often occurred in some patients. In four patients, these rearrangements were part of the interchromosomal
translocations (highlighted in blue in Fig. 4).
SVs and CNVs in high‑risk loci associated with MM/EMM. In addition, we focused on SVs in high-
risk regions such as IGH/IGK/IGL immunoglobulin loci, del(17p13), del(13q14), the 8q24 region, 1q21 gain and
del(1p32).
Scientific Reports | (2021) 11:14671 | https://doi.org/10.1038/s41598-021-93835-z 7
Vol.:(0123456789)www.nature.com/scientificreports/
Figure 4. Intrachromosomal rearrangements identified in EMM (red lines) and MM (black lines) patients. Blue
lines represent complex rearrangements including translocations.
Regarding the IGH locus, optical mapping revealed t(4;14) and t(11;14) in three MM, which were confirmed
by cytogenetics. In the majority (6/7) of MM samples, but not in any EMM sample, translocations involving
immunoglobulin-associated chromosomes 2, 14 and 22 were detected. Additionally, a 0.4 Mbp inversion was
detected in one EMM patient, and 1.2 Mbp and 0.8 Mbp duplications on chromosome 14 in two MM patients
(Table S9). Also, somatic-like SVs within the IGK and IGL loci were detected: deletions in five patients (three
EMM and two MM), insertions in two (two EMM) and duplication in one (MM) were identified (Table S9,
Fig. S3).
Regarding TP53 disruption, diagnostic analysis by FISH and NGS did not detect any abnormalities in enrolled
patients. Nevertheless, optical mapping revealed copy number loss (CN = 1) in the region overlapping the TP53
gene in two EMM patients (Fig. 5).
Optical mapping confirmed del(13q14) identified by FISH in one EMM and three MM patients. Addition-
ally, optical mapping detected a 1.1 Mbp deletion affecting the RB1 gene, supported by copy number loss in the
13q14.2 region in one MM patient, which was not detected by FISH (Fig. 5).
Regarding the 8q24 locus, one EMM patient carried a deletion and one MM a duplication, detected by both
mapping and cytogenetics. Optical mapping revealed additional changes within this locus associated with MYC
gene amplification in three patients: one MM patient had a 0.6 Mbp insertion and three translocations, t(6;8),
t(8;17) and t(8;22); one MM had an inversion; and one EMM patient had a novel 0.2 Mbp insertion (Table S10).
Regarding high-risk regions on chromosome 1 commonly affected in MM, we confirmed 1q21 gain in six
patients (two EMM and four MM) and del(1p32) in one EMM patient (Table S11). On chromosome 1, 1.4 times
more SVs within/outside the high-risk 1q21/1p32 regions were found in EMM than in MM. In EMM, deletions
(50%) and intrachromosomal rearrangements (31%) were the most frequent, not duplications and translocations.
Discussion
This study characterised genomes of BM myeloma cells in newly diagnosed EMM and MM patients using next-
generation optical mapping. When comparing the EMM and MM genomes, EMM was associated with large
intrachromosomal rearrangements across chromosome 1, fewer interchromosomal translocations and more
deletions across the entire genome compared with MM. For high-risk loci, optical mapping revealed copy number
Scientific Reports | (2021) 11:14671 | https://doi.org/10.1038/s41598-021-93835-z 8
Vol:.(1234567890)www.nature.com/scientificreports/
Chromosome A Chromosome B
Number of affected
ID SV type SV size (kbp) Cytobands Nr RefStart Nr RefEnd VAF (%) genes
Intra-chrom 14,502 1p36.33-p36.13 1 1451742 1 16010418 8 230
Deletion 12.3 1p32.3 1 54437326 1 54468426 13 0
Deletion 0.7 1p31.1 1 73986848 1 73989906 49 0
EMM1
Deletion 0.7 1q21.2 1 149255041 1 149297922 12 0
Deletion 83.9 1q31.1 1 188862967 1 188948998 13 0
Deletion 0.9 1q41 1 219227885 1 219230864 69 0
Intra-chrom 46,876 1p35.1-p31.1 1 33649122 1 80528558 13 475
Deletion 1,611 1p32.3 1 52146402 1 53764220 6 22
Deletion 20.0 1p32.2 1 56859220 1 56897293 5 1
Deletion 311 1p32.2 1 57042204 1 57356850 6 1
Insertion 0.6 1p32.2 1 57981404 1 57987615 27 1
EMM2
Intra-chrom 57,947 1p32.1-p12 1 60494258 1 118466419 9 443
Deletion 14.5 1p31.1 1 70404062 1 70438713 20 1
Deletion 5.5 1p31.1 1 70766057 1 70784216 25 0
Intra-chrom 21,501 1p22.2-p13.3 1 89446367 1 110953619 6 175
Deletion 7.3 1q25.3 1 182529994 1 182549190 61 1
Intra-chrom 7,575 1p35.2-p34.3 1 30221701 1 37801246 15 120
Intra-chrom 7,465 1p35.2-p34.3 1 30860870 1 38353947 8 126
Intra-chrom 12,639 1p22.1-p21.1 1 93051297 1 105699124 9 81
EMM3
Deletion 1.3 1p22.1 1 93329493 1 93335818 10 1
Intra-chrom 12,839 1p21.1-p13.2 1 102272272 1 115119846 21 140
Deletion 5.8 1q42.3 1 235342739 1 235355292 18 1
Deletion 53.1 1p36.33 1 1679533 1 1743791 7 3
Insertion 2.5 1p36.12 1 21983384 1 22006562 13 2
Intra-chrom 36,076 1p34.2-p31.1 1 39891936 1 75973164 7 363
Deletion 3,687 1p34.2-p34.1 1 42633541 1 46350766 8 102
Intra-chrom 119,844 1p34.1-1q23.3 1 44054030 1 163946030 8 1175
EMM4
Insertion 2.5 1p13.2 1 111794239 1 111807945 11 1
Insertion 6.1 1p13.1 1 115530277 1 115543191 14 0
Deletion 0.8 1q31.3 1 195460336 1 195473816 16 0
Insertion 18.6 1q32.2 1 207515921 1 207534396 12 2
Insertion 6.0 1q32.3 1 213171761 1 213205644 12 1
Insertion 5.9 1p36.33 1 1590522 1 1654114 17 7
Insertion 59.9 1q21.2 1 149365317 1 149390055 51 0
Insertion 10.9 1q21.3 1 152289954 1 152296885 13 0
Deletion 231.9 1q25.1 1 175947709 1 176185749 28 2
MM1
Deletion 3176 1q32.3-q41 1 214386812 1 217572960 21 8
Insertion 19.9 1q42.12 1 226337005 1 226338164 32 0
Deletion 315.8 1q43 1 238186340 1 238513554 23 1
Deletion 31.4 1q43 1 239651938 1 239694630 23 1
Insertion 5.4 1p36.12 1 20372589 1 20396493 12 1
Deletion 14.6 1p31.1 1 83171695 1 83186312 19 0
MM2 Duplication 95.5 1q21.2 1 148669395 1 148764931 46 1
Insertion 2.4 1q23.2 1 161184787 1 161193876 13 1
Deletion 4.4 1q25.2 1 179360227 1 179368480 28 1
t(1;19) 1p34.3-19p13.11 1 38291095 19 16838518 15
MM3 t(1;19) 1p34.3-19p13.12 1 39900616 19 15299192 18
Deletion 0.6 1q32.1 1 200212204 1 200225458 24 0
Insertion 14.6 1p36.31 1 5999446 1 6006996 20 0
Insertion 1.8 1p12 1 119153160 1 119157652 27 0
MM4
Duplication 95.5 1q21.2 1 148669395 1 148764931 49 1
Insertion 2.4 1q23.3 1 161184787 1 161193876 28 1
Continued
Scientific Reports | (2021) 11:14671 | https://doi.org/10.1038/s41598-021-93835-z 9
Vol.:(0123456789)www.nature.com/scientificreports/
Chromosome A Chromosome B
Number of affected
ID SV type SV size (kbp) Cytobands Nr RefStart Nr RefEnd VAF (%) genes
Insertion 23.0 1p36.13 1 16040685 1 16054506 9 0
Deletion 1.8 1p34.2 1 39074813 1 39085202 18 1
Deletion 5.4 1p31.3 1 62279900 1 62311886 20 1
Deletion 0.6 1p31.1 1 72996895 1 73015474 24 0
MM5
Duplication 79.6 1q24.2 1 168300624 1 168380191 60 2
Insertion 199.5 1q24.2 1 168300624 1 168380191 34 2
t(1;20) 1q24.3-20q13.2 1 170346977 20 53385582 12
Duplication 57.9 1q42.13 1 227147621 1 227205509 19 1
Insertion 3.2 1p34.3 1 37899628 1 37903954 15 1
MM6
Deletion 14.6 1p31.1 1 83171695 1 83190595 17 0
Insertion 5.7 1p36.33 1 1590522 1 1654114 5 0
Insertion 3.8 1p36.32 1 4070359 1 4096038 5 0
Deletion 23.2 1p36.12 1 21983384 1 22006562 17 2
Insertion 3.4 1p34.1 1 44413885 1 44419138 7 1
Duplication 47.2 1p21.3 1 99166139 1 99213371 7 0
MM7
Insertion 55.4 1p21.3 1 99180335 1 99199495 6 0
Deletion 721.6 1q21.1 1 143310164 1 144170341 25 9
Duplication 633.7 1q22-q23.1 1 156251622 1 156885360 5 28
Deletion 3.0 1q24.1 1 166768561 1 166777221 16 0
Deletion 0.7 1q32.1 1 200212204 1 200225458 15 0
Table 2. SVs on chromosome 1 in enrolled EMM and MM patients. intra-chrom intrachromosomal
rearrangements, VAF variant allele frequency, SVs structural variants.
loss in the 17p13 region in two EMMs, numerous SVs and CNVs in other high-risk 8q24 and 13q14 regions and
IGH/IGK/IGL immunoglobulin loci that were not detected by diagnostic cytogenetic evaluation.
To date, the complex genomic architecture in MM and EMM has been poorly characterised, probably due
to its complexity, heterogeneity and multiple levels of somatic m osaicism29,30. Therefore, we analysed EMM and
MM genomes using innovative optical mapping that can detect small SVs and CNVs as well as complex large
genomic rearrangements or chained fusions14,31–33, which are not recognisable by NGS and/or cytogenetics. The
utility of this approach has been recently shown in leukaemia samples, where optical mapping confirmed the
results of whole-genome sequencing and/or cytogenetic analysis and additionally revealed a large number of SVs
not previously recognisable in analysed s amples14,33. In this study, we used optical mapping for the first time to
study the genome architecture of isolated myeloma cells from BM from newly diagnosed EMM and MM patients.
In line with the high degree of somatic genomic mosaicism and multiple levels of genetic variation in MM29,30,
long-fragment mapping revealed simple and complex genomic rearrangements and CNVs in all samples. More inter-
chromosomal translocations were detected in MM patients than EMM. Except for one patient with a high-risk 14q32
translocation, a common primary event in M M34, all MM patients had at least two other translocations. These often
involved chromosomes 2, 3, 6 and 8, and many of them led to gene disruptions or the creation of putative gene fusions
with at least one partner associated with cancer. Moreover, interchromosomal translocations in MM were often accom-
panied by intrachromosomal rearrangements located in the same chromosomal loci. On the contrary, three EMM
patients had one or zero translocations, and one EMM patient with good treatment response had three translocations;
the translocations occurred in our patients at subclonal and clonal levels (5–49%). Although the impact of clonal status
on the prognostic value of SVs is unclear for most cancers, recent NGS studies in MM have shown that the clonality
status of mutations does not influence survival but does impact the disease p henotype35. Experimental evidence also
suggests that MM progression, both spontaneous in asymptomatic stages and at relapse after treatment, is linked to its
heterogeneous subclonal c omposition36; thus, the direct measures of the clone size and its intrinsic biological features
deserve future investigation. Optical mapping also revealed numerous complex translocations, involving three chro-
mosomes in about half of the MM patients but not in the EMM patients. There are already reports about large chro-
mosomal rearrangements, called chromothripsis, in MM29,30. Such complex structural changes, often accompanied by
eterozygosity37, are difficult to identify by other techniques and may escape attention. The presence of unusual
loss of h
rearrangements of numerous chromosomes in MM, but not EMM, deserves future investigation.
In addition to interchromosomal translocations, we detected numerous intrachromosomal rearrangements,
which are rearrangements that involve loci located on the same chromosome. To date, few cancer types harbour
both interchromosomal and intrachromosomal rearrangements; one of them is M M38. It has been suggested
that the occurrence of intra- or interchromosomal recombinations depends on the spatial proximity between
recombinogenic partners within the chromosome territories (CTs), a non-randomly formed, distinct space where
each chromosome d econdenses39,40. When loci are situated near the surface of their CTs, interchromosomal
translocations occur, and when they are located deep in the CTs, intrachromosomal rearrangements occur41.
There is already evidence that chromosomes involved in commonly occurring translocations – t(4;14), t(14;16)
Scientific Reports | (2021) 11:14671 | https://doi.org/10.1038/s41598-021-93835-z 10
Vol:.(1234567890)www.nature.com/scientificreports/
Figure 5. The genome CNVs on chromosomes 1, 8, 13 and 17 in EMM (upper part) and MM (lower part)
patients. Blue indicates gains and red indicates losses in gene copy numbers. The vertical bars represent detected
copy number aberrations. The red boxes on the ideogram highlight the high-risk regions.
and t(11;14) – in MM are located within overlapping CTs42,43; however, the mechanisms of intrachromosomal
rearrangements have not been investigated in MM.
Importantly, we detected EMM-specific intrachromosomal rearrangements encompassing several Mbp-long
regions within chromosome 1, commonly including combinations of deletions and inversions and affecting
hundreds of genes. These rearrangements were located across the whole of chromosome 1 and led to changes
in the copy number of genes on large regions of this chromosome. The intrachromosomal rearrangements on
chromosome 1 have already been reported in progressive, multi-drug refractory EMM10 and EMM with soft
tissue involvement at the time of MM diagnosis44. Interestingly, 80% (8/10) of patients with soft tissue EMM had
chromosome 1 abnormalities, and an association between chromosome 1 abnormalities and soft tissue EMM
was suggested44. Furthermore, 1p deletion and/or 1q gain were associated with the extramedullary plasmablastic
transformation of MM in both BM and matched extramedullary tissue45. Other studies reported an association
of chromosome 1 abnormalities in MM with the relapsed d isease46. The affected patients have an exceedingly
poor prognosis, short progression-free survival and overall survival, even in the era of novel t herapies44,47,48. A
recent study showed that the adverse impact of chromosome 1 abnormalities on survival is of similar magnitude
to other high-risk chromosomal a bnormalities47. The crucial role of chromosome 1 in MM pathogenesis is also
Scientific Reports | (2021) 11:14671 | https://doi.org/10.1038/s41598-021-93835-z 11
Vol.:(0123456789)www.nature.com/scientificreports/
supported by the significant overrepresentation of genes derived from chromosome 1 in the high-risk signature
in MM48. The occurrence of fewer interchromosomal translocations and more intrachromosomal rearrangements
in EMM, particularly on chromosome 1, suggests that recombinations within loci deep in CTs may play a cru-
cial role in MM pathogenesis, particularly influencing the phenotype of the disease. Furthermore, the observed
chromosome 1 abnormalities may play a role on the required events that allow the dissemination of myeloma
cells from BM to blood and distant tissues; this also deserves future investigation.
In addition to translocations and intrachromosomal rearrangements, we also detected tens of SVs in every
EMM and MM genome. The most common were deletions distributed across all chromosomes. In particular,
deletions ranging in size from 500 bp to 50 kbp occurred more frequently in EMM than in MM. An increased
number of deletions in MM has already been associated with MM progression, as shown by comparing MM
genomes at diagnosis and r elapse49. Future studies should investigate the relationship of a higher deletion load
in EMM compared with MM as well as prognosis. We also detected numerous novel SVs and CNVs within high-
risk loci associated with MM not previously detected by sequencing and cytogenetics.
The most critical genetic factors that portend a poor prognosis for MM are translocations within the IGH/
IGK/IGL loci50. Our study confirmed the common translocations t(4;14) and t(11;14) in three MM patients and
revealed additional interchromosomal translocations involving chromosomes 2, 14 and 22, where immunoglobu-
lin genes are located, in a majority (6/7) of MM patients. The functional consequences of the translocations out-
side the IGH/IGK/IGL loci needs to be clarified, as they may influence antibody expression and function and the
mediation of disease phenotypes. Interestingly, we did not detect any translocation on the previously mentioned
chromosomes in EMM, where deletions and inversions were predominantly found. Differences between MM and
EMM in genetic rearrangements on immunoglobulin-associated chromosomes should be further investigated.
Next, we were interested in the disruption of the 17p13 locus overlapping the TP53 gene, a driver aberration
associated with EMM51,52, poor prognosis and low treatment response rates in MM patients53. The loss of TP53
and other genetic aberrations may additionally occur in the extramedullary mass due to regional clonal evolution,
as shown by comparing extramedullary tumours with their BM myeloma c ells7,13. Although no TP53 disruption
was detected in myeloma cells from BM aspirates of enrolled patients by diagnostic cytogenetic and mutational
analyses, optical mapping revealed copy number loss in the 17p13 region in two EMM patients. Our data further
support the key role of TP53 in EMM and emphasise the need to routinely incorporate SVs and CNVs, the major
forms of genetic alterations in cancer, at many length scales to understand the MM genome more comprehensively.
Optical mapping also confirmed rearrangements at the MYC/8q24 locus, a late tumour progression event
associated with an increased expression of MYC and poor prognosis54, in about a third of patients. One MM
patient had three translocations within this region, and two others had SVs within the MYC/8q24 locus. Whether
the changes at the MYC/8q24 locus were EMM specific, as reported by others55, needs further investigation
using larger cohorts.
This study has several limitations. First, we did not investigate extramedullary tumour mass because invasive
biopsy was not feasible in enrolled patients. Second, due to the moderate number of patients included in this
exploratory study, a sub-analysis based on clinical and laboratory parameters was not performed. Third, the
proportion of the IgA subtype was higher in the MM cohort. However, there is growing evidence that adverse
prognosis in patients with IgA MM versus non-IgA MM subtypes is more likely to be caused by the misclassifica-
tion of disease response or the delayed detection of disease due to an underestimation of tumour burden56 than
changes in expression profile or cytogenetics57–59. Future studies on larger patient cohorts enabling a subanalysis
of patients with particular clinical characteristics and stages of disease and the investigation of extramedullary
tissue sites are warranted.
There is a growing body of evidence on the utility of optical mapping for comprehensive SV detection in hae-
matology and solid t umours14,31–33. The aberrations detected by mapping have been confirmed by c ytogenetics14
or NGS33,60, particularly by long-read sequencing61,62, as also shown in our study. Optical mapping thus provides
an ideal complement to sequencing for resolving complex genomic architecture in c ancers31.
Conclusion
Our pilot study using next-generation optical mapping revealed that in addition to known high-risk cytogenetic
factors, chromosome 1 abnormalities in BM myeloma cells are associated with extramedullary progression. The
detection of numerous novel, distinct genetic aberrations associated with EMM and MM shows the potential of
optical mapping for the refinement of complex genomic architecture in MM and its phenotypes. The methodol-
ogy and results described here represent a significant advance that may accelerate the introduction of genomics
at long-length scales into clinical decisions for MM.
Data availability
The data of this study are available from the corresponding author on reasonable request.
Received: 1 February 2021; Accepted: 24 June 2021
References
1. Bhutani, M., Foureau, D. M., Atrash, S., Voorhees, P. M. & Usmani, S. Z. Extramedullary multiple myeloma. Leukemia 34, 1–20
(2020).
2. Paquin, A. R. et al. Overall survival of transplant eligible patients with newly diagnosed multiple myeloma: Comparative effective-
ness analysis of modern induction regimens on outcome. Blood Cancer J. 8, 125 (2018).
3. Usmani, S. Z. et al. Extramedullary disease portends poor prognosis in multiple myeloma and is over-represented in high-risk
disease even in the era of novel agents. Haematologica 97, 1761–1767 (2012).
Scientific Reports | (2021) 11:14671 | https://doi.org/10.1038/s41598-021-93835-z 12
Vol:.(1234567890)www.nature.com/scientificreports/
4. Qu, X. et al. Extramedullary manifestation in multiple myeloma bears high incidence of poor cytogenetic aberration and novel
agents resistance. Biomed. Res. Int. 2015, 787809 (2015).
5. Jagosky, M. H. & Usmani, S. Z. Extramedullary disease in multiple myeloma. Curr. Hematol. Malig. Rep. 15, 62–71 (2020).
6. Bladé, J. et al. Soft-tissue plasmacytomas in multiple myeloma: Incidence, mechanisms of extramedullary spread, and treatment
approach. J. Clin. Oncol. 29, 3805–3812 (2011).
7. Billecke, L. et al. Cytogenetics of extramedullary manifestations in multiple myeloma. Br. J. Haematol. 161, 87–94 (2013).
8. Varga, C. et al. Development of extramedullary myeloma in the era of novel agents: No evidence of increased risk with lenalido-
mide-bortezomib combinations. Br. J. Haematol. 169, 843–850 (2015).
9. de Haart, S. J. et al. Comparison of intramedullary myeloma and corresponding extramedullary soft tissue plasmacytomas using
genetic mutational panel analyses. Blood Cancer J. 6, e426 (2016).
10. Egan, J. B. et al. Extramedullary myeloma whole genome sequencing reveals novel mutations in Cereblon, proteasome subunit G2
and the glucocorticoid receptor in multi drug resistant disease. Br. J. Haematol. 161, 748–751 (2013).
11. Furukawa, Y. & Kikuchi, J. Molecular basis of clonal evolution in multiple myeloma. Int. J. Hematol. 111, 496–511 (2020).
12. Dahl, I. M. S., Rasmussen, T., Kauric, G. & Husebekk, A. Differential expression of CD56 and CD44 in the evolution of extramed-
ullary myeloma. Br. J. Haematol. 116, 273–277 (2002).
13. Rasche, L. et al. Spatial genomic heterogeneity in multiple myeloma revealed by multi-region sequencing. Nat. Commun. 8, 268
(2017).
14. Neveling, K. et al. Next generation cytogenetics: comprehensive assessment of 48 leukemia genomes by genome imaging. bioRxiv.
https://doi.org/10.1101/2020.02.06.935742 (2020).
15. Rajkumar, S. V. et al. International Myeloma Working Group updated criteria for the diagnosis of multiple myeloma. Lancet Oncol.
15, e538–e548 (2014).
16. Bionano Genomics. Bionano prep SP fresh cells dna isolation protocol (revision D). Document Number: 30257. https://biona
nogenomics.com/wp-content/uploads/2019/04/30257-Bionano-Prep-SP-Fresh-Cells-DNA-Isolation-Protocol.pdf (2020).
17. Bionano Genomics. Bionano prep Direct Label and Stain (DLS) Protocol (revision F). Document Number: 30206. https://biona
nogenomics.com/wp-content/uploads/2018/04/30206-Bionano-Prep-Direct-Label-and-Stain-DLS-Protocol.pdf (2019).
18. Bionano Genomics. Saphyr system user guide (revision C). Document Number: 30143. https://bionanogenomics.com/wp-conte
nt/uploads/2017/10/30143-Saphyr-System-User-Guide.pdf (2018).
19. Bionano Genomics. Introduction to copy number analysis (revision D). Document Number: 30210. https://bionanogenomics.
com/wp-content/uploads/2018/04/30210-Introduction-to-Copy-Number-Analysis.pdf (2019).
20. Bionano Genomics. Bionano solve theory of operation: structural variant calling (revision J). Document Number: 30110. https://
bionanogenomics.com/wp-content/uploads/2018/04/30110-Bionano-Solve-Theory-of-Operation-Structural-Variant-Calling.pdf
(2020).
21. Bionano Genomics. Bionano solve theory of operation: variant annotation pipeline (revision H). Document Number: 30190. https://
bionanogenomics.com/wp-content/uploads/2018/04/30190-Bionano-Solve-Theory-of-Operation-Variant-Annotation-Pipeline.
pdf (2020).
22. Savara, J., Novosád, T., Gajdoš, P. & Kriegova, E. Comparison of structural variants detected by optical mapping with long-read
next-generation sequencing. Bioinformatics. https://doi.org/10.1093/bioinformatics/btab359 (2021).
23. Petrackova, A. et al. Diagnostic deep-targeted next-generation sequencing assessment of TP53 gene mutations in multiple myeloma
from the whole bone marrow. Br. J. Haematol. 189, e122–e125 (2020).
24. Obr, A. et al. TP53 mutation and complex karyotype portends a dismal prognosis in patients with mantle cell lymphoma. Clin.
Lymphoma Myeloma Leuk. 18, 762–768 (2018).
25. Mlynarcikova, M. et al. Molecular cytogenetic analysis of chromosome 8 aberrations in patients with multiple myeloma examined
in 2 different stages, at diagnosis and at progression/relapse. Clin. Lymphoma Myeloma Leuk. 16, 358–365 (2016).
26. Kruzova, L. et al. Complex karyotype as a predictor of high-risk chronic lymphocytic leukemia: A single center experience over
12 years. Leuk. Res. 85, 106218 (2019).
27. Lee, N. et al. Discrepancies between the percentage of plasma cells in bone marrow aspiration and BM biopsy: Impact on the
revised IMWG diagnostic criteria of multiple myeloma. Blood Cancer J. 7, e530 (2017).
28. Gu, Z., Gu, L., Eils, R., Schlesner, M. & Brors, B. Circlize implements and enhances circular visualization in R. Bioinformatics 30,
2811–2812 (2014).
29. Ye, C. J., Chen, J., Liu, G. & Heng, H. H. Somatic genomic mosaicism in multiple myeloma. Front. Genet. 11, 388 (2020).
30. Lohr, J. G. et al. Widespread genetic heterogeneity in multiple myeloma: Implications for targeted therapy. Cancer Cell 25, 91–101
(2014).
31. Chan, E. K. F. et al. Optical mapping reveals a higher level of genomic architecture of chained fusions in cancer. Genome Res. 28,
726–738 (2018).
32. Mantere, T. et al. Next generation cytogenetics: Genome-imaging enables comprehensive structural variant detection for 100
constitutional chromosomal aberrations in 85 samples. bioRxiv. https://doi.org/10.1101/2020.07.15.205245 (2020).
33. Xu, J. et al. An integrated framework for genome analysis reveals numerous previously unrecognizable structural variants in
leukemia patients’ samples. bioRxiv. https://doi.org/10.1101/563270 (2019).
34. Walker, B. A. et al. Characterization of IGH locus breakpoints in multiple myeloma indicates a subset of translocations appear to
occur in pregerminal center B cells. Blood 121, 3413–3419 (2013).
35. Bolli, N. et al. Analysis of the genomic landscape of multiple myeloma highlights novel prognostic markers and disease subgroups.
Leukemia 32, 2604–2616 (2018).
36. Bolli, N. et al. Next-generation sequencing for clinical management of multiple myeloma: Ready for prime time?. Front. Oncol.
10, 189 (2020).
37. Berry, N. K., Bain, N. L., Enjeti, A. K. & Rowlings, P. Genomic profiling of plasma cell disorders in a clinical setting: Integration
of microar-ray and FISH, after CD138 selection of bone marrow. J. Clin. Pathol. 67, 66–69 (2014).
38. Walker, B. A. Whole exome sequencing in multiple myeloma to identify somatic single nucleotide variants and key translocations
involving immunoglobulin loci and MYC. Methods Mol. Biol. 1792, 71–95 (2018).
39. Schardin, M., Cremer, T., Hager, H. D. & Lang, M. Specific staining of human chromosomes in Chinese hamster × man hybrid cell
lines demonstrates interphase chromosome territories. Hum. Genet. 71, 281–287 (1985).
40. Parada, L. & Misteli, T. Chromosome positioning in the interphase nucleus. Trends Cell Biol. 12, 425–432 (2002).
41. Gandhi, M. S., Stringer, J. R., Nikiforova, M. N., Medvedovic, M. & Nikiforov, Y. E. Gene position within chromosome territories
correlates with their involvement in distinct rearrangement types in thyroid cancer cells. Genes Chromosom. Cancer. 48, 222–228
(2009).
42. Sathitruangsak, C. et al. Distinct and shared three-dimensional chromosome organization patterns in lymphocytes, monoclonal
gammopathy of undetermined significance and multiple myeloma. Int. J. Cancer. 140, 400–410 (2017).
43. Martin, L. D., Harizanova, J., Mai, S., Belch, A. R. & Pilarski, L. M. FGFR3 preferentially colocalizes with IGH in the interphase
nucleus of multiple myeloma patient B-cells when FGFR3 is located outside of CT4. Genes Chromosom. Cancer. 55, 962–974 (2016).
44. Neparidze, N. & Brown, J. E. Clinical outcomes of extramedullary multiple myeloma in the era of novel agents. Blood 130, 5438
(2017).
Scientific Reports | (2021) 11:14671 | https://doi.org/10.1038/s41598-021-93835-z 13
Vol.:(0123456789)www.nature.com/scientificreports/
45. Liu, Y. et al. Genetic basis of extramedullary plasmablastic transformation of multiple myeloma. Am. J. Surg. Pathol. 44, 838–848
(2020).
46. Marzin, Y. et al. Chromosome 1 abnormalities in multiple myeloma. Anticancer Res. 26, 953–959 (2006).
47. Giri, S. et al. Chromosome 1 abnormalities and survival of patients with multiple myeloma in the era of novel agents. Blood Adv.
4, 2245–2253 (2020).
48. Shaughnessy, J. D. Jr. et al. A validated gene expression model of high-risk multiple myeloma is defined by deregulated expression
of genes mapping to chromosome 1. Blood 109, 2276–2284 (2007).
49. Gupta, A. et al. Single-molecule analysis reveals widespread structural variation in multiple myeloma. Proc. Natl. Acad. Sci. USA
112, 7689–7694 (2015).
50. Barwick, B. G. et al. Multiple myeloma immunoglobulin lambda translocations portend poor prognosis. Nat. Commun. 10, 1911
(2019).
51. Deng, S. et al. Features of extramedullary disease of multiple myeloma: high frequency of p53 deletion and poor survival: A ret-
rospective single-center study of 834 cases. Clin. Lymphoma Myeloma Leuk. 15, 286–291 (2015).
52. Katodritou, E. et al. Extramedullary (EMP) relapse in unusual locations in multiple myeloma: Is there an association with precedent
thalidomide administration and a correlation of special biological features with treatment and outcome?. Leuk. Res. 33, 1137–1140
(2009).
53. Dimopoulos, M. A. et al. Treatment of patients with relapsed/refractory multiple myeloma with lenalidomide and dexamethasone
with or without bortezomib: Prospective evaluation of the impact of cytogenetic abnormalities and of previous therapies. Leukemia
24, 1769–1778 (2010).
54. Misund, K. et al. MYC dysregulation in the progression of multiple myeloma. Leukemia 34, 322–326 (2020).
55. Szabo, A. G. et al. Overexpression of c-myc is associated with adverse clinical features and worse overall survival in multiple
myeloma. Leuk. Lymphoma. 57, 2526–2534 (2016).
56. Visram, A. et al. Disease monitoring with quantitative serum IgA levels provides a more reliable response assessment in multiple
myeloma patients. Leukemia 35, 1428–1437 (2021).
57. Fonseca, R. et al. Clinical and biologic implications of recurrent genomic aberrations in myeloma. Blood 101, 4569–4575 (2003).
58. Muddasani, R. et al. Association between immunoglobulin isotypes and cytogenetic risk groups in multiple myeloma. Blood 132,
5585 (2018).
59. Nair, B. et al. Immunoglobulin isotypes in multiple myeloma: Laboratory correlates and prognostic implications in total therapy
protocols. Br. J. Haematol. 145, 134–137 (2009).
60. Jaratlerdsiri, W. et al. Next generation mapping reveals novel large genomic rearrangements in prostate cancer. Oncotarget 8,
23588–23602 (2017).
61. Deschamps, S. et al. A chromosome-scale assembly of the sorghum genome using nanopore sequencing and optical mapping. Nat.
Commun. 9, 4844 (2018).
62. Weissensteiner, M. H. et al. Combination of short-read, long-read, and optical mapping assemblies reveals large-scale tandem
repeat arrays with population genetic implications. Genome Res. 27, 697–708 (2017).
Acknowledgements
We would like to thank Petra Sindelarova for administrative assistance.
Author contributions
E.K., T.Pa. conceived the study, E.K., R.F. planned the experiments, interpreted the data, wrote the manuscript.
R.F., J.Ma., M.D., A.P. performed the laboratory analysis. J.B. performed the cytogenetic analysis, A.P. performed
NGS analysis, J.Mi., P.K., T.Pi., T.Pa. collected the patient samples and clinical data, J.S., P.G., M.B., M.V. per-
formed the bioinformatics analysis. J.Mi., T.Pa., A.P. revised the manuscript. All authors read the final version
of manuscript.
Funding
The study was supported by research Grant Celgene (CZE_102), Internal Grant Agency of Palacky Univer-
sity (IGA_LF_2021_015), Ministry of Health of Czech Republic—RVO (FNOL, 00098892), and in part by
NV18-03-00500.
Competing interests
The authors declare no competing interests.
Additional information
Supplementary Information The online version contains supplementary material available at https://doi.org/
10.1038/s41598-021-93835-z.
Correspondence and requests for materials should be addressed to E.K.
Reprints and permissions information is available at www.nature.com/reprints.
Publisher’s note Springer Nature remains neutral with regard to jurisdictional claims in published maps and
institutional affiliations.
Open Access This article is licensed under a Creative Commons Attribution 4.0 International
License, which permits use, sharing, adaptation, distribution and reproduction in any medium or
format, as long as you give appropriate credit to the original author(s) and the source, provide a link to the
Creative Commons licence, and indicate if changes were made. The images or other third party material in this
article are included in the article’s Creative Commons licence, unless indicated otherwise in a credit line to the
material. If material is not included in the article’s Creative Commons licence and your intended use is not
permitted by statutory regulation or exceeds the permitted use, you will need to obtain permission directly from
the copyright holder. To view a copy of this licence, visit http://creativecommons.org/licenses/by/4.0/.
© The Author(s) 2021
Scientific Reports | (2021) 11:14671 | https://doi.org/10.1038/s41598-021-93835-z 14
Vol:.(1234567890)You can also read