White matter tract specific alterations in patients with primary restless legs syndrome
←
→
Page content transcription
If your browser does not render page correctly, please read the page content below
www.nature.com/scientificreports
OPEN White matter tract‑specific
alterations in patients with primary
restless legs syndrome
Hea Ree Park1,7, Hye Ryun Kim2,7, Seunghwan Oh3, Joon‑Kyung Seong3,4,6* &
Eun Yeon Joo5*
Prior diffusion tensor imaging (DTI) studies have investigated white matter (WM) changes in
patients with primary restless legs syndrome (RLS), but the results were inconsistent. Here, we
proposed using tract-specific statistical analysis (TSSA) to find alterations in specific WM tracts to
clarify the pathophysiological mechanisms of RLS. We enrolled 30 patients with RLS and 31 age-
and sex- matched controls who underwent brain magnetic resonance imaging, neuropsychological
tests, and polysomnography. Fractional anisotropy (FA) maps obtained from whole-brain diffusion
tensor imaging and TSSA were used to localize WM changes in patients with RLS. Subsequently, a
comparison of FA values for each tract between patients and controls was performed. The associations
between FA values and clinical, polysomnographic, and neuropsychological parameters in RLS
patients were assessed. RLS patients demonstrated decreased FA values in the left corticospinal
tract (CST) and cingulum, and in the right anterior thalamic radiation (ATR) and inferior fronto-
occipital fasciculus (IFO). Patients’ attention/executive function and visual memory scores positively
correlated with FA values in the right ATR, and anxiety levels negatively correlated with FA values in
the right IFO. Additionally, the number of periodic leg movements and movement arousal index were
negatively correlated with FA values in the left CST. The TSSA method identified previously unknown
tract-specific alterations in patients with RLS and significant associations with distinct clinical
manifestations of RLS.
Primary restless legs syndrome (RLS) is a sensorimotor disorder characterized by unpleasant sensations and
an irresistible urge to move the legs, predominantly when resting or in the evening1. This condition commonly
causes delayed sleep onset and sleep fragmentation; thus, patients with severe RLS suffer from chronic sleep loss,
sometimes leading to adverse consequences in the daytime. Several studies to date have reported association
between RLS and anxiety, depression, and impaired c ognition2–5.
In the past few years, novel MRI modalities such as diffusion tensor imaging (DTI) and functional MRI
(fMRI) have been used to identify structural or functional changes in the central nervous system of RLS patients
that are undetectable by conventional MRI6–15. Among the known techniques, DTI is a noninvasive MRI method
that estimates the microstructural integrity of white matter (WM) by measuring random movements of water
within brain t issue16. Several DTI studies have assessed WM changes in patients with RLS, but the extent and
features of WM abnormalities were inconsistent. Some DTI studies have observed disruptions to WM integrity
close to the somatosensory cortex or prefrontal cortices, corpus callosum, internal capsule, basal ganglia, brain
stem, spinal cord, and cerebellum6,8–10,12, while others did not find any differences in the WM of RLS patients
compared with that of normal controls7,11.
Previous DTI studies of RLS have used the voxel-wise approach6,8,10,12 and tract-based spatial statistics (TBSS)
method7,9,17. The voxel-wise approach can not specify anatomically which WM tracts are impaired, which is
essential for identifying possible disruptions in connectivity between two specific brain regions. Moreover, it
1
Department of Neurology, Inje University College of Medicine, Ilsan Paik Hospital, Goyang, Korea. 2Global Health
Technology Research Center, College of Health Science, Korea University, Seoul, Korea. 3Department of Artifical
Intelligence, Korea University, Seoul, Korea. 4School of Biomedical Engineering, Korea University, 145, Anam‑ro,
Anam‑dong 5‑ga, Seongbuk‑gu, Seoul 02841, Republic of Korea. 5Department of Neurology, Neuroscience Center,
Samsung Medical Center, Sungkyunkwan University School of Medicine, 81 Irwon‑ro, Gangnam‑gu, Seoul 06351,
Republic of Korea. 6Interdisciplinary Program in PrecisionPublic Health, Korea University, Seoul, Republic of
Korea. 7These authors contributed equally: Hea Ree Park and Hye Ryun Kim. *email: jkseong@korea.ac.kr; ejoo@
skku.edu
Scientific Reports | (2021) 11:16116 | https://doi.org/10.1038/s41598-021-95238-6 1
Vol.:(0123456789)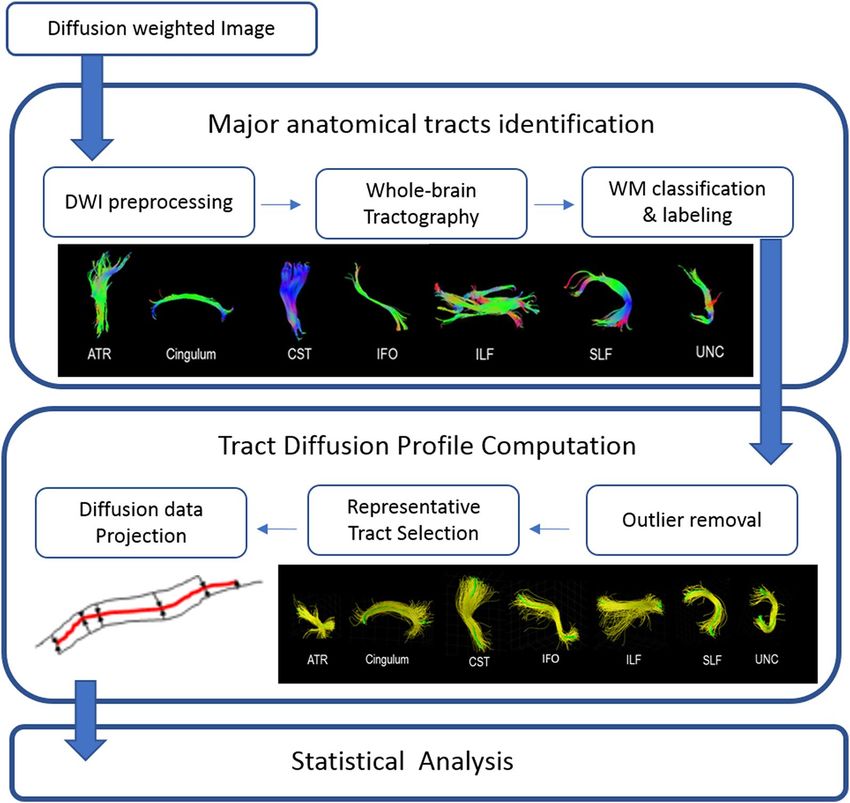
www.nature.com/scientificreports/
can be compromised by aligning multiple subjects into a standard space template such that interpretation of the
result can be a mbiguous18. The tract-based spatial statistics (TBSS) method, a widely used DTI technique, can
facilitate investigations of local microstructural alterations through nonlinear registration followed by projection
of diffusion parameters onto a WM skeleton19. However, this projection onto a group mean skeleton adopted
in TBSS might mix differently oriented, multiple adjacent fibers given that TBSS discards fiber orientation20.
Tract-specific statistical analysis (TSSA), a method that our group developed and validated21, improves the
mapping of tract diffusion coefficients along the corresponding major anatomical tracts. This system uses the
results of subject-specific tractography and a tract classification method that acquires the fiber directions in
subject-specific tractography maps.
In the present study, we investigated tract-specific abnormalities in patients with RLS using the TSSA method
to clarify the pathophysiological mechanisms of RLS. We then assessed whether such abnormalities were associ-
ated with various clinical presentations of the disease.
Methods
Participants. Thirty-four subjects older than 18 years of age who were diagnosed with primary RLS and
34 age- and sex- matched, healthy controls were enrolled in this study. The diagnosis of RLS was established by
neurologists after an interview and physical examination in the sleep clinic based on updated international RLS
study group diagnostic criteria1. We excluded subjects who had secondary RLS caused by anemia, pregnancy,
gastrectomy, chronic kidney disease, or peripheral neuropathy. The severity of RLS symptoms was assessed using
the International Restless Legs Scale (IRLS). Patient age at onset of RLS symptoms and duration of disease were
recorded.
RLS patients and controls were excluded if they exhibited any of the following: (1) known sleep disorders other
than RLS such as sleep disordered breathing, circadian sleep disorders, and parasomnia; (2) heart or respira-
tory disease; (3) history of cerebrovascular disease; (4) other neurological or psychiatric diseases; (5) alcohol or
illicit drug abuse or current use of psychoactive medications; or (6) a structural lesion on brain MRI. All control
subjects and 18 RLS patients who complained of frequent arousal during sleep or nonrestorative sleep underwent
overnight polysomnography (PSG) to exclude other sleep disorders. Three RLS patients were excluded because
PSG tests revealed undiagnosed obstructive sleep apnea (OSA), and two control subjects were excluded due to
periodic leg movements (PLM index > 24). Finally, 31 RLS patients and 32 controls underwent neuropsychologi-
cal tests and brain MRI. In this study, all of the participants were right-handed.
The Institutional Review Board of Samsung Medical Center approved the study protocol (IRB No. 2020-04-
045-001) and informed consent was obtained from all subjects. This manuscript does not contain information
or image that can lead to identification of a study participant. Study methods were carried out in accordance
with approved guidelines.
Neuropsychological assessments. Participants underwent a battery of neuropsychological tests in the
following six broad domains: attention and executive function (digit span test, Corsi block tapping tests, trail-
making tests A and B, and the Stroop test)22–25, verbal fluency (controlled oral word association test)26, verbal
memory (Korean version of the California verbal learning test)27,28, visual memory (Rey complex figure test)29,
and visuospatial function (Rey complex figure copy and Raven’s colored progressive matrices tests)30. Composite
scores and detailed information regarding these tests were described in a previous p aper31. To examine emo-
tional state, the Beck Depression Inventory (BDI) and Beck Anxiety Inventory (BAI) tests were a dministered32.
Brain MRI acquisition. T1 and diffusion-weighted images were acquired from all 31 patients and 32 healthy
controls using the same 3.0 Tesla MRI scanner (Philips 3.0 T Achieva). T1-weighted images were obtained using
the following scanning variables: 0.5 mm sagittal slice thickness, over contiguous slices with 50% overlap, no gap,
a repetition time (TR) of 9.9 ms, an echo time (TE) of 4.6 ms, a flip angle of 8° and a matrix size of 240 × 240 pix-
els. Images were reconstructed to 480 × 480 over a 240 mm field of view. In the whole-brain diffusion-weighted
MRI examination, sets of axial diffusion-weighted single-shot echo-planar images were collected with the fol-
lowing parameters: 128 × 128 acquisition matrix, 1.72 × 1.72 × 2 mm3 voxels, 70 axial slices, a 220 × 220 mm2 field
of view, a TE of 60 ms, a TR of 7385 ms, a flip angle of 90°, a slice gap of 0 mm, and a b-factor of 600 s mm−2. For
baseline images without diffusion weighting (the reference volume), diffusion-weighted images were acquired
from 45 different directions. All axial sections were acquired parallel to the anterior commissure-posterior com-
missure line. The method of brain MRI acquisition was identical with our group’s previous DTI s tudies33,34.
Tract‑specific statistical analysis (DTI processing). TSSA consists of three steps of DTI preprocessing:
(1) identifying the major anatomic tracts along the tractography derived fiber bundles after DTI preprocessing,
(2) calculating a Tract Diffusion Profile, and (3) conducting statistical analysis. The detailed explanation of the
TSSA method process was previously described21,33,34 and Fig. 1 presents an overview of the TSSA method.
First, diffusion-weighted images were preprocessed including skull stripping and eddy -current correction
using the FMRIB software Library(FSL)35. Motion correction was performed by the affine alignment of the DWI
volumes to the b0 image volume since b0 image is a reference volume for motion correction and it is not affected
by eddy current d istortions36. We applied deterministic tractography with DTI reconstruction using the Diffu-
sion toolkit37. Deterministic tractography was processed based on Fiber Assignment by Continuous Tracking
(FACT)38. Through this process, Fractional anisotropy (FA) values and whole-brain streamlines were obtained.
Then, whole-brain streamlines were automatically classified and labeled into seven major tracts according to
their shape and position, which was executed by our in-house software39. This method exploits expert-provided
example data from multiple subjects. Example data contains multiple atlases from different subjects to consider
Scientific Reports | (2021) 11:16116 | https://doi.org/10.1038/s41598-021-95238-6 2
Vol:.(1234567890)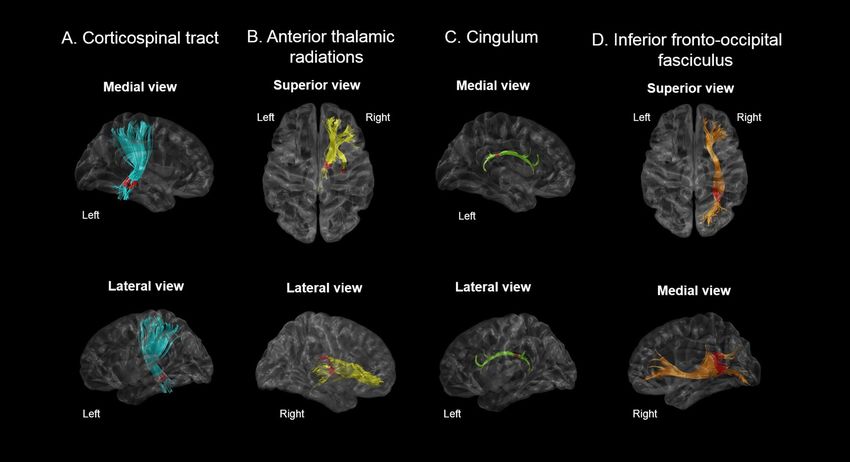
www.nature.com/scientificreports/
Figure 1. An overview of the white matter tract-based approach of the tract-specific statistical analysis (TSSA).
DWI, diffusion weighted image; WM, white matter; ATR, anterior thalamic radiation; CST, corticospinal
tract; IFO, inferior fronto-occipital fasciculus; ILF, inferior-longitudinal fasciculus; SLF, superior-longitudinal
fasciculus; UNC, uncinate fasciculus.
the individual variability. Each atlas was constructed by automatically grouping whole-brain streamlines accord-
ing to their shape similarity and manually labeling as seven anatomic bundles by experts. Multiple atlases are
placed in the reference space. Given whole-brain streamlines of a test subject, they were transformed to the
reference space of example through the registration between T1-weighted images. Then, the streamlines were
clustered as tract group in the same way of constructing example data. Each tract group was automatically labeled
by measuring the similarity with seven anatomical bundles in each atlas. The final label of each tract group was
determined by voting with multiple example subjects. This method improved the accuracy of labeling relative to
the region of interest (ROI)-based m ethod39. The seven major tracts used were the anterior thalamic radiation
(ATR), cingulum (CG), corticospinal tract (CST), inferior fronto-occipital fasciculus (IFO), inferior longitudinal
fasciculus (ILF), superior longitudinal fasciculus (SLF), and uncinate fasciculus (UNC).
Next, we selected a representative streamline for each major tract for each subject following removal of
streamline outliers. The outliers are streamlines which aren’t located in the regions specified by anatomical bundle
definitions. Since a representative streamline should be long enough and located in the middle of the tract, a
fiber density map was computed21. A fiber density map maintains the number of streamlines that pass through
corresponding voxel in each voxel. The streamline with maximum density sum was chosen as a representative
streamline.
Then, “Tract Diffusion Profile”40 was constructed by projecting FA values of all streamlines onto each repre-
sentative tract. Since other streamlines didn’t have the same length and location with the representative stream-
line, point correspondence between a representative streamline and other streamlines was computed by the
optimal point matching method19 that is robust to spatial distortion and FA value variability for curved fibers.
The projected FA values for each major tract were averaged with the Mahalanobis distance as a weighting factor.
For statistical analysis, a group-wise representative tract was further selected across subjects in the same way
except with the constraint of accommodating more than 60% of subjects. The group-wise representative tract was
resampled into 100 sample points using spline interpolation. As a final step, statistical analyses of FA values and
clinical data such as patient-specific measures were performed. We considered FA the most suitable measurement
Scientific Reports | (2021) 11:16116 | https://doi.org/10.1038/s41598-021-95238-6 3
Vol.:(0123456789)www.nature.com/scientificreports/
Patients (n = 30) Controls (n = 31) p
Age 46.3 ± 13.0 44.1 ± 12.0 0.482
Men:women, no 8:22 8:23 0.939
Age at RLS onset (years) 36.9 ± 14.1 –
RLS duration (years) 9.4 ± 8.5 –
IRLS score 29.9 ± 7.6 –
Previous RLS medication use, n (%) 13 (43.3) –
Night polysomnography (n = 15)
Time in bed (min) 446.0 ± 46.7 450.4 ± 43.2 0.767
Total sleep time (min) 389.4 ± 45.8 404.4 ± 43.3 0.305
Sleep latency (min) 12.5 ± 16.3 10.8 ± 10.9 0.676
Sleep efficiency (%) 87.4 ± 5.6 89.9 ± 5.8 0.180
Arousal index (h) 17.6 ± 6.5 13.8 ± 5.3 0.044*
WASO (min) 44.1 ± 22.5 35.1 ± 24.4 0.237
N1 sleep (%) 12.4 ± 6.3 11.9 ± 5.2 0.793
N2 sleep (%) 59.9 ± 11.4 56.8 ± 8.5 0.327
N3 sleep (%) 7.7 ± 5.1 8.5 ± 7.3 0.699
REM sleep (%) 20.1 ± 6.9 22.7 ± 4.2 0.189
AHI/h 4.0 ± 3.0 2.3 ± 3.0 0.084
PLMI (h) 16.2 ± 20.9 4.0 ± 5.8 0.005*
MAI (h) 3.6 ± 4.3 1.0 ± 1.6 0.005*
Table1. Demographics and sleep characteristics of patients with RLS and controls. RLS, restless legs
syndrome; IRLS, International Restless Legs Scale; WASO, wakefulness after sleep onset; REM, rapid eye
movement; AHI, apnea–hypopnea index; PLMI, periodic leg movement index; MAI, movement arousal index.
*p < 0.05, independent t-tests for continuous variables and Fischer’s exact tests for categorical variables.
to find WM alterations in RLS because RLS is a chronic neurological disorder related to disrupted sensorimotor
neuronal transmission. To evaluate differences in FA values along each tract between RLS patients and controls,
a permutation-based analysis of covariance, together with controlling for age and body mass index, was applied
with 10,000 permutations. Since FA values in the tract profile were sampled at equidistant locations along
the group-wise representative tract, a cluster-based statistics (CBS) method was used for multiple comparison
correction41,42, which is often used in the neuroimaging field. F-value for the original set and the permutated set
were computed by ANCOVA, which forms a null distribution of group difference. The CBS method corrects p
with respect to number of sample points significantly clustered against another group. The number of sample
points that have larger F-values than the given threshold was computed at first, which is cluster size. Then, the
maximal size of clusters for each permutation which forms a null distribution of cluster size was calculated. The
corrected p was estimated by the fraction of occurrences whose maximal size of clusters were not less than the
cluster size of the original set. The threshold was 2.5.
To estimate the associations between FA values and clinical, polysomnographic, and neuropsychological
parameters in the RLS group, permutation-based tests for correlation were performed before CBS. First, partial
correlation coefficients were calculated for FA values along the representative tract, with the measures on clinical,
polysomnographic, cognitive test, controlling age and sex as covariates. Like group comparison, the significance
level of the correlation coefficient was adjusted by permutation testing with CBS that assumed a null distribution
of maximum cluster extent43. The statistical analyses were conducted using MATLAB (Mathworks, Natick, MA,
USA). CBS code is available at http://brein.korea.ac.kr/software/.
Results
Clinical characteristics. Finally, 30 patients and 31 controls were included in this analysis; one patient and
one control group participant were excluded due to poor image quality. The demographics for all study partici-
pants are summarized in Table 1; participants were predominantly middle-aged and female. In RLS patients,
the mean onset age for leg discomfort was 36.9 ± 14.1 years and the disease duration was 9.4 ± 8.5 years. Patients
suffered from moderate to severe RLS-related symptoms (IRLS 29.9 ± 7.6). Thirteen (43.3%) RLS patients were
taking dopamine agonists with or without alpha-2 delta ligands, and the duration of medical treatment was
2.6 ± 3.1 years. When comparing PSG tests, RLS patients (n = 15) demonstrated higher arousal index (17.6 ± 6.5
vs. 13.8 ± 5.3/h, p = 0.044), PLM index (16.2 ± 20.9 vs. 4.0 ± 5.8/h, p = 0.005), and movement arousal index (MAI
3.6 ± 4.3 vs. 1.0 ± 1.6/h, p = 0.005) relative to controls.
Neuropsychological tests. RLS patients had lower scores for both forward and backward Corsi block-
tapping (p = 0.005 and p = 0.028, respectively) compared with controls. The composite score for attention and
executive functions was lower among RLS patients (p = 0.019). In addition, RLS patients had greater degrees of
depression and anxiety than controls (p = 0.001 and p = 0.001, respectively). The results of the neuropsychologi-
cal tests are summarized in Table 2.
Scientific Reports | (2021) 11:16116 | https://doi.org/10.1038/s41598-021-95238-6 4
Vol:.(1234567890)www.nature.com/scientificreports/
Patients (n = 30) Controls (n = 31) p
Attention and executive function composite score − 0.17 ± 0.66 0.23 ± 0.63 0.019*
Digit span, forward 8.5 ± 1.8 9.2 ± 1.9 0.147
Digit span, backward 7.1 ± 1.7 7.7 ± 1.6 0.152
Corsi block, forward 7.6 ± 1.5 8.8 ± 1.7 0.005*
Corsi block, backward 7.2 ± 1.4 8.1 ± 1.5 0.028*
Train making test B, time to completion 85.7 ± 39 75.6 ± 30.3 0.281
Stroop tests, correct responses 104.2 ± 12.1 105.0 ± 11.1 0.786
Verbal fluency composite score − 0.11 ± 0.82 0.13 ± 0.92 0.295
COWAT, phonemic 33.2 ± 10.8 39.0 ± 12.1 0.058
COWAT, semantic 40.7 ± 9.3 40.7 ± 10.8 0.990
Verbal memory composite score − 0.13 ± 0.77 0.13 ± 0.95 0.264
CVLT, total 53.4 ± 7.0 57.9 ± 9.8 0.060
CVLT, short 11.3 ± 2.6 12.1 ± 2.8 0.267
CVLT, long 12.2 ± 2.1 12.9 ± 2.4 0.271
CVLT, recognition 15.0 ± 1.2 15.0 ± 1.3 0.835
Visual memory composite score 0.09 ± 0.73 − 0.06 ± 0.96 0.885
RCFT, immediate 22.0 ± 5.3 21.9 ± 6.5 0.974
RCFT, delayed 21.4 ± 5.2 21.4 ± 6.2 0.964
RCFT, recognition 20.6 ± 1.8 20.3 ± 2.5 0.715
Visuospatial function composite score 0.04 ± 0.91 − 0.06 ± 0.97 0.948
RCFT, copy 34.7 ± 1.5 34.6 ± 1.7 0.774
RCPM 32.3 4.4 33.0 ± 2.8 0.530
Beck Depression Inventory 13.3 ± 7.9 6.3 ± 6.6 0.001*
Beck Anxiety Inventory 8.0 ± 5.4 3.5 ± 4.0 0.001*
Table 2. Neuropsychological test scores for patients with RLS and normal controls. RLS, restless legs
syndrome; COWAT, controlled oral word association test; CVLT, California verbal learning test; RCFT, Rey
complex figure test; RCPM, Raven’s colored progressive matrices test. *p < 0.05; independent t-tests.
Comparison of TSSA results between patients with RLS and the control group. RLS patients
had significantly lower FA values in the inferior part of the left CST (p = 0.018), the left CG close to the posterior
cingulate cortex (p = 0.010), the posterior part of the right ATR (p = 0.013), and the posterior portions of the right
IFO (p = 0.008) compared with controls. A detailed description of FA values according to the noted percentage
of fiber length and portion of the fiber tract with significant FA differences is shown in Fig. 2 and Supplementary
Figure 1.
Association between TSSA values and clinical, cognitive, and polysomnographic parame‑
ters. For the relationships between tract-specific FA values and neuropsychological test results, FA values
in the posterior part of the right ATR were positively correlated with composite scores for attention/executive
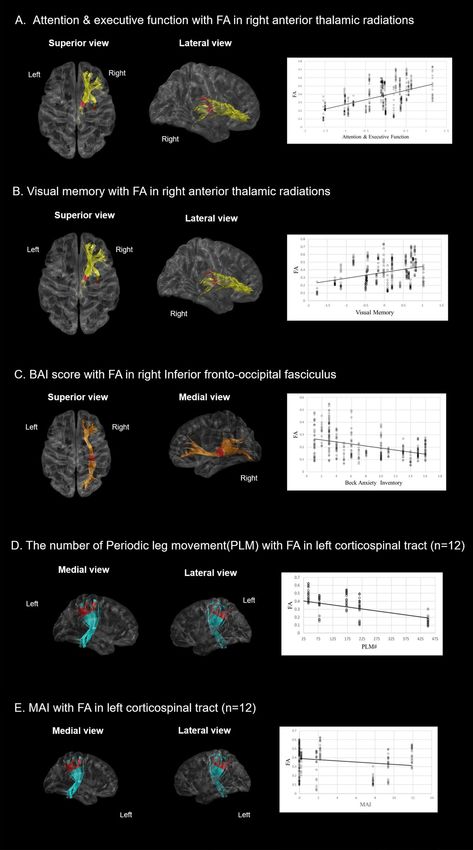
function (p = 0.028, Fig. 3A) and visual memory (p = 0.042, Fig. 3B). FA values in the posterior part of the right
IFO were negatively correlated with BAI (p = 0.038, Fig. 3C). Patients with PLMs during sleep as seen during
PSG (n = 12) had negative correlations between FA values in the subcortical part of the left CST and number of
PLMs (p = 0.044, Fig. 3D) and MAI (p = 0.045, Fig. 3E).
Discussion
In this cross-sectional, case–control study, the TSSA method revealed that patients with RLS had altered FA
values in multiple major WM tracts, correlated with neuropsychological and polysomnographic parameters.
More specifically, patients with RLS had significantly decreased FA values in the left CST, ATR, and CG and in
the right IFO, suggesting disrupted WM integrity in these tracts. Furthermore, the FA values in the left CST
and right IFO in RLS were correlated with PLMs and anxiety, respectively, and FA values in the right ATR were
associated with attention/executive function and visual memory of RLS patients.
Several DTI studies of RLS reported alterations of motor and somatosensory systems, but the details of the
results have been different among studies. Some studies reported decreased FA values in variable supratentorial
WM tracts including WM close to the motor and somatosensory cortices, CG, putamen, genu of the corpus
callosum, and internal capsule6,8,12. Two studies reported involvement of infratentorial structures such as brain
stem, cerebellum, and upper cervical cords in RLS p atients9,10. In contrast, studies by R
izzo7 and Z
huo11 did not
demonstrate any alteration in WM in RLS patients7,11. The discrepancies between results might be explained by
differences in post-processing methodologies between studies and the technical limitations of these previous
methods. These studies used voxel-based approaches6,8–10,12 or the TBSS m ethod7,11, which resulted in mixed
values for multiple fiber tracts with different orientations. Differences in sample size, magnetic field strength,
and rate of possible comorbid sleep disorders also might have contributed to the discrepancies between results.
Scientific Reports | (2021) 11:16116 | https://doi.org/10.1038/s41598-021-95238-6 5
Vol.:(0123456789)www.nature.com/scientificreports/
Figure 2. TSSA results revealed different FA values between RLS patients and control groups for (A) the left
corticospinal tract, (B) the right anterior thalamic radiations (C) the left cingulum, and (D) the right inferior
fronto-occipital fasciculus. Red colors indicate the portions of fiber tracts where FA values significantly reduced
in RLS group compared to controls (p < 0.05). TSSA, tract-specific statistical analysis; FA, fractional anisotropy.
Furthermore, most previous studies excluded patients with other sleep disorders based solely on patient inter-
views without verifying the validity of their reports by PSG. Undiagnosed comorbid sleep disorders such as OSA
might have influenced the DTI results in these studies.
This study has merits compared with previous studies. The most obvious strength of the study is its adoption
of a tract-specific approach, TSSA, to identify local deficits more precisely in anatomical WM tracts. This TSSA
method enabled us to identify local disruptions in specific fiber tracts using the orientation of all fiber tracts
unlike VBM and TBSS. TBSS captures regional microstructural alterations based on an FA skeleton in a voxel-
based coordinate map. Previous studies, which concentrated on ‘exact location’ of DTI abnormalities in RLS
patients, did not specify which white matter tracts are impaired6–12. The present research focused on ‘specific
tract’ rather than ‘specific location’ because we thought that specification of involved WM tracts would be more
meaningful than specific location to clarify functional abnormalities. In fact, similar to TSSA, tract profile based
methods such as Automated Fiber Quantification from Vistasoft can also consider local disruptions in specific
fiber tract40. However, TSSA method employs a multiple atlases-based WM tract-classification method without
using predefined ROIs/atlases to mask streamlines and optimal point matching method19 for the correspond-
ence between representative streamline and streamlines in order to utilize the full tract length. Using multiple
atlases from different subjects enables us to reflect larger individual variability of bundle shapes and trajectories
than single atlas-based m ethods44,45. Therefore, it is not limited by intersubject variability that may enable more
accurate localization of WM changes by individual. This process demonstrated its clinical utility as it identified
tract-specific abnormalities in patients with cognitive impairment and in those with other sleep disorders such as
narcolepsy and O SA21,33,34. Another strength of this study is that participants who suffered from frequent arousal
or nonrestorative sleep underwent PSG for exclusion of undiagnosed comorbid sleep disorders, to minimize
confounding variables. 3.0 T MRI scans also increased the reliability of results reported in this study.
The CST is a major neural tract known to convey sensorimotor information46. We found that FA values in the
brain stem part of the left CST were lower in RLS patients than in controls. These results are in line with previous
VBM studies that demonstrated decreased GM and WM volumes in the primary sensorimotor c ortex47,48 and
with DTI studies that reported alteration of WM integrity near the motor and sensory cortices and the IC portion
of the fronto-pontine t ract6,8,12. As sensorimotor symptoms are the main manifestations of RLS, it is tempting to
assume that FA reduction in the CST might provoke abnormal neuronal transmission of sensorimotor output.
The FA values in the CST were significantly correlated with PLMs, a common motor symptom of RLS, which
supports this postulation.
This study also suggested that disruptions in specific tracts were associated with cognitive impairments and
psychiatric problems in patients with RLS. We observed decreased FA values in the right ATR and IFO and the left
CG of RLS patients with mood instability and impaired attention/executive function. The FA values in the right
ATR were negatively correlated with attention/executive function and visual memory, which means decreased FA
values in the right ATR were associated with impaired cognitive function of these domains. Impaired prefrontal
Scientific Reports | (2021) 11:16116 | https://doi.org/10.1038/s41598-021-95238-6 6
Vol:.(1234567890)www.nature.com/scientificreports/
Figure 3. Correlation analysis with adjustments for age and gender between FA values and neuropsychological/
PSG indices in the RLS group. (A,B) FA values in the right anterior thalamic radiation were significantly
associated with the composite score of attention/executive function, and visual memory. (C) FA values in
the right inferior fronto-occipital fasciculus were negatively correlated with BAI. (D,E) FA values in the left
corticospinal tract were negatively correlated with number of PLMs and MAI. Red colors indicate the portions
of fiber tracts where FA values significantly correlated with neuropsychological/PSG indices. FA, fractional
anisotropy; PSG, polysomnography; RLS, restless legs syndrome, BAI, Beck anxiety inventory; PLM, periodic
leg movement; MAI, movement arousal index.
Scientific Reports | (2021) 11:16116 | https://doi.org/10.1038/s41598-021-95238-6 7
Vol.:(0123456789)www.nature.com/scientificreports/
function is the most well-known cognitive manifestation in RLS patients. Although there was no significant dif-
ference in memory function between RLS patients and controls in this study, such memory dysfunction has been
reported in previous s tudies49,50. Moreover, microstructural alterations in the CG are associated with frontal lobe
dysfunctions in multiple neuropsychological diseases such as mild cognitive impairment and s chizophrenia51,52.
Concerning psychiatric aspects, decreased FA values in the right IFO were associated with anxiety in RLS
patients. The IFO is the longest associated bundle, and the IFO deep layer is suggested to be associated with
numerous neuropsychiatric f unctions27,53. Therefore, it can be surmised that altered integrity in these tracts plays
a role in the impaired cognitive performance and psychiatric comorbidities seen in RLS patients.
This study’s limitations should be addressed. First, a history of dopaminergic medications or other medica-
tions for RLS that could affect WM integrity were not considered as covariates in our statistical analyses. Second,
the timing of MRI was not consistent among participants, which could be a confounding factor as the abnormal
sensations reported in RLS patients commonly occur or worsen in the evening. However, the effects of medica-
tion and the diurnal variation in symptoms of RLS with respect to DTI would be far less than those seen in other
dynamic imaging modalities such as fMRI and perfusion MRI. Third, seven major tracts were investigated in this
study because of the restriction of example data in tract segmentation method. The other WM tracts could be
considered in the future study with other tract segmentation method54–56. In addition, we focus on FA values since
the meaning of abnormalities in other measures has not been fully understood in patients with RLS. Other metric
such as MD, RD or tractometry combining multiple measures could be investigated in the future s tudy57–59. Lastly,
the study’s relatively small sample size may limit its statistical power. Instead, we minimized confounding factors
by excluding subjects whose comorbid sleep disorders were undiagnosed using PSG screening.
To our knowledge, this is the first DTI study to adopt the TSSA method to explore tract-specific abnormali-
ties in patients with RLS. This novel technique enabled us to identify alterations in specific WM tracts in RLS
patients, in contrast with findings reported in previous DTI studies that focused on brain region abnormalities
related to RLS. Patients with RLS demonstrated impaired WM integrity in the left CST and CG, and in the right
ATR and IFO, which was associated with cognitive performance, anxiety, and PLMs. This study contributes to
a deeper understanding of RLS manifestations due to the altered integrity apparent in WM tracts. This study
provides new insights into the pathophysiological mechanisms of primary RLS.
Data availability
The datasets generated during and/or analyzed during the current study are available from the corresponding
author on reasonable request.
Received: 2 November 2020; Accepted: 22 June 2021
References
1. Allen, R. P. et al. Restless legs syndrome/Willis-Ekbom disease diagnostic criteria: updated International Restless Legs Syndrome
Study Group (IRLSSG) consensus criteria–history, rationale, description, and significance. Sleep Med. 15, 860–873. https://doi.
org/10.1016/j.sleep.2014.03.025 (2014).
2. Pearson, V. E. et al. Cognitive deficits associated with restless legs syndrome (RLS). Sleep Med. 7, 25–30. https://doi.org/10.1016/j.
sleep.2005.05.006 (2006).
3. Cha, K. S., Choi, J. W., Jung, K. Y. & Kim, K. H. Frontal dysfunction in patients with restless legs syndrome performing a visual
oddball task: an event-related potential source imaging study. Sleep Med. 36, 48–54. https://doi.org/10.1016/j.sleep.2017.04.017
(2017).
4. Fulda, S., Beitinger, M. E., Reppermund, S., Winkelmann, J. & Wetter, T. C. Short-term attention and verbal fluency is decreased
in restless legs syndrome patients. Mov. Disord. 25, 2641–2648. https://doi.org/10.1002/mds.23353 (2010).
5. Sevim, S. et al. Correlation of anxiety and depression symptoms in patients with restless legs syndrome: a population based survey.
J. Neurol. Neurosurg. Psychiatry 75, 226–230 (2004).
6. Unrath, A., Muller, H. P., Ludolph, A. C., Riecker, A. & Kassubek, J. Cerebral white matter alterations in idiopathic restless legs
syndrome, as measured by diffusion tensor imaging. Mov. Disord. 23, 1250–1255. https://doi.org/10.1002/mds.22074 (2008).
7. Rizzo, G. et al. Combined brain voxel-based morphometry and diffusion tensor imaging study in idiopathic restless legs syndrome
patients. Eur. J. Neurol. 19, 1045–1049. https://doi.org/10.1111/j.1468-1331.2011.03604.x (2012).
8. Chang, Y. et al. Altered white matter integrity in primary restless legs syndrome patients: diffusion tensor imaging study. Neurol.
Res. 36, 769–774. https://doi.org/10.1179/1743132814y.0000000336 (2014).
9. Belke, M. et al. DTI and VBM reveal white matter changes without associated gray matter changes in patients with idiopathic
restless legs syndrome. Brain Behav. 5, e00327. https://doi.org/10.1002/brb3.327 (2015).
10. Lindemann, K., Muller, H. P., Ludolph, A. C., Hornyak, M. & Kassubek, J. Microstructure of the midbrain and cervical spinal
cord in idiopathic restless legs syndrome: a diffusion tensor imaging study. Sleep 39, 423–428. https://doi.org/10.5665/sleep.5456
(2016).
11. Zhuo, Y. et al. Combined resting state functional magnetic resonance imaging and diffusion tensor imaging study in patients with
idiopathic restless legs syndrome. Sleep Med. 38, 96–103. https://doi.org/10.1016/j.sleep.2017.06.033 (2017).
12. Stefani, A. et al. Multimodal magnetic resonance imaging reveals alterations of sensorimotor circuits in restless legs syndrome.
Sleep https://doi.org/10.1093/sleep/zsz171 (2019).
13. Ku, J. et al. Functional connectivity alternation of the thalamus in restless legs syndrome patients during the asymptomatic period:
a resting-state connectivity study using functional magnetic resonance imaging. Sleep Med. 15, 289–294. https://d oi.o
rg/1 0.1 016/j.
sleep.2013.09.030 (2014).
14. Gorges, M. et al. Patterns of increased intrinsic functional connectivity in patients with restless legs syndrome are associated with
attentional control of sensory inputs. Neurosci. Lett. 617, 264–269. https://doi.org/10.1016/j.neulet.2016.02.043 (2016).
15. Ku, J. et al. Default mode network disturbances in restless legs syndrome/Willis-Ekbom disease. Sleep Med. 23, 6–11. https://doi.
org/10.1016/j.sleep.2016.05.007 (2016).
16. Moseley, M. E., Wendland, M. F. & Kucharczyk, J. Magnetic resonance imaging of diffusion and perfusion. Top. Magn. Reson.
Imaging TMRI 3, 50–67 (1991).
17. de Paiva, J. P. Q. et al. Sensorimotor white matter projections and disease severity in primary restless legs syndrome/Willis-Ekbom
disease: a multimodal DTI analysis. Sleep Med. 73, 106–116. https://doi.org/10.1016/j.sleep.2020.05.040 (2020).
Scientific Reports | (2021) 11:16116 | https://doi.org/10.1038/s41598-021-95238-6 8
Vol:.(1234567890)www.nature.com/scientificreports/
18. Davatzikos, C. Why voxel-based morphometric analysis should be used with great caution when characterizing group differences.
Neuroimage 23, 17–20. https://doi.org/10.1016/j.neuroimage.2004.05.010 (2004).
19. O’Donnell, L. J., Westin, C. F. & Golby, A. J. Tract-based morphometry for white matter group analysis. Neuroimage 45, 832–844.
https://doi.org/10.1016/j.neuroimage.2008.12.023 (2009).
20. Bach, M. et al. Methodological considerations on tract-based spatial statistics (TBSS). Neuroimage 100, 358–369. https://doi.org/
10.1016/j.neuroimage.2014.06.021 (2014).
21. Jung, N. Y. et al. Tract-specific correlates of neuropsychological deficits in patients with subcortical vascular cognitive impairment.
J Alzheimers Dis 50, 1125–1135. https://doi.org/10.3233/jad-150841 (2016).
22. Schroeder, R. W., Twumasi-Ankrah, P., Baade, L. E. & Marshall, P. S. Reliable Digit Span: a systematic review and cross-validation
study. Assessment 19, 21–30. https://doi.org/10.1177/1073191111428764 (2012).
23. Kessels, R. P., van Zandvoort, M. J., Postma, A., Kappelle, L. J. & de Haan, E. H. The Corsi Block-Tapping Task: standardization
and normative data. Appl. Neuropsychol. 7, 252–258. https://doi.org/10.1207/s15324826an0704_8 (2000).
24. Bowie, C. R. & Harvey, P. D. Administration and interpretation of the Trail Making Test. Nat. Protoc. 1, 2277–2281. https://doi.
org/10.1038/nprot.2006.390 (2006).
25. Scarpina, F. & Tagini, S. The stroop color and word test. Front. Psychol. 8, 557. https://doi.org/10.3389/fpsyg.2017.00557 (2017).
26. Ross, T. P. et al. The reliability and validity of qualitative scores for the Controlled Oral Word Association Test. Arch. Clin. Neu-
ropsychol. 22, 475–488. https://doi.org/10.1016/j.acn.2007.01.026 (2007).
27. Garibotto, V. et al. Disorganization of anatomical connectivity in obsessive compulsive disorder: a multi-parameter diffusion tensor
imaging study in a subpopulation of patients. Neurobiol. Dis. 37, 468–476. https://doi.org/10.1016/j.nbd.2009.11.003 (2010).
28. Kim, J. K. & Kang, Y. Normative study of the Korean-California Verbal Learning Test (K-CVLT). Clin. Neuropsychol. 13, 365–369.
https://doi.org/10.1076/clin.13.3.365.1740 (1999).
29. Meyers, J. E., Bayless, J. D. & Meyers, K. R. Rey complex figure: memory error patterns and functional abilities. Appl. Neuropsychol.
3, 89–92. https://doi.org/10.1207/s15324826an0302_8 (1996).
30. Villardita, C. Raven’s colored Progressive Matrices and intellectual impairment in patients with focal brain damage. Cortex 21,
627–634. https://doi.org/10.1016/s0010-9452(58)80010-6 (1985).
31. Noh, H. J. et al. The relationship between hippocampal volume and cognition in patients with chronic primary insomnia. J. Clin.
Neurol. 8, 130–138. https://doi.org/10.3988/jcn.2012.8.2.130 (2012).
32. Wang, Y. P. & Gorenstein, C. Psychometric properties of the Beck Depression Inventory-II: a comprehensive review. Braz. J.
Psychiatry 35, 416–431. https://doi.org/10.1590/1516-4446-2012-1048 (2013).
33. Koo, D. L., Kim, H. R., Kim, H., Seong, J. K. & Joo, E. Y. White matter tract-specific alterations in male patients with untreated
obstructive sleep apnea are associated with worse cognitive function. Sleep https://doi.org/10.1093/sleep/zsz247 (2020).
34. Park, H. R., Kim, H. R., Seong, J. K. & Joo, E. Y. Localizing deficits in white matter tracts of patients with narcolepsy with cataplexy:
tract-specific statistical analysis. Brain Imaging Behav. https://doi.org/10.1007/s11682-019-00100-z (2019).
35. Jenkinson, M., Beckmann, C. F., Behrens, T. E., Woolrich, M. W. & Smith, S. M. FSL. Neuroimage 62, 782–790. https://doi.org/10.
1016/j.neuroimage.2011.09.015 (2012).
36. Smith, S. M. et al. Advances in functional and structural MR image analysis and implementation as FSL. Neuroimage 23, S208–S219
(2004).
37. Wang, R., Benner, T., Sorensen, A. G. & Wedeen, V. J. Diffusion toolkit: a software package for diffusion imaging data processing
and tractography. Proc. Intl. Soc. Mag. Reson. Med. 15, 3720 (2007).
38. Mori, S., Crain, B. J., Chacko, V. P. & van Zijl, P. C. Three-dimensional tracking of axonal projections in the brain by magnetic
resonance imaging. Ann. Neurol. 45, 265–269. https://doi.org/10.1002/1531-8249(199902)45:2%3c265::aid-ana21%3e3.0.co;2-3
(1999).
39. Yoo, S. W. et al. An example-based multi-atlas approach to automatic labeling of white matter tracts. PLoS ONE 10, e0133337.
https://doi.org/10.1371/journal.pone.0133337 (2015).
40. Yeatman, J. D., Dougherty, R. F., Myall, N. J., Wandell, B. A. & Feldman, H. M. Tract profiles of white matter properties: automating
fiber-tract quantification. PLoS ONE 7, e49790. https://doi.org/10.1371/journal.pone.0049790 (2012).
41. Bullmore, E. T. et al. Global, voxel, and cluster tests, by theory and permutation, for a difference between two groups of structural
MR images of the brain. IEEE Trans. Med. Imaging 18, 32–42 (1999).
42. Groppe, D. M., Urbach, T. P. & Kutas, M. Mass univariate analysis of event-related brain potentials/fields I: a critical tutorial review.
Psychophysiology 48, 1711–1725. https://doi.org/10.1111/j.1469-8986.2011.01273.x (2011).
43. Han, C. E., Yoo, S. W., Seo, S. W., Na, D. L. & Seong, J. K. Cluster-based statistics for brain connectivity in correlation with behavioral
measures. PLoS ONE 8, e72332. https://doi.org/10.1371/journal.pone.0072332 (2013).
44. Sanroma, G., Wu, G., Kim, M., Ballester, M. A. G. & Shen, D. In Medical Image Recognition, Segmentation and Parsing (ed S. Kevin
Zhou) 231–257 (Academic Press, 2016).
45. Jin, Y. et al. Automatic clustering of white matter fibers in brain diffusion MRI with an application to genetics. Neuroimage 100,
75–90. https://doi.org/10.1016/j.neuroimage.2014.04.048 (2014).
46. Imfeld, A., Oechslin, M. S., Meyer, M., Loenneker, T. & Jancke, L. White matter plasticity in the corticospinal tract of musicians:
a diffusion tensor imaging study. Neuroimage 46, 600–607. https://doi.org/10.1016/j.neuroimage.2009.02.025 (2009).
47. Unrath, A., Juengling, F. D., Schork, M. & Kassubek, J. Cortical grey matter alterations in idiopathic restless legs syndrome: an
optimized voxel-based morphometry study. Mov. Disord. 22, 1751–1756. https://doi.org/10.1002/mds.21608 (2007).
48. Connor, J. R. et al. Postmortem and imaging based analyses reveal CNS decreased myelination in restless legs syndrome. Sleep
Med. 12, 614–619. https://doi.org/10.1016/j.sleep.2010.10.009 (2011).
49. Galbiati, A. et al. Neurocognitive function in patients with idiopathic Restless Legs Syndrome before and after treatment with
dopamine-agonist. Int. J. Psychophysiol. 95, 304–309. https://doi.org/10.1016/j.ijpsycho.2014.12.005 (2015).
50. Kim, S. M. et al. Working memory deficit in patients with restless legs syndrome: an event-related potential study. Sleep Med. 15,
808–815. https://doi.org/10.1016/j.sleep.2014.03.010 (2014).
51. Nestor, P. G. et al. Attentional networks and cingulum bundle in chronic schizophrenia. Schizophr. Res. 90, 308–315. https://doi.
org/10.1016/j.schres.2006.10.005 (2007).
52. Metzler-Baddeley, C. et al. Cingulum microstructure predicts cognitive control in older age and mild cognitive impairment. J.
Neurosci. 32, 17612–17619. https://doi.org/10.1523/jneurosci.3299-12.2012 (2012).
53. Sarubbo, S., De Benedictis, A., Maldonado, I. L., Basso, G. & Duffau, H. Frontal terminations for the inferior fronto-occipital
fascicle: anatomical dissection, DTI study and functional considerations on a multi-component bundle. Brain Struct. Funct. 218,
21–37 (2013).
54. Wasserthal, J., Neher, P. & Maier-Hein, K. H. TractSeg-Fast and accurate white matter tract segmentation. Neuroimage 183, 239–253
(2018).
55. Garyfallidis, E. et al. Recognition of white matter bundles using local and global streamline-based registration and clustering.
Neuroimage 170, 283–295 (2018).
56. Bertò, G. et al. Classifyber, a robust streamline-based linear classifier for white matter bundle segmentation. Neuroimage 224,
117402 (2021).
57. Bells, S. et al. Tractometry–comprehensive multi-modal quantitative assessment of white matter along specific tracts. Proc.Intl.
Soc. Mag. Reson. Med. 19, 678 (2011).
Scientific Reports | (2021) 11:16116 | https://doi.org/10.1038/s41598-021-95238-6 9
Vol.:(0123456789)www.nature.com/scientificreports/
58. Chamberland, M. et al. Dimensionality reduction of diffusion MRI measures for improved tractometry of the human brain.
Neuroimage 200, 89–100 (2019).
59. Cousineau, M. et al. A test-retest study on Parkinson’s PPMI dataset yields statistically significant white matter fascicles. NeuroIm-
age Clin. 16, 222–233 (2017).
Acknowledgements
This research was supported by Samsung Biomedical Research Institute grant (OTC1190671), Institute for Basic
Science IBS-R029-C3 (NTO1211801), grant of the Korea Health Technology R&D Project through the Korea
Health Industry Development Institute (KHIDI), funded by the Ministry of Health & Welfare, Republic of Korea
(grant number: HR21C0885), the National Research Foundation of Korea (NRF) grant, funded by the Korea
government (MSIT)(No.2020R1C1C1014725) and by Brain Research Program through the National Research
Foundation of Korea (NRF) funded by the Ministry of Science and ICT (No. 2020M3C7A101835721).
Author contributions
E.Y.J. and J.K.S. designed the study. E.Y.J. acquired the data and conducted the study. H.R.K., S.O. and H.R.P.
processed, analyzed and interpreted the data. H.R.P. and H.R.K. prepared the manuscript. E.Y.J. and J.K.S. con-
tributed to the revision of the manuscript.
Competing interests
The authors declare no competing interests.
Additional information
Supplementary Information The online version contains supplementary material available at https://doi.org/
10.1038/s41598-021-95238-6.
Correspondence and requests for materials should be addressed to J.-K.S. or E.Y.J.
Reprints and permissions information is available at www.nature.com/reprints.
Publisher’s note Springer Nature remains neutral with regard to jurisdictional claims in published maps and
institutional affiliations.
Open Access This article is licensed under a Creative Commons Attribution 4.0 International
License, which permits use, sharing, adaptation, distribution and reproduction in any medium or
format, as long as you give appropriate credit to the original author(s) and the source, provide a link to the
Creative Commons licence, and indicate if changes were made. The images or other third party material in this
article are included in the article’s Creative Commons licence, unless indicated otherwise in a credit line to the
material. If material is not included in the article’s Creative Commons licence and your intended use is not
permitted by statutory regulation or exceeds the permitted use, you will need to obtain permission directly from
the copyright holder. To view a copy of this licence, visit http://creativecommons.org/licenses/by/4.0/.
© The Author(s) 2021
Scientific Reports | (2021) 11:16116 | https://doi.org/10.1038/s41598-021-95238-6 10
Vol:.(1234567890)You can also read


