Heterogeneous snowpack response and snow drought occurrence across river basins of northwestern North America under 1.0 C to 4.0 C global warming
←
→
Page content transcription
If your browser does not render page correctly, please read the page content below
Climatic Change (2021) 164: 40
https://doi.org/10.1007/s10584-021-02968-7

Heterogeneous snowpack response and snow
drought occurrence across river basins of northwestern
North America under 1.0°C to 4.0°C global warming

Rajesh R. Shrestha 1 & Barrie R. Bonsal 2 & James M. Bonnyman 1 &
Alex J. Cannon 3 & Mohammad Reza Najafi 4

Received: 20 February 2020 / Accepted: 6 January 2021 / Published online: 12February 2021
# Crown 2021

Abstract
Anthropogenic climate change is affecting the snowpack freshwater storage, with socio-
economic and ecological impacts. We present an assessment of maximum snow water
equivalent (SWEmax) change in large river basins of the northwestern North America
region using the Canadian Regional Climate Model 50-member ensemble under 1.0 °C to
4.0 °C global warming thresholds above the pre-industrial period. The projections
indicate steep SWEmax decline in the warmer coastal/southern basins (i.e., Skeena, Fraser
and Columbia), moderate decline in the milder interior basins (i.e., Peace, Athabasca and
Saskatchewan), and either a small increase or decrease in the colder northern basins (i.e.,
Yukon, Peel, and Liard). A key factor for these spatial differences is the proximity of
winter mean temperature to the freeze/melt threshold, with larger SWEmax declines for the
basins closer to the threshold. Using the random forests machine-learning model, we find
that the SWEmax change is primarily temperature controlled, especially for warmer basins.
Further, under a categorical framework of below-normal SWEmax defined as snow
drought (SD), we find that above-normal temperature and precipitation are the dominant
conditions for SD occurrences under higher global warming thresholds. This implies a
limited capacity of precipitation increase to compensate the temperature-driven snowpack
decline. Additionally, the frequency and severity of SD occurrences are projected to be
most extreme in the southern basins where current water demands are highest. Overall,
the results of this study, including insights on snowpack changes, their climatic controls,
and the framework for SD classification, are applicable for basins spanning a range of
hydro-climatological regimes.

Keywords Climatic controls . Global mean temperature change . Large ensemble RCM .
Northwestern north america . Snow drought

* Rajesh R. Shrestha
  rajesh.shrestha@canada.ca

Extended author information available on the last page of the article
40   Page 2 of 21                                                    Climatic Change (2021) 164: 40

1 Introduction

Snowpack provides a natural freshwater reservoir in snow-dominated regions of the
world by storing precipitation in winter and releasing it as snowmelt runoff in spring
and summer when demands are highest. Warming climate is causing significant
alterations to snow regimes of the mountainous and high-latitude regions, affecting
volume, extent, and duration of the seasonal snowpack, as well as snowmelt-driven
runoff (Barnett et al. 2005; Bach et al. 2018). Studies have shown decreases in the
duration and extent of snow cover (Brown and Mote 2009; Derksen et al. 2015;
Mudryk et al. 2018) and declining trends in the mean and extreme snow depths (Fyfe
et al., 2017; Bach et al., 2018; Mote et al., 2018), causing the snowmelt-driven peak
runoffs to occur earlier (Dudley et al. 2017; Blöschl et al. 2017).
    Associated with these changes are periodic occurrences of exceptionally low snow
conditions, including recent occurrences in parts of the western USA (e.g., Mote et al.
2016; Cooper et al. 2016; Harpold et al. 2017; Hatchett and McEvoy 2017). These
below-normal snow conditions relative to historical average maximum snow water
equivalent (SWEmax) or snow drought (SD) have been characterized as dry SD due to
winter precipitation deficit and warm SD due to above-normal winter temperature
(Harpold et al. 2017; Dierauer et al. 2019). SD conditions could have substantial
implications in regions where large populations rely on seasonal snowpack-driven runoff
for water supply (e.g. for agriculture, human consumption, hydropower generation).
Specifically, smaller snowpack and earlier snowmelt lead to earlier peak flow, increased
winter flow, and decreased summer flow (Najafi et al. 2017). These changes could
impact water availability, especially in regions where built reservoir capacity is inade-
quate to cope with the seasonal shifts in supply (Barnett et al. 2005), and lead to
potentially large economic loss (Sturm et al. 2017). The decreasing contribution of
snowmelt to runoff also makes streamflow less predictable and water management more
challenging (Harpold et al. 2017). Additionally, natural ecosystems (e.g., vegetation,
aquatic habitat) could be impacted, e.g., snowpack loss and earlier snowmelt have been
associated with water stress on trees (Millar and Stephenson 2015) and increasing forest
fire risks (Trujillo et al. 2012; Gergel et al. 2017). Furthermore, a decreasing contribution
of snowmelt exacerbates stream warming during summer (Ficklin et al. 2013), which has
been associated with elevated mortality of adult sockeye salmon (Eliason et al. 2011).
    These issues are very relevant to the large region in northwestern North America (NWNA),
where the majority of downstream flows originate from snowmelt runoff in “water towers” of
the mountains (Bonsal et al. 2020). This large (40° N to 75° N and 100° W to 160° W) region
in Western Canada and the USA contains the trans-boundary river basins of Yukon, Macken-
zie, Saskatchewan, Fraser, and Columbia, and parts of the region have been characterized as
“at risk” of transitioning from a snow-dominated to a rain-dominated winter precipitation
regime (Nolin and Daly 2006; Brown and Mote 2009). Furthermore, environmental and
freshwater demands/pressures are prevalent across the region, especially in more southern
river basins with higher population and infrastructure demand (Bonsal et al. 2020). Previous
studies indicated declining trends of multidecadal snow water equivalent (SWE) in parts of the
region, which have been attributed to anthropogenic forcings (Pierce et al. 2008; Najafi et al.
2017). Future climate projections over NWNA indicate a continuation of historical trends, i.e.,
declines in the magnitude, extent and duration of snow storage due to warming temperatures
(e.g., Diffenbaugh et al. 2013; Fyfe et al. 2017).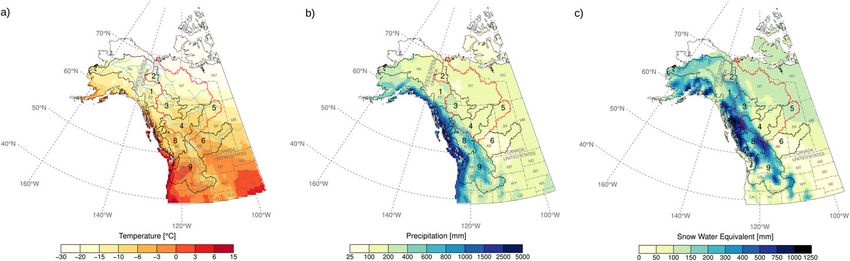
Climatic Change (2021) 164: 40                                                           Page 3 of 21    40

    However, highly spatially varied climatology (Fig. 1) together with differences in temper-
ature and precipitation projections across mid- to high-latitude regions suggests heterogeneous
snowpack responses in the river basins of the region. Specifically, enhanced warming at higher
latitudes, coupled with amplified poleward moisture transport (Min et al., 2008; Zhang et al.,
2013)—referred to as the Arctic amplification (Serreze and Barry 2011; Cohen et al. 2014)—
can be expected to lead to latitudinally varied snow responses across NWNA. The changes
could include a larger decrease in mean snowfall at mid-latitudes compared to high latitudes
(O’Gorman 2014) and a higher prevalence of low snow years at mid-latitudes (Diffenbaugh
et al. 2013). Also relevant is the temperature gradient across NWNA, with the mid-latitude
region’s winter temperatures, at present, closer to the freeze/melt threshold than high latitudes
(Fig. 1a). This suggests a higher sensitivity of the mid-latitude region’s snow regime to climate
warming and increased sensitivities at higher latitudes as the threshold shifts northward. In this
respect, while a number of previous studies have analyzed future snowpack changes across the
mid-latitudes (Fyfe et al. 2017; Dierauer et al. 2019), the spatial and temporal variability of
snowpack changes across the major river basins of this large region has not been investigated.
Such investigation can be helpful in characterizing second/third-order impacts, including water
supply, storage and ecosystem services, and thus, future adaptation strategies for these
important river basins in NWNA. Further, with the release of the Intergovernmental Panel
on Climate Change (IPCC) special report on Global Warming of 1.5 °C (IPCC 2018),
understanding basin-scale impacts at different policy-relevant goals (e.g., limiting global
warming to 1.5 °C or 2.0 °C) has become important.
    Given the aforementioned knowledge gaps, the objective of this study is evaluating large
basin–scale snowpack response over the NWNA region. We develop a framework for
assessing the climatic controls on SWEmax responses and evaluating SD occurrences in a
warmer climate. We focus on two key research questions: (i) how do the climatic controls on
snow response vary across the river basins with a range of hydro-climatological regimes? (ii)
How does the frequency and severity of snow drought vary under different global warming
thresholds (1.0 °C to 4.0 °C above the pre-industrial period)? To address these questions, we
primarily utilize a large ensemble (50 realizations) of the Canadian Regional Climate Model
(CanRCM4-LE) (Scinocca et al. 2015), driven by historical and future simulations from the
Canadian Earth System Model (CanESM2) (Arora et al. 2011). We apply a machine-learning
model, random forests (Breiman 2001), to evaluate the relative importance of primary climatic

Fig. 1 Baseline climatology (1961–2000) from CanRCM4-LE mean for the study region relevant to snow
accumulation and melt season. a October–March mean temperature. b October–March total precipitation. c
Annual maximum SWE. Numbers indicate nine river basins studied in detail: 1 Yukon, 2 Peel, 3 Liard, 4 Peace,
5 Athabasca, 6 Saskatchewan, 7 Skeena, 8 Fraser, and 9 Columbia. Mackenzie basin is shown by the red
boundary. Note that CanRCM4-LE extends approximately to the northern boundary of the Yukon River basin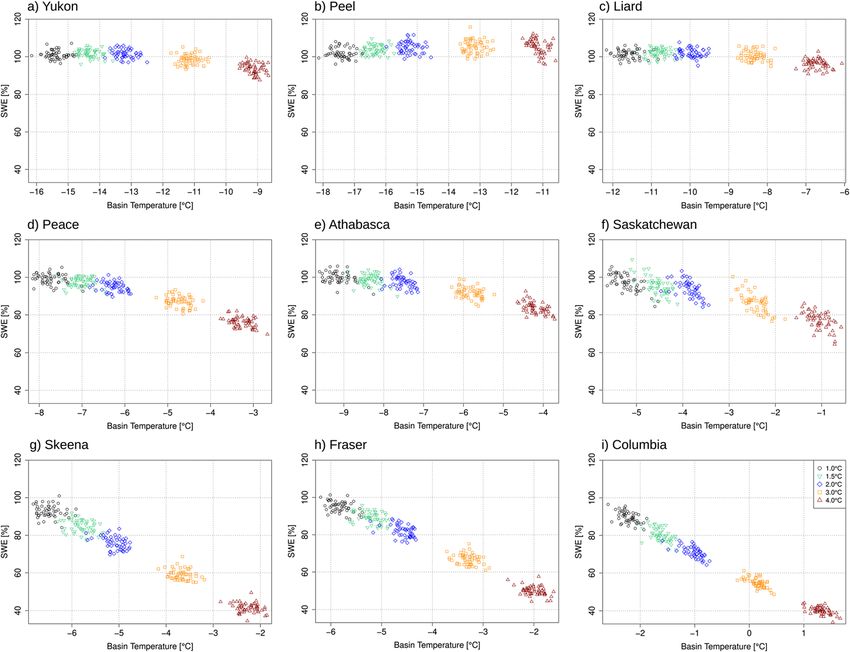
40   Page 4 of 21                                                   Climatic Change (2021) 164: 40

drivers (temperature and precipitation) on SWEmax response. Further, we define SD based on
categorical classifications (i.e., above-normal, near-normal and below-normal) of temperature,
precipitation, and snow conditions. Additionally, a detailed basin-scale prognosis of SWEmax
changes and SD occurrences is provided under 1.0 °C to 4.0 °C global warming.

2 Study region

Our study foci are the large river basins that originate in the Canadian portion of the
NWNA region (Fig. 1) and includes four major tributaries of the Mackenzie River (Peel,
Liard, Peace, and Athabasca), along with the entire Yukon, Skeena, Saskatchewan,
Fraser, and Columbia River basins (see Supplementary Material (SM) Table S1 for basin
characteristics). Climatic regimes of the region range from subarctic in the north to
temperate in the south. The region is highly varied in terms of temperature and precip-
itation, with a distinct temperature gradient from south to north and precipitation gradient
from interior to coast (Fig. 1 a and b). The resulting SWEmax response generally
corresponds to October–March precipitation, with higher accumulation in the coast
compared to interior (Fig. 1c). However, despite higher precipitation, SWEmax values
are lower in the southern coast due to above freezing October–March temperature.
    The selected river basins are highly diverse in terms of water usage, thus, subject to
different levels of vulnerabilities. Particularly, the southern basins of Fraser, Columbia,
and Saskatchewan—which are home to large populations in Western Canada including the
major urban centers of Vancouver, Edmonton, and Calgary—have considerable demand
for drinking water, irrigation, and hydropower generation. Particularly, hydropower gen-
erated from the Columbia River supplies about 77% of the regional demand for electricity
inside the basin in the USA and Canada (Hamlet et al. 2002), while about 22% of flow is
diverted from Saskatchewan River for consumptive water use, mainly for irrigation
(Bruneau et al. 2009). Parts of the region, including Greater Vancouver and Calgary, are
vulnerable to flooding, which occur due to snowmelt-driven runoff in combination with
heavy rainfall events (Pomeroy et al. 2016; Shrestha et al. 2017). There are major
hydropower generation and oil-sand development in the Peace and Athabasca River
basins, respectively, with both highly dependent on snowmelt-driven runoff (Schnorbus
et al. 2014; Dibike et al. 2018). The northern region (including the Yukon, Peel, and Liard
basins) has a sparse population and limited development. However, snowpack loss
together with permafrost degradation could have major implications on infrastructure
and services (Instanes et al. 2016). Further, river systems draining to the coast, including
Fraser and Skeena, provide important spawning habitat for Pacific Salmon (Morrison et al.
2002; Beacham et al. 2014) and are highly sensitive to summer water temperature
increases (Eliason et al. 2011).

3 Data and methods

3.1 Model datasets

This study is primarily based on the large ensemble 0.44° CanRCM4 (CanRCM4-LE), a
regional climate model that was developed under the framework of coordinated global and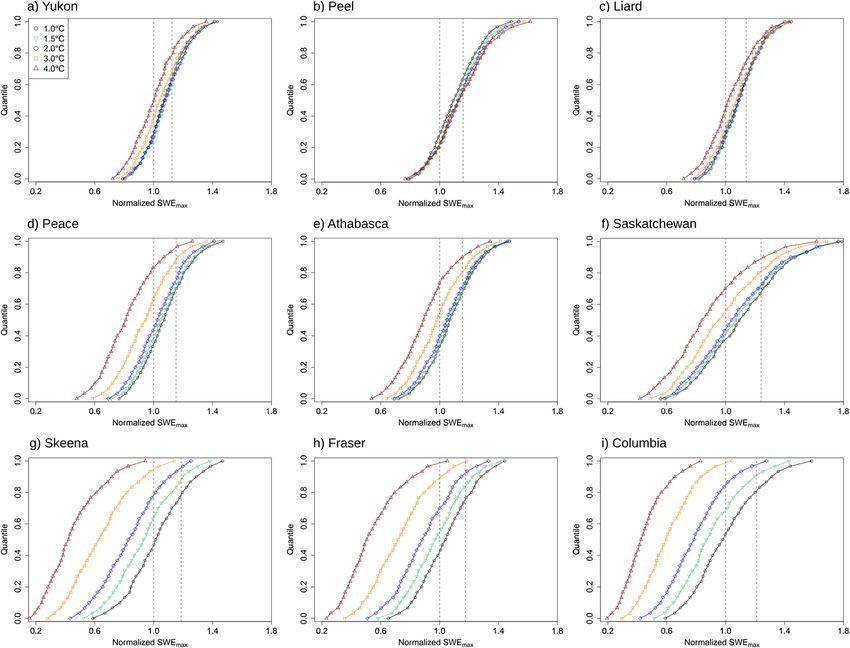
Climatic Change (2021) 164: 40                                                 Page 5 of 21   40

regional climate modeling (Scinocca et al. 2015). CanRCM4 shares the same package of
physical parameterizations with the Canadian global atmospheric climate model (CanAM4)
(Von Salzen et al. 2013). By employing a spectral nudging procedure in the Canadian Earth
System Model (CanESM2) (Arora et al. 2011), which is designed to constrain its evolution to
follow any large-scale driving data, CanRCM4 is supplied at the lateral boundary with inputs
from its parent GCM (Scinocca et al. 2015). CanRCM4 also includes the Canadian Land
Surface Scheme (CLASS) version 2.7, which has been designed from the outset to account for
snowpack dynamics (Verseghy 2000; Bartlett et al. 2006). Specific features of CLASS
relevant to snowpack dynamics include a variable depth snow layer and snow-vegetation
interactions for water and energy flux calculations. CLASS considers canopy snow
interception in terms of variable leaf area index, while snowpack albedo and density vary
with time, depth, temperature, and new snow according to an exponential decay function.
Further details on CLASS snow model are available in Verseghy (2000) and Bartlett et al.
(2006).
    The 50-member 0.44° CanRCM4-LE simulations over the North American domain are
driven at the boundary by CanESM2, with forcings from Coupled Model Intercomparison
Project Phase 5 (CMIP5) (Taylor et al. 2012) historical and representative concentration
pathway 8.5 (RCP8.5). The CanRCM4-LE runs were set up by initializing with five CanESM2
historical simulations and randomly perturbing the initial conditions in the year 1950 and
performing 10 runs for each CMIP5 ensemble member (Kirchmeier-Young et al. 2017).
CanRCM4-LE has also been used by Fyfe et al. (2017) for the projection of near-term snow
response in the western USA.
    Given the mountainous topography of the NWNA region, the 0.44° CanRCM4 (approx-
imately 50 × 50 km2) can be expected to result in elevation-dependent biases, especially when
considering grid-scale responses. Nevertheless, we used CanRCM4-LE because of the limited
availability of higher-resolution simulations covering the entire region. Furthermore, since our
analyses are based on basin-averaged responses (drainage areas: 57,000 km2 to 850,000 km2;
SM Table S1), the grid-scale uncertainty is assumed less critical. In addition, large ensemble
simulations (such as CanRCM4-LE) allow the consideration of a climate model’s internal
variability, and an amplitude of natural climate variability (Kay et al. 2015). As emphasized by
Deser et al. (2020), the consideration of internal variability is important because it is an
intrinsic property of a model and largely irreducible, and could account for a large fraction
of the CMIP5 GCMs inter-model spread. We also compared the CanRCM4 projections with
0.22° RCM-ensemble that comprise a single-member CanRCM4 and 3-member REMO RCM
(Jacob et al. 2012), and variable infiltration capacity (VIC) hydrologic model simulations for
the Liard, Peace, and Fraser basins (Shrestha et al. 2012, 2019; Schnorbus et al. 2014) (see SM
section S2).

3.2 Global mean temperature change calculation

We considered SWE, temperature, and precipitation changes under the policy-relevant thresh-
olds of 1.0 °C, 1.5 °C, 2.0 °C, 3.0 °C, and 4.0 °C global mean temperature (GMT) changes
with respect to the pre-industrial (PI) period of 1850–1900 following IPCC (2018). Given that
GCMs have different levels of climate sensitivities and biases, and respond differently to the
same radiative forcing scenario (Schleussner et al. 2016), the periods of GMT changes are
different for each GCM. In this study, the GMT changes for CanRCM4 were taken from Jeong
et al. (2019), in which the 31-year period of each GMT change was calculated relative to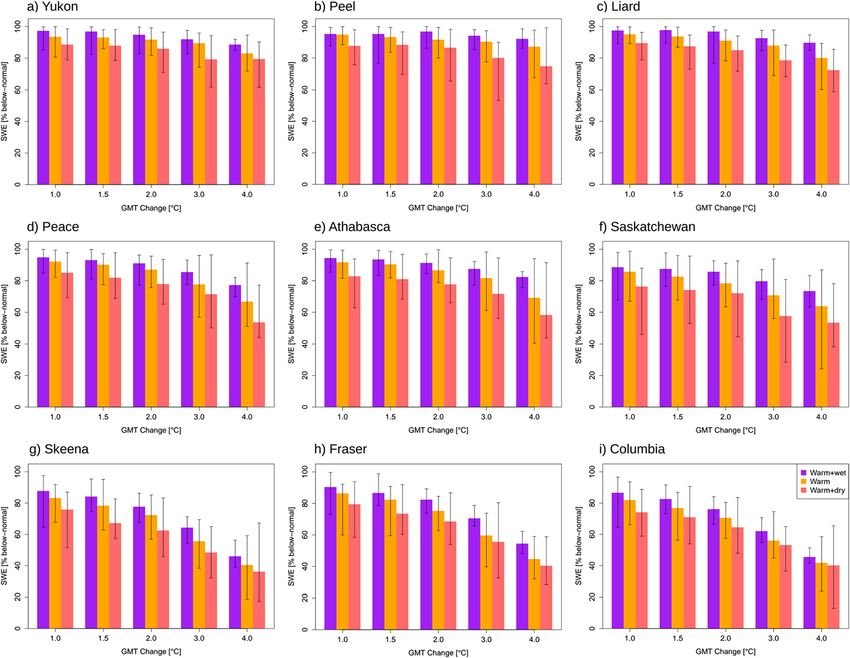
40   Page 6 of 21                                                     Climatic Change (2021) 164: 40

1986–2005, with a 0.79 °C temperature increase for the driving CanESM2 considered between
the PI period and 1986–2005 (SM Table S2). Since CanRCM4 simulations are not available
for the PI period, basin-scale comparisons of temperature, precipitation, and SWE changes at
different GMT levels were carried out with respect to the more recent baseline period of 1961–
2000.

3.3 Variable importance analysis

Following previous regression-based studies, which found high sensitivities of snow to
seasonal precipitation and temperature (e.g., Luce et al. 2014; Lute and Luce 2017;
Sospedra-Alfonso and Merryfield 2017), we evaluated the relative importance of these primary
climatic drivers (air temperature and precipitation corresponding to snow accumulation and
melt season) on snowpack response. We used the random forest (RF) ensemble machine
learning method for the predictor-response variable importance (VI) analysis because of its
ability to handle complex nonlinear problems including interactions between variables
(Breiman 2001), which is an important consideration given that the snow response is a result
of temperature and precipitation interactions. RFs have also been found to be efficient on large
databases (Wang et al. 2015) and provide reasonable estimation of VI, e.g. for identification of
climatic controls on snow and streamflow responses (Shrestha et al. 2019) and evaluation of
indices that contribute to flood hazard (Wang et al. 2015). See Breiman (2001) and Liaw &
Wiener (2002) for technical details on RF.
    This study employed the “randomForest” R-package (Liaw and Wiener 2018) to setup a
separate RF model for each of the nine river basins. We used the RF model to evaluate the basin-
averaged annual maximum SWE (SWEmax) response as a function of snow season air temper-
ature (herein referred to as temperature) and precipitation, i.e., October–December (OND) and
January–March (JFM) temperature (T) and precipitation (P). The RF model inputs included four
variables, i.e., OND_T, OND_P, JFM_T, JFM_P and one output variable, i.e., SWEmax, with
anomalies of each variable relative to 1961–2000 used to assess the effects of temperature and
precipitation changes on SWEmax changes. In order to analyze VI covering the entire period of
1961–2100, all 50 ensemble members of CanRCM4-LE with a combined total of 7000 model
years (50 simulations × 140 years) were used for training the RF model. The predictability of the
response variable was assessed using the Nash-Sutcliffe coefficient of efficiency (NSE).

3.4 Snow drought characterization

We used a categorical framework, consisting of a combination of temperature, precipitation,
and SWEmax quantiles at the above-normal, near-normal, and below-normal classes for
evaluating the SD conditions. We divided the quantiles relative to the categorical tercile
boundaries of the baseline period (1961–2000): (i) < 33rd percentile as below-normal; (ii)
between the 33rd and 67th percentiles as near-normal; and (iii) > 67th percentile as above-
normal. The classification is analogous to the probabilistic climate forecasting in which shifts
in forecasts (e.g., precipitation and temperature) are stipulated against the historical climato-
logical distribution (Barnston & Tippett, 2014). We defined (i) below-normal SWEmax condi-
tions as SD; thus, SD occurs 33% of the time in the baseline climate and no-change future
condition. The 33rd percentile threshold lies between the climatological mean threshold in
Dierauer et al. (2019) and consecutive years of SWEmax < 25th percentile in Marshall et al.
(2019).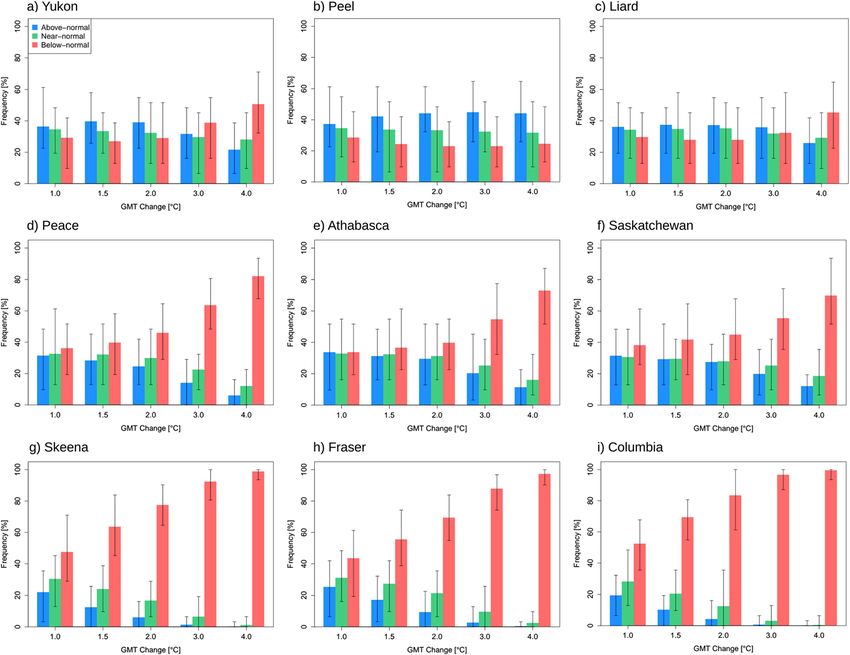
Climatic Change (2021) 164: 40 Page 7 of 21 40
We propose a generalized SD definition, applicable to primary mechanisms of SD occur-
rences in a range of hydro-climatic regimes, and in both historical and future climates (SM Fig.
S1). Given that SD could occur under both precipitation and temperature increases in a warmer
climate, we expanded the SD classifications by Harpold et al. (2017) and Dierauer et al. (2019)
to include the potential drought types. Accordingly, three main SD classes were identified:
SWEmax;i < SWE max;33 ∧ðPi < P33 Þ∧ðT i > T 67 Þ →SDwarmþdry ð1Þ
SWE max;i < SWEmax;33 ∧ðP33 < Pi < P67 Þ∧ðT i > T 67 Þ →SDwarm ð2Þ
SWE max;i < SWEmax;33 ∧ðPi > P67 Þ∧ðT i > T 67 Þ →SDwarmþwet ð3Þ
where SWEmax, i, Pi, and Ti are the basin-averaged maximum SWE, and October–March
precipitation and temperature, respectively, in year i. SWEmax;33 , P33 , and T 33 are the 33rd
percentiles of SWEmax and October–March precipitation and temperature for the baseline
period (1961–2000), respectively. Likewise, P67 , T 67 are the 67th percentiles of the
October–March precipitation and temperature for the baseline period, respectively. Besides,
these three SD classes decrease in SWEmax could occur under other conditions, especially
below-normal precipitation (e.g., dry and cold + dry classes; SM Fig. 1). However, SD
occurrences under these conditions were found to be rare in our evaluation of future response
and were not considered.
4 Results and discussion
4.1 Future snow response under GMT change
The CanRCM4-LE temperature projections at 1.0 °C to 4.0 °C GMT change thresholds
indicate progressively higher warming with GMT increases, which is consistent with the
expectation of enhanced warming in the northern latitudes. Projected precipitation changes
are highly heterogeneous, with larger increases in the northern region and southern interior,
and progressively larger changes at higher GMTs (see SM Figs. S2 and S3). The signal-to-
noise ratios of temperature and precipitation changes—as represented by the ensemble mean
divided by standard deviation of the 50-member model simulations—are greater than one in
most areas, with the exception of precipitation changes at 1.0 °C and 1.5 °C warmings in the
southern parts. Thus, in most cases, the change signals arising from the GMT increases are
beyond the range of CanRCM4-LE internal variability. This also suggests that the strengths of
temperature and precipitation increase signals are robust across the domain, even at low GMT
increases.
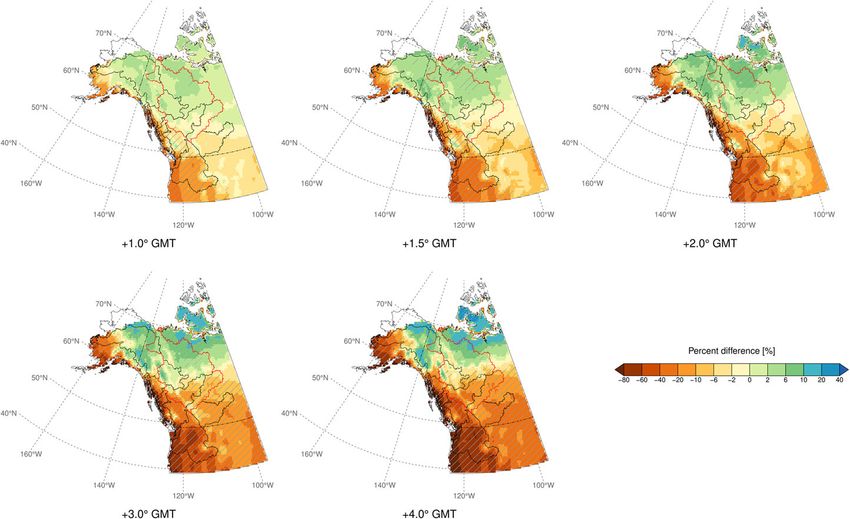
In the case of SWEmax, the responses are spatially heterogeneous, with a general pattern of
increases in the northern region and declines in the southern and coastal regions (Fig. 2). These
results are in general agreement with the SWEmax trends over 2020–2050 using CMIP5 GCM
ensemble (Mudryk et al. 2018). At 1.0 °C GMT change, the region approximately north of 60°
N show increases in SWEmax, except for the Alaska coast areas where temperature increases
are higher (SM Fig. S2), while south of 60° N show decreases. Besides this north to south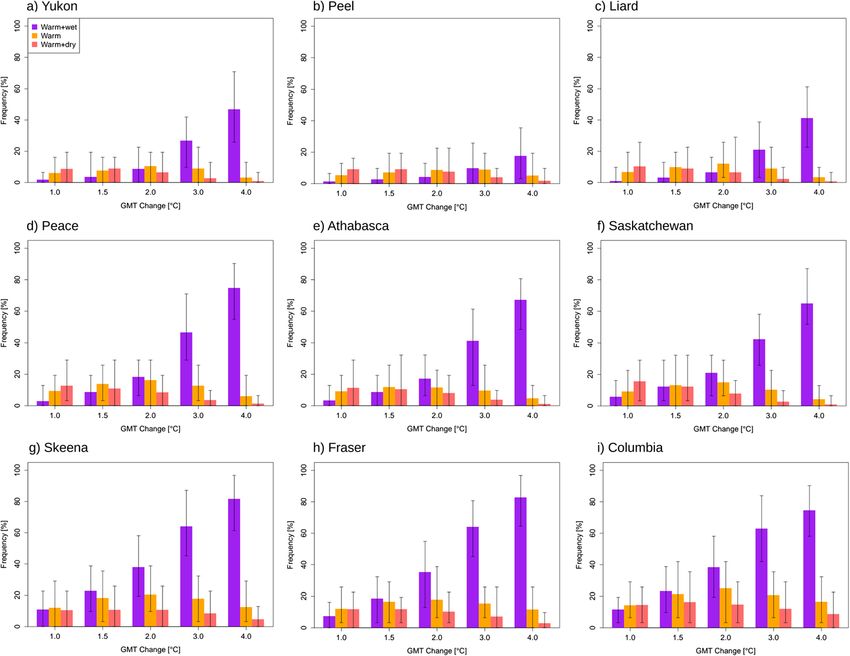
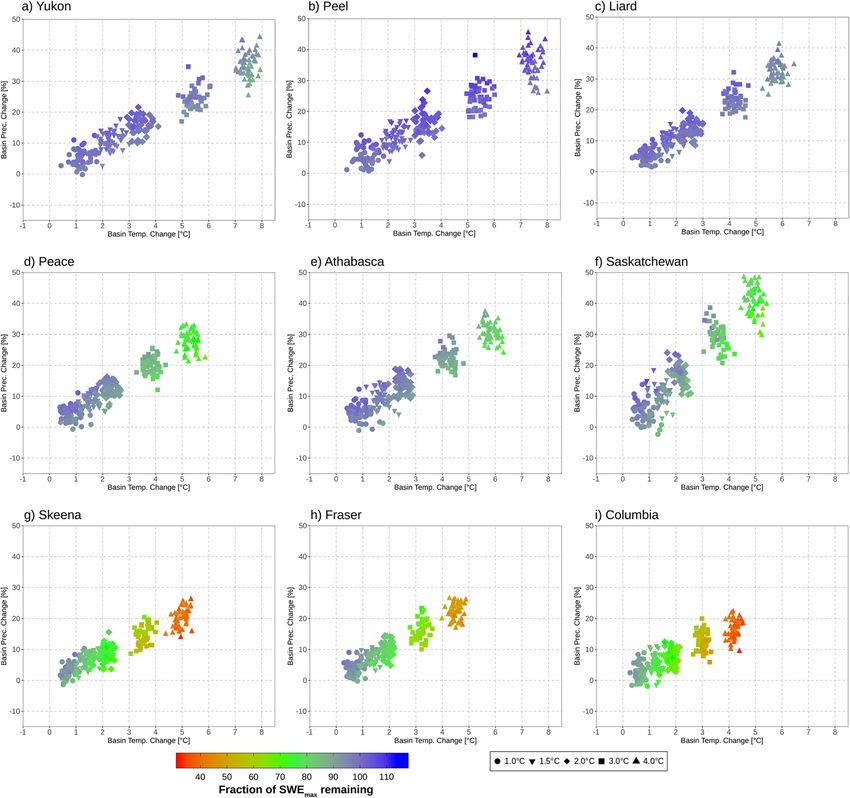
40   Page 8 of 21                                                         Climatic Change (2021) 164: 40

gradient, there is also an interior region to coast gradient of decreasing SWEmax. With the
GMT increases from 1.5 °C to 4.0 °C, the patterns of change are amplified, characterized by
progressively larger snow losses in the southern region, more intense losses in the coast, and
progressively larger increases in the northernmost region, while the areas with SWEmax losses
expand. Further, the SWEmax results at low GMT changes (i.e., 1.0 °C to 1.5 °C) are
characterized by strong loss signals (signal-to-noise ratios > 1) in the southern and coastal
regions, and relatively weak increased signals (signal-to-noise ratios < 1) in the northern
region. At 2.0 °C to 4.0 °C GMT increases, the change signals are strong across most of the
domain, with highly heterogeneous patterns of SWEmax declines in the south and increases in
the north, and weak signals in small transition areas.
   Also relevant to SWEmax changes are the basin-scale winter temperature states. For
instance, Lute and Luce (2017) found April 1 SWE to winter precipitation ratios vary between
~ 1 and 0 in areas with − 8 °C to + 4 °C variations in winter temperatures. In this study, the
SWEmax changes in the three northern basins (Yukon, Peel, and Liard) are small, because the
basins will remain cold even under more intense warming (Fig. 3), and the temperature-driven
reduction in snowfall fraction is mostly compensated by increased precipitation (SM Fig. S3).
For the three interior basins (Peace, Athabasca, and Saskatchewan), such balance between
basin temperature and precipitation increases seem to mostly maintain the historical SWEmax
levels up to 2.0 °C warming. However, at 3.0 °C and 4.0 °C warmings, it is apparent that the
balance is no longer maintained and substantial loss in SWEmax occurs. In the case of three
coastal/southern basins (Skeena, Fraser, and Columbia), rapid declines in the SWEmax start at
1.5 °C GMT increase due to the proximity of the basin temperatures to the freeze/melt
threshold. Overall, a rapid SWEmax loss in the region seems to occur when the mean basin
October–March temperature goes above − 5.0 °C to − 6.0 °C. Rapid loss was also projected by
Fyfe et al. (2017) in their evaluation of near-term (2013–2033) SWEmax change over the

Fig. 2 Projected changes in SWEmax under the GMT changes from 1.0 °C to 4.0 °C, relative to the mean of
baseline period 1961–2000. Hatching indicates areas where the mean of 50-member CanRCM4-LE divided by
standard deviation is greater than 1
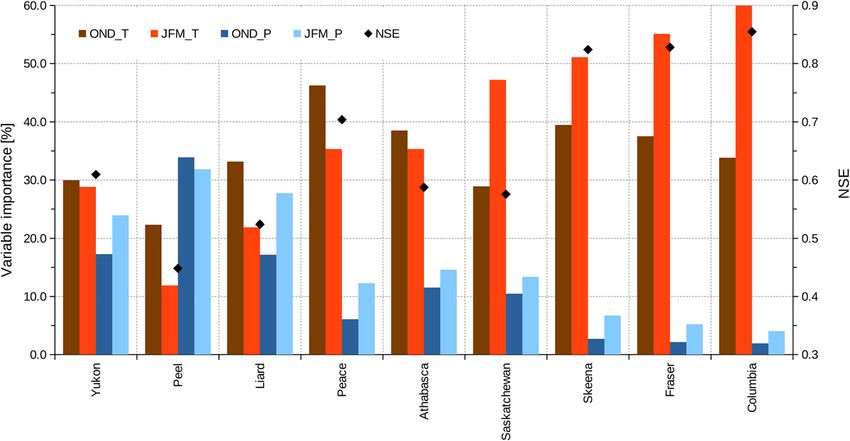
Climatic Change (2021) 164: 40                                                       Page 9 of 21   40

Western USA. Further, these results are in general agreement with previous studies that found
relatively larger snowpack declines at lower elevations than higher elevations, and by exten-
sion larger declines at higher basin temperatures (e.g., Cooper et al. 2016; Gergel et al. 2017;
Huning and AghaKouchak 2018; Marshall et al. 2019). However, the changes cannot be fully
explained in terms of mean basin temperatures. For instance, although the basin temperatures
are similar in Skeena, Fraser and Saskatchewan, the SWEmax reduction in the former two is
more amplified between 1.5 °C and 4.0 °C GMT compared to the latter.

4.2 Variable importance of snow changes

Figure 4 summarizes the VI percentage scores obtained from the RF model for the nine basins,
with the relative controls of CanRCM4-LE simulated OND and JFM temperature and precip-
itation changes on SWEmax changes depicted. The controls vary greatly across the NWNA
region, characterized by decreasing influence of precipitation and increasing influence of
temperature from northern (colder) to southern (warmer) basins. Specifically, while precipita-
tion exerts the highest influence on SWEmax in the northernmost and coldest Peel basin, there
is only a minor influence of OND and JFM precipitation (VI < 10%) on the coastal/southern
(Skeena, Fraser and Columbia) basins. Overall, the temperature control on the southernmost
basin (Columbia) is about three times higher than the northernmost basin (Peel), with
progressively higher sensitivities from north to south. Furthermore, there are differences in
the seasonal temperature controls on SWEmax, e.g., higher influence of OND_T for the three

Fig. 3 Changes in mean SWEmax relative to October–March mean basin temperatures, under 1.0 °C to 4.0 °C
GMT changes. The results depict 31-year means from 50-member CanRCM4-LE, and the changes are
considered relative to the mean of 1961–2000 baseline period
40    Page 10 of 21                                                              Climatic Change (2021) 164: 40

northern basins (Yukon, Peel, Liard) and two interior basins (Peace, Athabasca) and higher
influence of JFM_T for the coastal/southern basins (Saskatchewan, Skeena, Fraser, Columbia).
Possible reasons for these differences include the temperature influence on the start of snow
accumulation, snowmelt initiation, and distribution of seasonal snowfall. Further, as explained
earlier, the snow accumulation/melt season (October–March) basin temperature state plays an
important role on snowpack response and its change (Fig. 3). In general, the warmer the basin
temperature state, the higher is the temperature control on SWEmax, and the smaller is the
influence of precipitation on SWEmax change.
    The RF model predictability scores, summarized in terms of NSE values, indicate moderate
(0.4 to 0.6) to good (> 0.6) model fits. Comparing the colder northern basins to warmer
southern basins, the NSE values are higher with the predominant temperature controls in the
south. Further, given the high NSE values (> 0.8), the decline in SWEmax storage in the
Skeena, Fraser, and Columbia basins can be mostly explained by seasonal temperature
increases. The NSE values are lower for the northern basin, especially Peel and Liard, thus,
the seasonal temperature and precipitation changes do not sufficiently explain the SWEmax
change. The NSE-based performance also suggests a potential for developing predictive
snowpack models using RFs, with further decomposition of driving variables (e.g., rainfall
and snowfall) and model selection using different metrics offering possible pathways for
further improvements (e.g., Räisänen 2008; Lute and Luce 2017). This was not explored in
this study since we are only focused on VI of precipitation and temperature on SWEmax
response.
    Further, we analyzed the sensitivities of SWEmax in relationship to October to March
temperature and precipitation changes, and at 1.0 °C to 4.0 °C GMT changes for the nine
selected basins (Fig. 5). The results depict contrasting responses to temperature and precipi-
tation changes, characterized by increasing sensitivities of SWEmax from north to south.
Specifically, while SWEmax generally declines with GMT increases, the magnitude of changes
varies across the region, i.e., small reductions under higher (4.0 °C) GMT change in the
northern basins (Yukon and Liard), moderate declines (~ 90% remaining at 2.0 °C and ~ 80%

Fig. 4 Variable importance scores (%) for SWEmax change with respect to October–December and January–
March temperature and precipitation changes for nine river basins. Also shown are the model fits in terms of NSE
Climatic Change (2021) 164: 40 Page 11 of 21 40
remaining at 4.0 °C) in the interior (Peace, Athabasca and Saskatchewan), and steep declines
(~ 80% remaining at 2.0 °C and ~ 40% remaining at 4.0 °C) in the coastal/southern basins
(Skeena, Fraser, Columbia). As outlined earlier, the large SWEmax reductions in the southern
basins correspond to higher temperature sensitivities (Fig. 4), which in turn can be linked to the
near-freezing October–March temperatures in these basins (Fig. 3). Further, it is evident that
the precipitation increase is not able to offset the warming-induced decline in snow accumu-
lation. In contrast, in the relatively colder northern basins, the higher precipitation increases
mostly sustain the baseline SWEmax levels even with higher temperature increases. The
importance of the basin-scale temperature on future SWEmax response is illustrated by
contrasting responses between (b) Peel and (f) Saskatchewan basins. While the precipitation
increases for the two basins are in the similar ranges, there are more pronounced declines in
SWEmax in the warmer Saskatchewan basin even with smaller temperature increases. Never-
theless, the basin-scale precipitation change does have a role in SWEmax change. For instance,
comparing the (f) Saskatchewan and (g) Skeena basins, where temperature changes and
historical temperature ranges are similar, there is a smaller SWEmax decline in Saskatchewan
due to larger precipitation increase. Overall, under the warming scenarios, the basins with
higher temperature sensitivities will experience more substantive snow declines than the basins
with higher precipitation sensitivities, with the magnitude of precipitation increase determining
the magnitude of SWEmax change.
The higher SWEmax sensitivity to winter temperature for the warmer coastal/southern basins
is consistent with the observation-based spatial analog of snowpack response in the western
USA (Lute and Luce, 2017), where April 1 SWE to precipitation ratio tended to decline
rapidly with warmer temperatures compared to colder temperatures. Furthermore, the
results of this study align with the northern hemisphere snowpack variability assessment
by Sospedra-Alfonso and Merryfield (2017). Using CanESM2 1850-2100 simulations,
they found a threshold of − 5 ± 1 °C, below which the snowpack amount is primarily driven
by precipitation and above which it is primarily driven by temperature. The threshold also
aligns well with the start of the rapid snowpack decline in this study (Fig. 3). Thus, with the
twenty-first century warming, sensitivity of snowpack response to temperature in warmer
regions increases and even dominates, likely due to temperature-induced reduction of the
snowfall fraction, which is not compensated by precipitation increases. Additionally, the
regions currently with higher precipitation sensitivity would be expected to become more
sensitive to temperature.
4.3 Changes in snow drought characteristics
Next, we compared the quantiles of 50-member CanRCM4-LE spatially averaged SWEmax
under the scenarios of 1.0 °C to 4.0 °C GMT changes (Fig. 6). Corresponding to the SD
definition, the SWEmax values were normalized by the 33rd percentiles of the baseline period
(1961–2000). Thus, values below the normalized SWEmax = 1 (shown by a vertical line)
indicate SD conditions, while values between 33rd and 67th percentiles (shown by the second
vertical line) indicate near-normal snow conditions. The results generally reveal a consistent
pattern in terms of the direction of change, i.e., shift toward lower SWEmax values with higher
levels of warming. An exception is the Peel basin, where small shifts toward higher SWEmax
values are projected under higher warming thresholds. The difference can be mainly attributed
to the predominant precipitation control for this basin (Fig. 4), with the effects of precipitation
increases overshadowing the effects of warming. In the case of Yukon and Liard basins, there40 Page 12 of 21 Climatic Change (2021) 164: 40 Fig. 5 Sensitivity plots for SWEmax change with respect to seasonal temperature change (°C) and precipitation change (%) for nine river basins. The results depict 31-year means from 50-member CanRCM4-LE, and the changes are considered relative to the mean of 1961–2000 baseline period is some evidence of the counteracting influence of precipitation increases, as depicted by almost identical quantile values at 1.0 °C, 1.5 °C, and 2.0 °C GMT changes. However, there are distinct shifts in the quantile values from 2.0 °C to 4.0 °C. With higher temperature controls in the interior and coastal/southern basins, the shifts in SWEmax quantiles are increasingly larger. Consequently, the levels of warming at which majority of years are under SD conditions vary across the region. Specifically, for the Peace, Athabasca, and Saskatche- wan basins, SD conditions prevail for majority of years (> 50%) when the GMT increase reaches 3.0 °C. The levels of warming at which majority of years are under SD conditions are 1.5 °C for Skeena and Fraser, and 1.0 °C for Columbia. For Yukon, Peel, and Liard, majority of years do not reach SD conditions even at 4.0 °C GMT change. Classifying SWEmax quantiles into three categories—above-normal, near-normal, and be- low-normal—depict highly varied responses across the region (Fig. 7). For the Yukon, Peel, and Liard basins, the below-normal conditions are less than the expected occurrences (33%), except for ≥ 3.0 °C GMT change in Yukon and Liard. For rest of the region, however, the SD conditions are greater than expected for all GMT changes including 1.0 °C. Further, for the
Climatic Change (2021) 164: 40                                                  Page 13 of 21   40

Peace, Athabasca, and Saskatchewan basins, the mean frequencies of SD occurrences are
projected to increase from about 40% at 1.5 °C to about 45% at 2.0 °C, and 80% at 4.0 °C
GMT change. In the case of Skeena, Fraser, and Columbia, the mean SD frequencies are about
60% at 1.5 °C, 75% at 2.0 °C, and almost 100% at 4.0 °C GMT change.
    Figure 8 summarizes the below-normal SWEmax conditions in terms of three SD classes:
SDwarm + dry, SDwarm, and SDwarm + wet, as defined by Eqs. (1), (2), and (3), respectively. The
results show that SDwarm + wet is the dominant class across the region, which is an expected
outcome of the future warming and wetting. SDwarm and SDwarm + dry occur less frequently
because near-normal or below-normal precipitation is less common in a warmer climate. Also
note that results for SDwarm and SDwarm + dry classes have high uncertainties as the ranges
CanRCM4-LE internal variability (as expressed by 50 ensemble members, shown by whiskers)
are greater than the mean values for majority of outputs. In the case of SDwarm + wet, the outputs
have greater confidence because the mean values are generally higher than the ranges obtained
from the internal variability of CanRCM4-LE. Considering the variability across the region, SD
occurrences are more frequent in the warmer coastal/southern basins than the northern basins,
again emphasizing the role of temperature control on SWEmax. Thus, the higher the temperature
controls, the higher are the SD frequencies with GMT increases. Conversely, the lower
temperature controls on SWEmax in the colder northern basins will make the SD conditions
less likely (except for 3.0 °C or higher GMT change).
    The severity of SD—expressed in terms of remaining SWEmax percentage relative to the
33rd percentile—indicates small reductions for the northern basins, gradual reductions for
the interior basins, and substantial reductions for the coastal/southern basins, with larger
changes at higher GMT increases (Fig. 9). Specifically, the remaining SWEmax for the three
SD classes are in the order of ~ 80% at 1.5 °C GMT change, and ~ 60% at 4.0 °C for the
interior basins compared to the 33rd percentile of the baseline. In the case of the coastal/
southern basins, the corresponding reductions are ~ 75% and ~ 40%, respectively. Note that
these values are only based on SD classes and are different from SWEmax losses in Fig. 3,
where changes relative to the mean SWEmax for all years (regardless of SD occurrence)
were considered. Again, the severity of SD occurrences, e.g., more severe SD in the
southern/coastal regions, can be linked to the predominant temperature control. As expect-
ed, the reduction in SWEmax, thus the severity of SD, are greater with decreased wetness,
i.e., progressively larger SWEmax reductions from SDwarm + wet to SDwarm, and to SDwarm +
dry. Hence, although SWEmax change is primarily a temperature-controlled process (Fig. 4),
precipitation change does play an important role in amplifying or reducing the effect of
temperature-driven SWEmax loss.
    Thus, under 1.0 °C to 4.0 °C global warming thresholds, areas in the southern NWNA are
projected to experience progressively larger declines in snowpack storage leading to predom-
inant SD conditions. The severity and frequencies of SD are most extreme in the Columbia and
Fraser basins, where water demands derived primarily from snowmelt-driven runoff, are
currently the highest. Furthermore, the basins in the interior regions, i.e., Peace, Athabasca,
and Saskatchewan, also have substantial water demand, and are projected to experience SD
conditions when GMT increases are 3.0 °C or higher. Additionally, there are considerable
differences in SD severity and frequency between 1.5 °C and 2.0 °C for the coastal/southern
basins and large differences between 2.0 °C and 3.0 °C for the coastal/southern basins and
interior basins. Thus, the differences in impacts will be substantially less if the GMT increase
were to be limited to 1.5 °C.
40 Page 14 of 21 Climatic Change (2021) 164: 40 Fig. 6 Changes in the mean of CanRCM4-LE SWEmax quantiles for nine river basins under 1.0 °C to 4.0 °C GMT change. The SWEmax values are normalized by the 33rd percentile of the 1961–2000 baseline period (shown by a vertical line). Second vertical line depict the 67th percentile 4.4 Evaluation of CanRCM4-LE simulations We evaluated the historical CanRCM4-LE simulation of temperature, precipitation, and SWE by comparing with available snow pillow observations and reanalysis snow data product. These datasets are summarized in SM Table S3, and comparison results are described in detail in SM Section S2. In summary, while CanRCM4 is able to capture some patterns of the observations, there are biases in SWE simulations attributable to mismatch of location and elevation of the point observation with the coarse resolution model grid and uncertainties in SWE simulation by CLASS model. Overall, the limited number of point observations and uncertainties in the data products make it difficult to assess the reliability of CanRCM4 simulations and conduct basin-scale SD analysis using observations. Comparing the results with VIC simulations for Liard, Peace, and Fraser basins (SM Figs. S7– S10), although the directions of changes are consistent, there are differences in the magnitudes, especially for the Fraser basin (e.g., SD frequencies are smaller for VIC at higher GMT changes). The differences arise from a number of factors, including differences in the snow model algorithm in VIC and CLASS (in CanRCM4), model resolution (VIC: 0.0625°; CanRCM4-LE: 0.44°), driving GCM structure and their internal variability, and different generations of GCMs (Fraser and Peace VIC simulations are from CMIP3 GCMs), and biases in driving temperature and precipitation. However, the distribution of SWEmax classes, SD frequency, and severity obtained from CanRCM4- LE (Figs. 7, 8, and 9) are generally consistent with those from 0.22° RCM-ensemble (SM Figs.
Climatic Change (2021) 164: 40                                                            Page 15 of 21     40

Fig. 7 Frequencies of the three categorical SWEmax classes: above-normal (> 67th percentile), near-normal
(between 33rd and 67th percentiles), and below-normal (< 33rd percentile) with respect to the baseline period
1961–2000 under 1.0 °C to 4.0 °C GMT change. The frequencies signify percentage occurrences of each SWEmax
class, with 33% occurrence under baseline and no-change future conditions. The bars depict mean frequencies for
the three SWEmax classes and whiskers depict maximum-minimum range over 50-member ensemble

S11–S13) at different GMT thresholds. The uncertainty range obtained from the internal variability
of CanRCM4 also covers the ranges of the RCM-ensemble driven by four GCMs. Overall, despite
some differences in magnitudes, the general consistency in the directions of change amongst
CanRCM4-LE, RCM-ensemble and VIC results indicate the robustness of CanRCM4-LE for
analyzing basin-scale responses.

5 Summary and conclusions

This study provided an assessment of snowpack changes for large river basins over the
northwestern North America region that span a range of hydro-climatic conditions. Further,
by applying the RF machine learning model, and defining SD in a categorical framework, we
provided novel perspectives on climatic controls on snowpack changes and snow drought
occurrences. Additionally, by using the large ensemble of CanRCM4 simulations under 1.0 °C
to 4.0 °C GMT increases above the PI period, the study provided a snapshot of basin-scale
snowpack changes with respect to IPCCs policy-relevant goals.
   The results indicate substantial declines in SWEmax in the coastal/southern basins (i.e.,
Skeena, Fraser, and Columbia), moderate decline in the interior basins (i.e., Athabasca, Peace,
and Saskatchewan), and marginal increase or decrease in the northern basins (i.e., Yukon, Peel,
40    Page 16 of 21                                                            Climatic Change (2021) 164: 40

Fig. 8 SD frequencies for below-normal SWEmax conditions with respect to baseline period 1961–2000 under
1.0 °C to 4.0 °C GMT change. The bars depict mean frequencies for three main driving climatic classes (warm +
dry; warm and warm + wet) and whiskers maximum-minimum ranges over 50-member ensemble

and Liard), with more contrasting differences under higher warming thresholds. We find that
SWEmax change is primarily temperature controlled, especially for the coastal/southern basins,
with the influence of precipitation increasing in the north. An important factor for these
differences is the basin-scale mean temperature state, particularly a proximity to the freeze/
melt threshold, with higher SWEmax losses for basins closer to the threshold.
   Using the categorical framework of below-normal, near-normal, and above-normal season-
al temperature, precipitation and annual SWEmax to define SD revealed that SD primarily
occurs under above-normal temperature and precipitation. Although SD occurrence under
above-normal precipitation may appear counter-intuitive, such a condition implies that pre-
cipitation increase cannot compensate the temperature-driven decline in snowpack. However,
precipitation change does play a role in amplifying or reducing the effect of temperature-driven
SWE loss. Overall, there are considerable differences in SD severity and frequency amongst
1.5 °C, 2.0 °C, and 3.0 °C; thus, the differences in impacts will be substantially less if the
GMT increase were to be limited to 1.5 °C. The changes in snowpack storage in NWNA will
have implications on future water availability in the region. The projected snowpack loss is
highest, and SD occurrence is more frequent in the coastal/southern basins, i.e., Columbia and
Fraser, where current water demands are the highest. Given that the snowpack loss is
accompanied by earlier peak flow and increased winter flow (e.g., Shrestha et al. 2012;
Schnorbus et al. 2014), the future water resource management in these coastal/southern basins
could be impacted.
Climatic Change (2021) 164: 40                                                         Page 17 of 21    40

Fig. 9 SD severity expressed in terms of % SWEmax remaining relative to the 33rd percentile of the baseline
period 1961–2000 under 1.0 °C to 4.0 °C GMT change. The bars depict mean frequencies for three main driving
climatic classes (warm + dry, warm, and warm + wet) and whiskers maximum-minimum ranges over 50-member
ensemble

    An important issue not considered in this study is the elevation effect on snowpack
storage, and the shift in freeze/melt threshold along with the center of mass of snowpack
(e.g., Huning & AghaKouchak, 2018). It was assumed that the resolution effect is not
critical for basin-averaged responses, which is supported by general consistency of
CanRCM4-LE results with the higher-resolution RCM-ensemble and VIC model results.
Nevertheless, the development of fine resolution snow and hydrologic models needs to be
prioritized for future research, especially in areas with high elevation gradient and poten-
tially large snowpack loss.
    Overall, the insights from this study on snowpack changes, their climatic controls, and
interactions with basin-scale mean temperature state, are applicable over wider snow-
dominated regions spanning a range of hydro-climatological conditions. Additionally, the
categorical SD classification methodology developed in this study has a wider applicability
for analyzing SD occurrences in a warming climate.

Supplementary Information The online version contains supplementary material available at https://doi.org/
10.1007/s10584-021-02968-7.

Acknowledgments We thank the Canadian Centre for Climate Modeling and Analysis, Environment and
Climate Change Canada for providing the large ensemble CanRCM4 simulations. We thank three anonymous
reviewers for their comments, which led to an improved version of the manuscript.
40 Page 18 of 21 Climatic Change (2021) 164: 40
Author contributions R.R.S., B.R.B., and A.J.C. conceptualized this study. R.R.S. and J.M.B. conducted
analyses and produced the figures. R.R.S. wrote the manuscript draft and M.R.N. helped in refining it to the
current form. B.R.B., A.J.C., and J.M.B. contributed to edits and revisions.
Funding This study was conducted with internal funding from Environment and Climate Change Canada.
Data availability Original CanRCM4-LE data used in this study are available through the Government of
Canada Open Data portal at https://open.canada.ca/data/en/dataset/83aa1b18-6616-405e-9bce-af7ef8c2031c.
Extracted data for individual river basins are available at https://open.canada.ca/data/en/dataset/f8996696-4354-
471d-808e-f681fa0091b2.
Compliance with ethical standards
Ethical approval Not applicable.
Consent to participate Not applicable.
Consent to publish Not applicable.
Competing interests The authors declare that they have no competing interests.
Open Access This article is licensed under a Creative Commons Attribution 4.0 International License, which
permits use, sharing, adaptation, distribution and reproduction in any medium or format, as long as you give
appropriate credit to the original author(s) and the source, provide a link to the Creative Commons licence, and
indicate if changes were made. The images or other third party material in this article are included in the article's
Creative Commons licence, unless indicated otherwise in a credit line to the material. If material is not included
in the article's Creative Commons licence and your intended use is not permitted by statutory regulation or
exceeds the permitted use, you will need to obtain permission directly from the copyright holder. To view a copy
of this licence, visit http://creativecommons.org/licenses/by/4.0/.
References
Arora VK, Scinocca JF, Boer GJ et al (2011) Carbon emission limits required to satisfy future representative
concentration pathways of greenhouse gases. Geophys Res Lett 38:L05805. https://doi.org/10.1029/
2010gl046270
Bach AF, van der Schrier G, Melsen LA et al (2018) Widespread and accelerated decrease of observed mean and
extreme snow depth over Europe. Geophys Res Lett 45:12,312–12,319. https://doi.org/10.1029/
2018GL079799
Barnett TP, Adam JC, Lettenmaier DP (2005) Potential impacts of a warming climate on water availability in
snow-dominated regions. Nature 438:303–309. https://doi.org/10.1038/nature04141
Barnston AG, Tippett MK (2014) Climate information, outlooks, and understanding–where does the IRI stand?
Earth Persp 1:20
Bartlett PA, MacKay MD, Verseghy DL (2006) Modified snow algorithms in the Canadian land surface scheme:
model runs and sensitivity analysis at three boreal forest stands. Atmos-Ocean 44:207–222. https://doi.org/
10.3137/ao.440301
Beacham TD, Cox-Rogers S, MacConnachie C et al (2014) Population structure and run timing of sockeye
salmon in the Skeena River, British Columbia. N Am J Fish Manag 34:335–348
Blöschl G, Hall J, Parajka J et al (2017) Changing climate shifts timing of European floods. Science 357:588–
590. https://doi.org/10.1126/science.aan2506
Bonsal B, Shrestha RR, Dibike Y, et al (2020) Western Canadian freshwater Availability: Current and Future
Vulnerabilities. Environ Rev. https://doi.org/10.1139/er-2020-0040
Breiman L (2001) Random forests. Mach Learn 45:5–32. https://doi.org/10.1023/A:1010933404324
Brown R, Mote P (2009) The response of northern hemisphere snow cover to a changing climate. J Clim 22:
2124–2145. https://doi.org/10.1175/2008JCLI2665.1Climatic Change (2021) 164: 40 Page 19 of 21 40
Bruneau J, Corkal DR, Pietroniro E et al (2009) Human activities and water use in the South Saskatchewan River
basin. Prairie Forum, In, pp 129–152
Cohen J, Screen JA, Furtado JC et al (2014) Recent Arctic amplification and extreme mid-latitude weather. Nat
Geosci 7:627–637. https://doi.org/10.1038/ngeo2234
Cooper MG, Nolin AW, Safeeq M (2016) Testing the recent snow drought as an analog for climate warming
sensitivity of cascades snowpacks. Environ Res Lett 11:084009. https://doi.org/10.1088/1748-9326/11/8/
084009
Derksen C, Brown R, Mudryk L, Luojus K (2015) Arctic: terrestrial snow. State of the Climate in 2014. J.
Blunden and D. S. Arndt. Bull Am Meteorol Soc 96:133–135
Deser C, Lehner F, Rodgers KB et al (2020) Insights from earth system model initial-condition large ensembles
and future prospects. Nat Clim Chang 10:277–286. https://doi.org/10.1038/s41558-020-0731-2
Dibike Y, Eum H-I, Prowse T (2018) Modelling the Athabasca watershed snow response to a changing climate. J
Hydrol: Reg Stud 15:134–148. https://doi.org/10.1016/j.ejrh.2018.01.003
Dierauer JR, Allen DM, Whitfield PH (2019) Snow drought risk and susceptibility in the Western United States
and southwestern Canada. Water Resour Res 55:3076–3091. https://doi.org/10.1029/2018WR023229
Diffenbaugh NS, Scherer M, Ashfaq M (2013) Response of snow-dependent hydrologic extremes to continued
global warming. Nat Clim Chang 3:379–384. https://doi.org/10.1038/nclimate1732
Dudley RW, Hodgkins GA, McHale MR et al (2017) Trends in snowmelt-related streamflow timing in the
conterminous United States. J Hydrol 547:208–221. https://doi.org/10.1016/j.jhydrol.2017.01.051
Eliason EJ, Clark TD, Hague MJ et al (2011) Differences in thermal tolerance among sockeye salmon
populations. Science 332:109–112. https://doi.org/10.1126/science.1199158
Ficklin DL, Stewart IT, Maurer EP (2013) Effects of climate change on stream temperature, dissolved oxygen,
and sediment concentration in the Sierra Nevada in California. Water Resour Res 49:2765–2782
Fyfe JC, Derksen C, Mudryk L et al (2017) Large near-term projected snowpack loss over the western United
States. Nat Commun 8:14996. https://doi.org/10.1038/ncomms14996
Gergel DR, Nijssen B, Abatzoglou JT et al (2017) Effects of climate change on snowpack and fire potential in the
western USA. Clim Chang:1–13. https://doi.org/10.1007/s10584-017-1899-y
Hamlet AF, Huppert D, Lettenmaier DP (2002) Economic value of long-lead streamflow forecasts for Columbia
River hydropower. J Water Resour Plan Manag 128:91–101. https://doi.org/10.1061/(ASCE)0733-
9496(2002)128:2(91)
Harpold AA, Dettinger M, Rajagopal S (2017) Defining snow drought and why it matters. EOS 98. https://doi.
org/10.1029/2017EO068775
Hatchett BJ, McEvoy DJ (2017) Exploring the origins of snow drought in the northern Sierra Nevada, California.
Earth Interact 22:1–13. https://doi.org/10.1175/EI-D-17-0027.1
Huning LS, AghaKouchak A (2018) Mountain snowpack response to different levels of warming. PNAS 115:
10932–10937. https://doi.org/10.1073/pnas.1805953115
Instanes A, Kokorev V, Janowicz R et al (2016) Changes to freshwater systems affecting Arctic
infrastructure and natural resources. J Geophys Res Biogeosci 121:567–585. https://doi.org/10.
1002/2015JG003125
IPCC (2018) Summary for policymakers. In: Global Warming of 1.5°C. An IPCC Special Report on the impacts
of global warming of 1.5°C above pre-industrial levels and related global greenhouse gas emission
pathways, in the context of strengthening the global response to the threat of climate change, sustainable
development, and efforts to eradicate poverty. World Meteorological Organization, Geneva, Switzerland
Jacob D, Elizalde A, Haensler A et al (2012) Assessing the transferability of the regional climate model REMO
to Different COordinated Regional Climate Downscaling EXperiment (CORDEX) regions. Atmos 3:181–
199. https://doi.org/10.3390/atmos3010181
Jeong DI, Cannon AJ, Zhang X (2019) Projected changes to extreme freezing precipitation and design ice loads
over North America based on a large ensemble of Canadian regional climate model simulations. Nat Haz
Earth Syst Sci 19:857–872. https://doi.org/10.5194/nhess-19-857-2019
Kay JE, Deser C, Phillips A et al (2015) The Community Earth System Model (CESM) large ensemble project: a
community resource for studying climate change in the presence of internal climate variability. Bull Amer
Meteor Soc 96:1333–1349. https://doi.org/10.1175/BAMS-D-13-00255.1
Kirchmeier-Young MC, Zwiers FW, Gillett NP (2017) Attribution of extreme events in Arctic sea ice extent. J
Clim 30:553–571
Liaw A, Wiener M (2018) randomForest: Breiman and Cutler’s random forests for classification and regression.
Version 4.6-14URL https://CRAN.R-project.org/package=randomForest
Liaw A, Wiener M (2002) Classification and regression by randomForest. R news 2:18–22
Luce CH, Lopez-Burgos V, Holden Z (2014) Sensitivity of snowpack storage to precipitation and temperature
using spatial and temporal analog models. Water Resour Res 50:9447–9462. https://doi.org/10.1002/
2013WR014844You can also read