An Investigation of Polymorphism in SMO and LMF1 Genes and Their Association with Body Size in White Fulani and Muturu Cattle Breeds
←
→
Page content transcription
If your browser does not render page correctly, please read the page content below
Advances in Bioscience and Biotechnology, 2020, 11, 319-344
                                                                                                https://www.scirp.org/journal/abb
                                                                                                          ISSN Online: 2156-8502
                                                                                                            ISSN Print: 2156-8456

An Investigation of Polymorphism in SMO and
LMF1 Genes and Their Association with
Body Size in White Fulani and Muturu
Cattle Breeds

Ridwan O. Ahmed1*, Semiu F. Bello2, Ibrahim Shu’aibu1, Matthew J. Hegarty1

Institute of Biological, Environmental and Rural Science, Aberystwyth University, Aberystwyth, UK
1

Department of Animal Genetics, Breeding and Reproduction, College of Animal Science, South China Agricultural University,
2

Guangzhou, China

How to cite this paper: Ahmed, R.O.,          Abstract
Bello, S.F., Shu’aibu, I. and Hegarty, M.J.
(2020) An Investigation of Polymorphism       Cattle production is integral to the people of Africa and her economy. To im-
in SMO and LMF 1 Genes and Their Asso-        prove cattle productivity, there is a need to inculcate molecular marker-assisted
ciation with Body Size in White Fulani
                                              selection into current breeding practices. In this study, we investigated, in
and Muturu Cattle Breeds. Advances in
Bioscience and Biotechnology, 11, 319-344.    White Fulani and Muturu cattle breeds, polymorphism of two candidate genes
https://doi.org/10.4236/abb.2020.117023       (Smoothened—SMO and Lipase Maturation Factor 1—LMF1) that have been
                                              reported to influence body size in cattle. The SMO gene encodes for the SMO
Received: May 18, 2020
                                              (smoothened) receptor protein; a membrane signal transducer that plays a
Accepted: July 14, 2020
Published: July 17, 2020                      role in the control of bone formation and adipogenesis. LMF1 encodes for the
                                              LMF1 protein which regulates post-translational maturation of vascular li-
Copyright © 2020 by author(s) and             pases. Desired regions of the genes were amplified and genotyped by direct
Scientific Research Publishing Inc.
                                              DNA sequencing or Polymerase chain reaction—Restriction Fragment Length
This work is licensed under the Creative
Commons Attribution International             Polymorphism. For association study, linear body measurements traits (BMTs)
License (CC BY 4.0).                          that can be used to predict body size were measured on each animal and val-
http://creativecommons.org/licenses/by/4.0/   ues of BMTs measured were compared between both breeds. Very significant
                Open Access
                                              (P < 0.001) differences, in favour of White Fulani, were observed for all the
                                              BMTs compared. Six (6) previously reported SNP (G21234C, C22424T and
                                              C22481T, T22939C, C23329T and T23458G) were found on the SMO while
                                              LMF1 was monomorphic at the expected (T > C) exon 4 mutation site. Asso-
                                              ciation analysis revealed that polymorphism on G21234C, C22424T, T22939C
                                              and T23458G loci significantly affected BMTs (P < 0.05 or 0.01) in both cattle
                                              breeds. The outcome of this study showed that SMO gene could be a useful
                                              candidate gene to facilitate marker assisted selection for body size while LMF1
                                              is monomorphic in the cattle breeds.

DOI: 10.4236/abb.2020.117023 Jul. 17, 2020                      319                     Advances in Bioscience and Biotechnology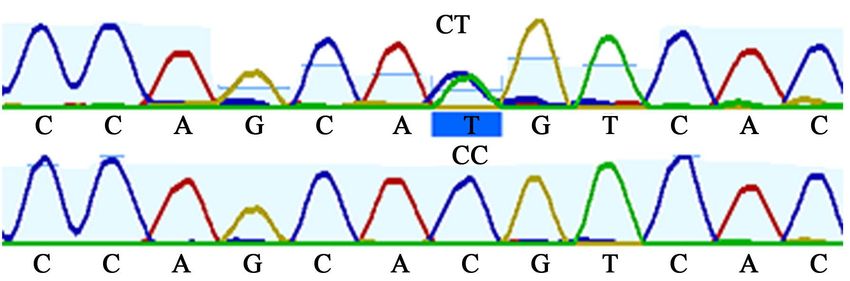
R. O. Ahmed et al.

                                 Keywords
                                 Smoothened, Lipase Maturation Factor 1, Body Measurement Traits, White
                                 Fulani, Muturu, Polymorphism

                               1. Introduction
                               Cattle production is integral to the people of Africa and her economy. It contri-
                               butes 33% of the agricultural GDP in developing countries [1]. According to [2],
                               the industry contributed 3.2% to 4% of Nigeria’s overall yearly Gross Domestic
                               Product (GDP) between 1970 to 2005. Cattle are a valuable source of protein to
                               the people, and it represents a means of livelihood for the small-scale rural cattle
                               owners and those involved in the cattle production value chain [3].
                                  Over the years, researchers have used genomic tools to identify genes influen-
                               cing physical traits in cattle and genetic variations that underline the differences
                               observed between individual cattle. The SMO gene has been marked as having a
                               contributory role in skeletal tissue development and adipogenesis in both verte-
                               brates and invertebrate [4]. It encodes for the SMO (smoothened) receptor pro-
                               tein; a membrane signal transducer that plays a role in the control of bone for-
                               mation and adipogenesis through the hedgehog signalling pathway [4, 5]. The
                               gene is mapped to bovine chromosome 4 with 12 exons encoding 780 amino ac-
                               ids [6]. The hypothesis of SMO gene polymorphism affecting economically im-
                               portant traits in cattle was first tested by [7]. Using PCR-Restriction Fragment
                               Length Polymorphism (RFLP), Zhang et al. [7] detected three single nucleotide
                               polymorphisms (SNP) on the SMO genes of 562 Qinchuan cattle and association
                               studies further revealed that two out of the three polymorphic sites (G21234C
                               and C22424T) are significantly associated with body measurement and meat qual-
                               ity traits. In 2015, [6] also conducted a study that confirmed the hypothesis that
                               variation in bovine SMO gene influences body size in cattle. By direct sequenc-
                               ing of the coding region and 3’UTR region of SMO gene in 520 Qinchuan beef
                               cattle, they identified eight single nucleotide polymorphisms (SNP) and linkage
                               disequilibrium analysis revealed five haplotypic groups. Collectively, SMO genes
                               could be a useful candidate gene to be included in marker-assisted selection
                               for cattle with superior body size during breeding programs. To the best of our
                               knowledge, there is no information about polymorphism of this gene in African
                               cattle.
                                  Another candidate gene of influence on body size is the Lipase maturation
                               factor 1 (LMF1). LMF1 encodes for the LMF1 protein. Paterniti et al. [8] were
                               the first to identify the protein in mouse, where a mutation that affected LMF1
                               protein resulted in hyperglycaemia in mice carrying double mutant allele. This
                               was as a result of very low levels of plasma lipases in those mice. Such abnormal-
                               ity has also been identified in human [9]. LMF1 is located on bovine chromo-
                               some 25 [10]. Metabolism of plasma lipid is under the control of vascular lipas-

DOI: 10.4236/abb.2020.117023                        320                    Advances in Bioscience and Biotechnology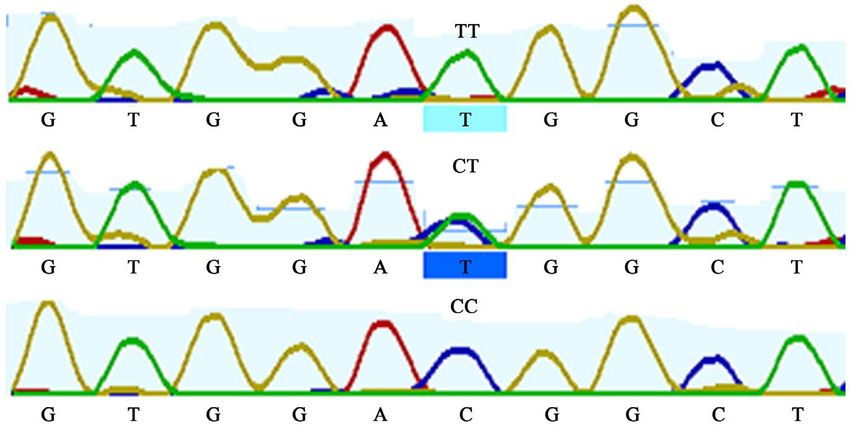
R. O. Ahmed et al.

                               es-lipoprotein, hepatic, and endothelial lipases. Through their action on triglyce-
                               rides, they regulate the level of plasma lipid and control tissue uptake; thereby
                               protecting the animal against cardiovascular diseases [11]. For these lipases to
                               attain active enzymatic function, post-translational maturation of their embryo-
                               nic polypeptide chain is required [12]; a process dependent on lipase maturation
                               factor 1 (LMF1) [13]. All these processes take place in the endoplasmic reticu-
                               lum of cells within lipase expression tissues such as adipose muscle and heart
                               [14]. In cattle, [10] screened four Chinese cattle breeds—Nanyang, Qinchuan, Jiax-
                               ian, and Chinese Holstein—for a missense mutation in LMFI. Using PCR-SSCP,
                               direct sequencing, and PCR-RFLP (AvaI endonuclease), they reported a SNP
                               (T > C) in LMF1 exon 4 in three of the four cattle breeds. The polymorphism
                               was associated with growth traits in Nanyang cattle. The T > C mutation re-
                               sulted in Trp > Arg substitution in LMF1 protein. Ren et al. [10] remains the
                               only publication of LMF1 gene polymorphism and its association with growth
                               traits in cattle.
                                  In this study, we investigated polymorphisms of SMO and LMF 1 genes in
                               White Fulani and Muturu cattle breeds of Nigeria and performed association
                               analysis to evaluate the effect of genetic variation of SMO with body measure-
                               ment traits. The White Fulani, a Bos indicus, is regarded as the most numerous
                               and widespread Nigerian cattle breed representing 37% of the country’s herd
                               [15]. The Muturu, a West African taurine, is a small-bodied trypanotolerant cat-
                               tle [16]. Because routine measurements of cattle body weight can be labour in-
                               tensive and not sustainable, linear body measurements are usually used as pre-
                               dictive measures for body weight. Traits such as heart girth and hip height have
                               been reported to have high phenotypic and genetic correlations with body weight
                               [17]. Ige et al. [18] reported that heart girth, horn length, body length, and hip
                               height could be used to predict body weight in White Fulani cattle with 0.92, 0.82,
                               0.83 and 0.69 as their respective coefficients of determination. Dim et al. [19]
                               reported a similar result in the same breed, emphasized that heart girth is the
                               most reliable parameter for bodyweight prediction. Daikwo et al. [20] obtained a
                               multiple regression equation to predict body weight of Muturu cattle from linear
                               body measurement. Heart girth and body length accounted for 90% of the dis-
                               parity in body weight; a proof that bodyweight could be predicted from the two
                               parameters with high accuracy.

                               2. Materials and Methods
                               2.1. Data Collection and Animal Source
                               Forty adult cattle (19 - 24 months) each of Muturu and White Fulani were ran-
                               domly selected from different livestock owners, to be as distantly related as
                               possible. The cattle were reared under a semi-intensive system. Muturu and
                               White Fulani were sourced from Ipokia Local Government Area, Ogun state and
                               Oyo West Local Government Area, Oyo state Nigeria, respectively. Linear body
                               measurements (body length, heart girth, withers height, rump length, and chest

DOI: 10.4236/abb.2020.117023                       321                     Advances in Bioscience and Biotechnology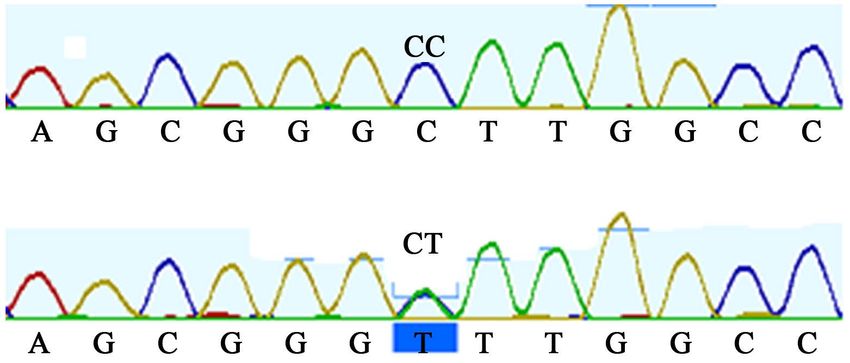
R. O. Ahmed et al.

                               depth) were obtained from each animal for statistical analysis. The measurements
                               were taken using measuring stick/tape as described by Gilbert et al. [21] and
                               done by one person to minimize error. Using the PG-100 collection kit from
                               PERFORMAGENE, a nasal swab was collected from each animal for DNA ex-
                               traction. The study was carried out between January, 2019-September, 2019.

                               2.2. Genomic DNA Extraction
                               Genomic DNA was extracted from the nasal swabs following PERFORMAGENE
                               guidelines found on https://www.dnagenotek.com/US/pdf/PD-PR-083.pdf).

                               2.3. PCR Amplification
                               For the two genes considered in this study, primers listed in the literature to am-
                               plify desired gene regions were ordered. Amplified regions and the expected
                               SNP within each gene region, as reported in the literature, are presented in Ta-
                               ble 1. The primers were first mixed with their respective quantities of 1xTE buf-
                               fer to make it up to 100 µM as prescribed the primer-design company. The for-
                               ward and reverse primers were then mixed and diluted to a working concentra-
                               tion of 10 µM.
                                  Polymerase chain reaction (PCR) was performed in a 15 µL reaction mixture
                               that contained 2 µL genomic DNA, 1 µM primer mix, 7.5 µL PCR ImmoMix
                               (contained magnesium chloride, DNA polymerase, and dNTPs-Bioline Ltd, UK)
                               and 4.5 µL dd H2O. The PCR cycling was performed in a G-Storm GS1 thermal
                               cycler (Akribis Scientific Limited, UK) with the following general protocols:
                               98˚C for 10 mins (initial denaturation), followed by 35 cycles of denaturation at
                               98˚C for 30 s, 50˚C annealing for 30 s, and a final extension at 72˚C for 60 s. The
                               actual annealing temperature used for amplifying each gene region is presented
                               in Table 1. PCR products were checked on 1% agarose gel.

                               Table 1. Primers used to amplify the target regions of each gene.

                                            Target                                                            Length
                                  Gene                   SNP (s)                       Primers                         A.T   Ref
                                            region                                                             (bp)

                                  SMO       Exon 9      G21234C         F: GCTTCACCCGTCTACTACCC                163     50    [7]

                                                                        R: GCTCATGGAAATGCCAGTTC

                                           Exon 11      C22424T         F: CCTTCAAACTGGGGATGGGT                319     60    [7]

                                                        C22481T           R: ATCCATACCTGGCGTTGC

                                           Exon 12      T22939C         F: CACAGAGCTTAGAGTCCCAG                601     50    [6]

                                                                       R: AAGCCTCGGAACGGTATTTGT

                                            3’UTR       C23329T        F: CTCATGGATGCAGACTCCGAC                        65    [6]

                                                        T23458G         R: GTGGGTTACTGGCCTACGG

                                 LMF1       Exon 4      T27154C           F: CATCCTGCCTGGGCTCTG                307     50    [10]

                                                                        R: TCACGGGCTCAGAAACAGGT

                               bp: Base pair, A.T: Annealing temperature in ˚C, Ref: Reference.

DOI: 10.4236/abb.2020.117023                              322                           Advances in Bioscience and Biotechnology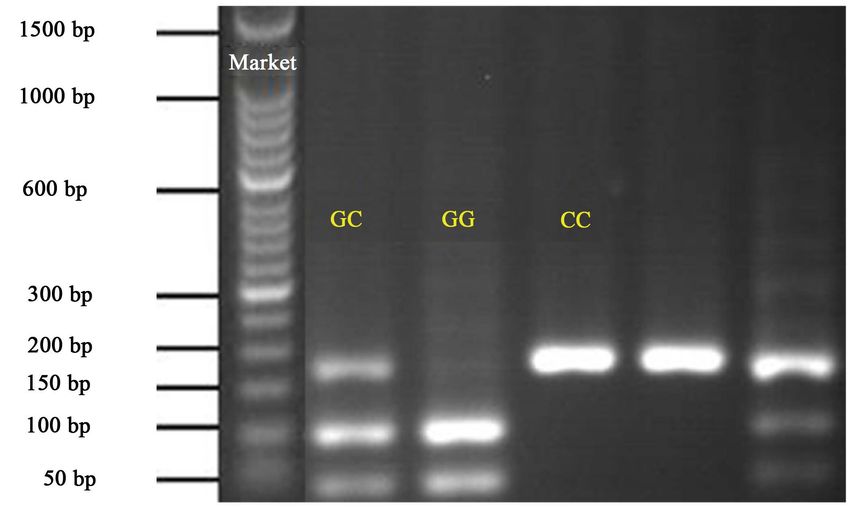
R. O. Ahmed et al.

                               2.4. Genotyping by PCR-Restriction Fragment Length
                                    Polymorphism
                               SMO exon 9 amplicon was genotyped by restriction fragment length polymor-
                               phism (RFLP) using Sau96I (New England, Biolabs) restriction enzymes. The
                               digestion mixture—which contained aliquots of 5 µL PCR product, 0.5 µL re-
                               striction enzyme, 2 µL Cut smart buffer, and 12.5 µL dd H2O—was incubated
                               overnight at 37˚C. Digested products were electrophoresed on 2% agarose gel
                               following the same procedure described above, except that the quantity of aga-
                               rose is 3 grams.

                               2.5. Amplicon Clean up
                               PCR products from gene regions to be directly sequenced were first purified so
                               that the primers and buffers are removed, leaving behind pure DNA. 60 µL of
                               ethanol/NaOAc solution (9375 µL 100% ethanol, 450 µL 3 M sodium acetate and
                               2175 µL of dd H20) was added to the 15 µL PCR products. The mixture was left
                               for 15 mins to allow for DNA precipitation, after which it was centrifuged for 45
                               mins at 2500 RCF. At this point, DNA had been precipitated, and the PCR plate
                               was inverted in a centrifuge for 5 seconds to remove the solution containing
                               primers and buffer. To remove any leftover primer, 75 µL of 80% ethanol was
                               added to each sample, centrifuged for 5 mins and inverted to remove the solu-
                               tion, leaving behind pure DNA. The purified DNA was diluted with 13 µL dd
                               H2O.

                               2.6. DNA Sequencing
                               5 µL of the purified DNA sample was mixed with 2 µL of diluted (1:50) forward
                               or reverse primers. After this, it was sent for Sanger sequencing at the Institute
                               of Biological, Environmental and Rural Science (IBERS) sequencing facility at
                               Aberystwyth University.
                                 Forward primer: SMO UTR
                                 Reverse primer: SMO12, SMO11, LMF1

                               2.7. Sequence Alignment
                               The sequence reads generated were search against the NCBI/GenBank database
                               using BLAST to check the percentage identity with the gene of interest. Using
                               Genomic Workbench software (v. 6.5, CLC Bio Ltd), multiple alignments of se-
                               quence reads from all samples were constructed to evaluate base constitution on
                               each position and for subsequent SNP identification. The software was also used
                               to trim low-quality reads. Base positions represented by multiple reads were
                               identified as candidate polymorphic sites. The base-calling scores at the poly-
                               morphic sites and the number of times each base variant (allele) appeared in the
                               samples were checked to increase confidence that the sequence variant is a true
                               mutation, and not merely sequence error. Geneious software (version 2019.2)
                               [22] was used to align multiple chromatograms to check for homozygosity and

DOI: 10.4236/abb.2020.117023                       323                    Advances in Bioscience and Biotechnology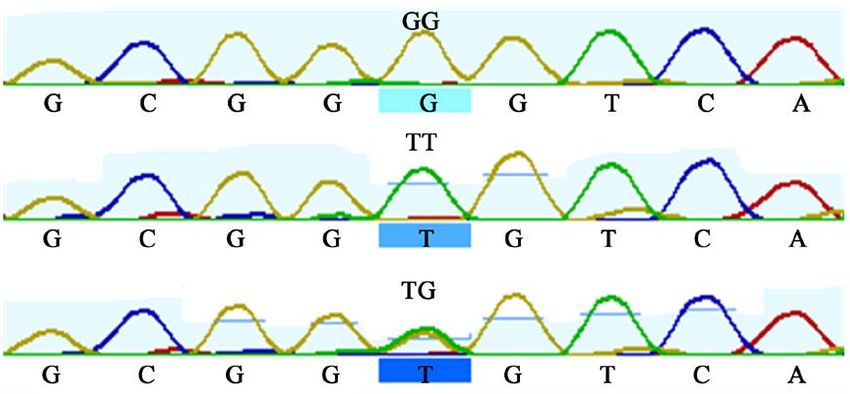
R. O. Ahmed et al.

                               heterozygosity at the mutation sites based on the presence of double peaks at the
                               SNP site.

                               2.8. Association Study and Statistical Analyses
                               The body measurement traits were linearly regressed against animals’ age (19 -
                               24 months) in order to account for the effect of age differences on body size.
                               Using the regression coefficient value from the linear regression equation, data
                               obtained from each animal was transformed to its predicted 24-month value.
                               The original data obtained from the field and the 24-month adjusted data is pre-
                               sented in Supplementary Table S6. The adopted linear regression model adopted
                               was
                                                                Yi =+
                                                                    a bX i + ei
                               where;
                                  Yi = Linear body measurement, a = intercept of the regression line on the
                               Y-axis, b = regression coefficient, X = age, ei = random error about the regres-
                               sion line.
                                  Data from Muturu and White Fulani were compared using the t-test. Allelic
                               and genotypic frequencies for each SNP were calculated by direct counting. The
                               genotypic frequencies were tested for deviation from Hardy-Weinberg equili-
                               brium using Chi-square (χ2) analysis. Single-factor multivariate ANOVA was
                               used to determine the association between SNP marker and body measurement
                               traits using SPSS software; version 24. General linear models (GLM) procedure
                               was followed with the following model:
                                                                Yi =µ + Gi + ε i
                               where;
                                 Yi = trait measured on each individual; μ = overall mean; Gi = fixed effect of
                               the ith genotype; and εi = random error.

                               3. Results
                               3.1. Regression Equation
                               Presented in Table 2 is the coefficient of determination (R2) values for each trait
                               regressed against age. The values were positive and above 80% except for rump
                               length and chest depth in White Fulani, which were 73% and 64% respectively.

                               Table 2. Coefficient of determination (R2 values) from the regression of each trait against
                               age.

                                          Traits (cm)                         WF                            Muturu
                                              BL                              0.86                            0.88
                                              HG                              0.83                            0.96
                                             WH                               0.89                            0.91
                                              RL                              0.73                            0.91
                                              CD                              0.64                            0.94

                               WF = White Fulani, BL = Body length, HG = Heart girth, WH = Wither height, RL = Rump length, CD =
                               Chest depth. Number of observations per trait = 40.

DOI: 10.4236/abb.2020.117023                            324                          Advances in Bioscience and Biotechnology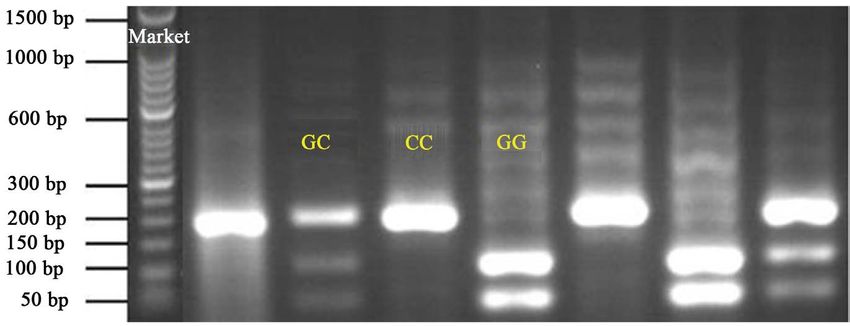
R. O. Ahmed et al.

                               3.2. t-Test Comparing Values from Muturu and White Fulani
                               Values from both breeds were compared using t-test (Table 3). Very significant
                               (P < 0.001) difference, in favour of White Fulani, was observed for all the traits
                               compared.

                               3.3. SMO Gene Polymorphism
                               3.3.1. SMO Exon 9
                               A 163-bp region was amplified in the exon 9 of bovine SMO gene. When incu-
                               bated with the restriction enzyme, Sau96I, to detect the G > C mutation ob-
                               served at the 21,234 bp-locus in Qinchuan cattle, the PCR product produced
                               three banding patterns representing CC, GC, and GG (Figure 1 and Figure 2).
                               Commensurate with the result of [7], the CC is represented by one fragment
                               (163 bp), GG by two fragments (64 and 99 bp), and GC by three fragments (64,
                               99 and 163 bp).
                                  Allelic and genotypic frequencies were calculated for each breed (Table 4). In
                               White Fulani, individuals with heterozygous GC genotype occurred most, fol-
                               lowed by CC and GG, respectively. In Muturu, the heterozygous (GC) genotype,

                               Figure 1. Gel electrophoresis showing the RFLP banding patterns for the three SMO9
                               genotypes in White Fulani. GC, CC and GG—observed genotypes.

                               Figure 2. Gel electrophoresis showing the RFLP banding patterns for the three SMO9
                               genotypes in Muturu. GC, CC and GG—observed genotypes.

DOI: 10.4236/abb.2020.117023                       325                    Advances in Bioscience and Biotechnology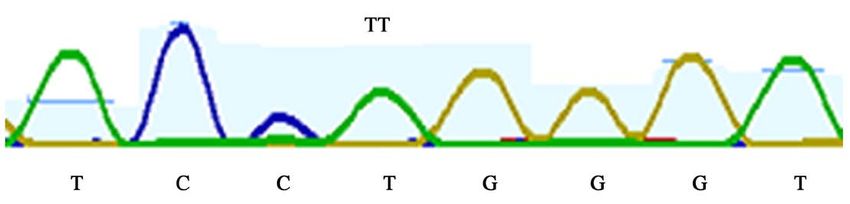
R. O. Ahmed et al.

                               Table 3. t-test comparing mean White Fulani and Muturu values for each trait.

                                                                                 (Mean ± SE)
                                        Traits (cm)                                                                        P values
                                                                  White Fulani                   Muturu

                                          BL (cm)                 133.55 ± 0.69              102.59 ± 0.47
R. O. Ahmed et al.
Table 5. Association of G21234C SNP genotypes of SMO9 gene with body measurement
traits in White Fulani and Muturu cattle.
Traits Genotypes
Breed P-value
(means in cm ± SE) CC GC GG
WF (37) BL 130.52c ± 0.94 134.46b ± 0.77 142.68a ± 2.49R. O. Ahmed et al.
Figure 3. Sequence map showing C22424T mutation in SMO exon 11 gene.
Figure 4. Sequence map showing C22481T mutation in SMO exon 11 gene.
Table 6. Allelic and genotypic frequencies of SMO exon 11 polymorphisms in Muturu
and White Fulani cattle.
Breed Genotypic freq. Total Allele freq HWE (χ2) P-value
C22424TSNP
CC CT C T
WF 0.76 (28) 0.24 (9) 37 0.88 0.12 0.159 0.690
MUT 0.77 (30) 0.30 (9) 39 0.88 0.12 0.157 0.692
C22481TSNP
CC CT C T
WF 0.86 (32) 0.14 (5) 37 0.93 0.07 0.000 1.000
MUT 1.00 (38) 0.00 (0) 39 1.00 0.00 0.000 1.000
WF: White Fulani, MUT: Muturu, freq. Frequencies, HWE: Hardy-Weinberg equilibrium.
2) Muturu
Significant differences (P < 0.05) was only observed in body length and chest
depth (Supplementary Table S1). Animals with CT genotype had significantly
higher mean body length and chest depth compared to those with CC genotype.
3.3.5. Effect of the SMO Exon 11 C22481T SNP on Body Measurement
Traits
In White Fulani breed, no significant (P > 0.05) difference was observed between
the two genotypes in all body measurement traits measured in this study (Sup-
plementary Table S2). All Muturu cattle carry same CC genotype.
3.3.6. SMO Exon 12
Exon 12 of the SMO gene was amplified and sequenced for 55 cattle. Using the
Geneious Prime software (Version 2019.2) [22] for sequence map analysis, T22939C
DOI: 10.4236/abb.2020.117023 328 Advances in Bioscience and BiotechnologyR. O. Ahmed et al.
SNP [6] was identified. All the animals were genotyped for the polymorphism by
direct sequencing and three genotypes—CC, CT, and TT—were found in both
cattle breeds (Figure 5).
Allelic and genotypic frequencies were calculated for each breed (Table 7). In
White Fulani, 70% of the cattle had CC genotype, 27% had heterozygous CT
while only one animal had the homozygous TT. Contrarily, 28% of the Muturu
cattle population carry the homozygous TT, 32% carry CC genotype while 40%
had heterozygous CT. Therefore, the T-allele was more frequent in the Muturu
breed (48%) compared to White Fulani (17%). All genotypic frequencies did not
deviate from Hardy-Weinberg equilibrium.
3.3.7. Effect of the SMO Exon 12 T22939C SNP on Body Measurement
Traits
1) White Fulani
Significant difference (P < 0.05) was observed among the genotypes for body
length and wither height. Mean values for body length and wither height in CT
genotype was significantly (P < 0.05) higher compared to CC genotype. Howev-
er, TT and CT genotypes were not significantly different (Supplementary Table
S3). No significant difference was observed between the three genotypes for all
other traits measured.
2) Muturu
For all the traits except chest depth, mean values for cattle with TT genotype
was highest (P ≤ 0.001), followed by CT and the least mean value was found in
cattle carrying the CC genotype (Supplementary Table S3).
Figure 5. Sequence map showing T22939C mutation in SMO exon 12 gene.
Table 7. Allelic and genotypic frequencies of T22939C SNP of SMO exon 12 gene in
Muturu and White Fulani cattle.
Genotypic freq. Allele freq.
Breed Total HWE (χ2) P-value
CC CT TT C T
WF 0.70 (26) 0.27 (10) 0.03 (1) 37 0.83 0.17 0.000 1.000
MUT 0.32 (12) 0.40 (16) 0.29 (11) 39 0.52 0.48 1.644 0.439
WF: White Fulani, MUT: Muturu, freq. Frequencies, HWE: Hardy-Weinberg equilibrium.
DOI: 10.4236/abb.2020.117023 329 Advances in Bioscience and BiotechnologyR. O. Ahmed et al.
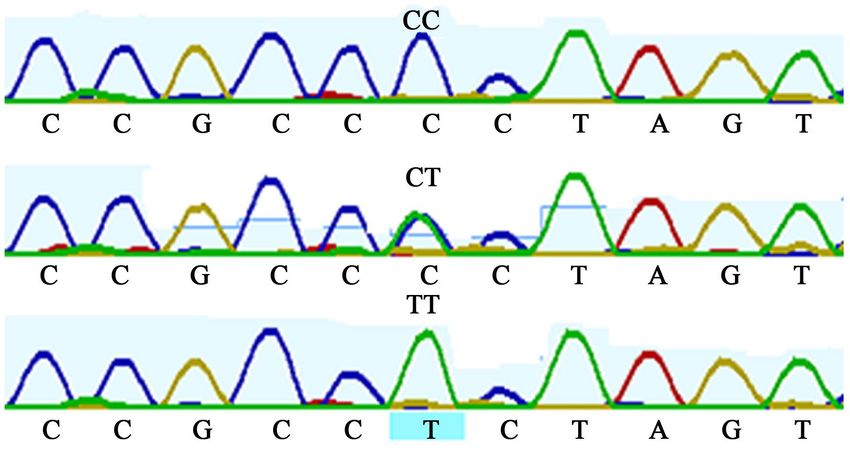
3.3.8. SMO 3’ Untranslated Region (3’UTR)
3’ UTR region of the SMO gene was amplified and sequenced for 76 cattle. Se-
quence mapping and genotype identification were done with Geneious Prime
software (version 2019.2) [22]. Two SNP—C23329T and T23458G—reported by
[6] were identified in the cattle population under examination.
Three genotypes were found for each SNP. CC, CT and TT; and TT, TG, and
GG genotypes were present for C23329T and T23458G SNP respectively (Figure
6 and Figure 7).
In both breeds, allelic and genotypic distribution were similar for the two SMO
3’UTR SNP. In C23329T, C-allele predominates, occurring at a frequency of 92%
and 91% in White Fulani and Muturu respectively. Only one animal per breed
carried the TT homozygous (Table 8). For the T23458G SNP, T and G-alleles
were prominent in both breeds; T-allele occurred in 53% and 57% of the White
Fulani and Muturu cattle respectively (Table 8). All genotypic frequencies did
not deviate from Hardy-Weinberg equilibrium.
Figure 6. Sequence map showing C23329T mutation in SMO 3UTR region.
Table 8. Allelic and genotypic frequencies of SMO 3’UTR polymorphisms in Muturu and
White Fulani cattle.
Breed Genotypic freq. Total Allele freq. HWE (χ2) P-value
C23329T SNP
CC CT TT C T
WF 0.87 (34) 0.10 (4) 0.03(1) 39 0.92 0.08 0.230 0.891
MUT 0.84 (31) 0.14 (5) 0.03(1) 37 0.91 0.09 0.200 0.905
T23458G SNP
TT TG GG T G
WF 0.34 (13) 0.37 (14) 0.29 (11) 38 0.53 0.47 1.697 0.428
MUT 0.40 (14) 0.34 (12) 0.26 (9) 35 0.57 0.43 3.304 0.192
WF: White Fulani, MUT: Muturu, freq. Frequencies, HWE: Hardy-Weinberg equilibrium.
DOI: 10.4236/abb.2020.117023 330 Advances in Bioscience and BiotechnologyR. O. Ahmed et al.
Figure 7. Sequence map showing T23458G mutation in SMO 3’UTR region.
3.3.9. Effect of the SMO 3’UTR C23329T SNP on Body Measurement
Traits
In both breeds, no significant (P > 0.05) difference was found between the three
genotypes for all the body measurement traits (Supplementary Table S4).
3.3.10. Effect of the SMO 3’UTR T23458G SNP on Body Measurement
Traits
Contrary to the no-effect obtained in C23329T SNP, significant difference ex-
isted between the genotypes for the T23458G SNP.
1) White Fulani
Mean values for body length and wither height were significantly (P < 0.01 or
P < 0.05) different across the genotypes. Values for TT and TG were similar but
significantly greater than values for GG in both body length and wither height
(Supplementary Table S5). No significant difference was found between the
three genotypes in all other traits measured.
2) Muturu
There was a significant difference (P < 0.01) between the genotypes for all body
measurement traits except chest depth. Cattle with TT genotype had significantly (P
< 0.01) higher mean values for body length, heart girth, wither height, and rump
length when compared to those with GG genotype (Supplementary Table S5).
3.4. Effect of the LMF1 Exon 4 T27154C SNP on Body
Measurement Traits
Using primers listed above, 307-bp of LMF1 exon 4 covering the T27154C po-
lymorphic site reported by Ren et al. [10] in Chinese cattle was amplified and
sequenced for 74 African cattle. Sequence analysis was done with Geneious
software (version 2019.2). At the T27154C mutation point, only homozygous
T-allele were found (Figure 8). In the population of White Fulani (38) and Mu-
turu (36) examined in this study, all animals had a fixed T-allele, and genotypic
frequency for TT was 1.0.
Figure 8. Sequence map showing absence of T27154C mutation on LMF1 exon 4 region.
DOI: 10.4236/abb.2020.117023 331 Advances in Bioscience and BiotechnologyR. O. Ahmed et al.
4. Discussion
4.1. Regression Equation
The coefficient of determination (R2) values for all the traits regressed against
age were positive and above 80% except for rump length and chest depth in
White Fulani, which were 73% and 64% respectively. This suggests that, unlike
in Muturu breed, age difference only accounted for a relatively smaller compo-
nent of the variations in rump length and chest depth between White Fulani cat-
tle. Such distinctions observed between cattle breeds might be as a result of
breed to breed differences in the shape of measured traits. Berge et al. [23] noted
that curvature of the first rib, around where chest depth is measured, varies
across breeds. Variations in the shape of rump between the breeds have been
reported. While the taurine breed has a well-muscled and more horizontal rump
[24], White Fulani rump gently slopes downward from hook to pin bone [25]. In
general, the regression equations can be used to make predictions for values of
body measurement traits with a moderate to high degree of confidence. This
agrees with the findings of [26] where age of cattle significantly accounted for
the differences in linear body measurement values (body length, height at with-
er, heart girth) in Muturu and White Fulani cattle. Bene [27] also reported a
moderate correlation (up to 0.46) between age of animal and body measurement
traits in nine cattle breeds.
4.2. t-Test Comparing Values of White Fulani and Muturu
Mean values for all body measurement traits were significantly higher in White
Fulani compared to Muturu. This is not unexpected as the highly varied body
size of both cattle breeds is well documented. Udeh [28] reported that at P <
0.01, body measurement traits (heart girth, withers height, and body length)
were significantly greater in zebu breed than Muturu. In the research conducted
by [26], body measurements—live weight, head length, head width, body length,
height at wither and heart girth—were significantly (P < 0.05) greater in White
Fulani compared to Muturu.
4.3. SMO Polymorphisms and Their Association with Body
Measurement Traits (BMTs)
As a result of its association with BMTs in other cattle breeds [6, 7], the SMO
gene was investigated here in White Fulani and Muturu breed. No study has
tried to investigate this.
4.4. SMO9 Polymorphism and Its Association with BMTs
Although with different allelic and genotype distribution, the G21234C SNP in
bovine SMO exon 9 was found in both breeds under investigation. The G-allele
had a higher occurrence in Muturu (56%) compared to 34% in White Fulani. In
agreement with the findings of [7], association analysis revealed that the G21234C
polymorphism affected body length, heart girth, wither height, and chest depth
DOI: 10.4236/abb.2020.117023 332 Advances in Bioscience and BiotechnologyR. O. Ahmed et al.
in both breeds. It was also associated with rump length in Muturu, but not in
White Fulani cattle. The non-significant effect of SMO9 on rump length observed
in White Fulani might not be unconnected to the relatively low coefficient of re-
gression obtained when age was regressed on rump length, as described above.
From the association result, the G allele and GG homozygous genotype are fa-
vourable for selection to improve body measurement traits in both breeds. In
both breeds, GG genotype was superior to CC in certain body measurement
traits (BL, HG, WH and CD). In Muturu, homozygous GG genotype had signif-
icantly (P < 0.05) higher mean values than the heterozygous GC genotype for all
traits except chest depth, unlike in White Fulani where mean values for the GG
and GC genotypes were not significantly different for those traits. The results for
White Fulani closely match the outcome observed in Qinchuan cattle where
homozygous GG cattle had the same mean BMTs as those with heterozygous
GC7. It is equally important to note that the GG genotype only appeared twice in
the White Fulani population under study. This low GG genotype might be as a
result of the small sample size used for this study. In all, this finding revealed
that genetic improvement program should focus on using selection to increase G
allele in the population.
As reported by [7], the G21234C SNP results in synonymous substitution of
arginine, thereby not altering the amino acid sequence of the translated protein.
This is not expected to alter the function of the SMO protein. However, influ-
ence of the SNP on body measurement traits observed can be explained by co-
don bias. This change in codon (G/C), although does not affect amino acid se-
quence, could affect the timing of translation from gene to protein [29, 30], the-
reby altering protein function and structure. This could be the scenario affecting
mRNA translation into SMO protein, which then influenced the transmission of
hedgehog signals. It has also been reported that through interaction with
RNA-binding proteins, such silent mutation can have a regulatory effect on
post-translational gene expression [31, 32]. Furthermore, non-synonymous SNP
can also influence DNA methylation in epigenetic regulation [33].
4.5. SMO Exon 11 Polymorphisms and Its Association with BMTs
4.5.1. G222424T
White Fulani and Muturu cattle population studied had two genotypes—CC and
CT. Homozygous TT was absent in both breeds. In Qinchuan cattle, [7] found
all the possible three genotypes. Absence of TT genotype in this study is likely to
be due to the small sample size. Statistical analysis revealed that mean values for
four BMTs in White Fulani (heart girth, wither height, rump length and chest
depth) and two BMTs in Muturu (body length and chest depth) were signifi-
cantly (P < 0.05) greater in cattle with CT genotype compared to those with TT
genotype. This finding agrees with what was reported by [7] where cattle with
CT genotype had significantly higher mean values for body measurement traits
relative to those with CC and TT genotype. Although the C > T SNP only re-
sulted in synonymous glycine mutation in the SMO protein, studies have re-
DOI: 10.4236/abb.2020.117023 333 Advances in Bioscience and BiotechnologyR. O. Ahmed et al.
vealed that such mutation can also affect protein function and structure as pre-
viously explained above in SMO exon 9 polymorphism. It appears that the hete-
rozygous CT genotype is favourable for superior body measurement traits in the
breeds. Therefore, conscious selection and breeding program should be put in
place to increase the frequency of this genotype in the Muturu and White Fulani
cattle population.
4.5.2. C22481T
In White Fulani, both CC and CT genotypes were found with CC occurring
more frequently. TT genotype was absent just as it was in Qinchuan cattle [7].
Only the CC genotype was found in Muturu cattle. This represents a clear dis-
tinction between the White Fulani and Muturu cattle population studied. The
absence of the T-allele in Muturu cattle might be due to the low sample size, or
the C22481T mutation has not happened in the breed. The mutation resulted in a
synonymous histidine substitution, as noted by [7]. Association studies in White
Fulani revealed that no significant (P > 0.05) difference exist between CC and CT
genotype for all the body measurement traits. This result tallies with the outcome
from [7] that the C22481T polymorphism does not affect body measurement
traits. A plausible explanation offered was that the effect of CC and CT genotype
on mRNA translation to SMO protein, and on the protein structure, was of equal
proportion. This SNP can therefore not be used for marker-assisted selection.
4.6. SMO Exon 12 T22939C Polymorphism and Its Association
with BMTs
Three genotypes—CC, CT, and TT—were identified in both Muturu and White
Fulani breeds for the C22939T SNP. The T-allele frequency was 17% and 48% in
White Fulani and Muturu breed respectively. TT-genotypic frequency of 28% in
Muturu compared to 3% in White Fulani exemplified the relative abundance of
the T-allele in Muturu cattle population. Statistical analysis revealed that mean
values for body length and wither height were significantly (P < 0.05) greater in
White Fulani cattle carrying CT and TT genotypes when compared to those with
the CC genotype. In Muturu, mean values for individuals with TT genotype was
very significantly (P < 0.001) greater than those with CC and CT genotypes for
all the body measurement traits except chest depth. Taken together, it appears
that selection to increase the frequency of T-allele in the population will be
beneficial to attain superior body measurement traits. In Qinchuan breed stu-
died by [6], cattle with C-allele had significantly (P < 0.05) lower body size traits
compared to those with the T-allele. Zhang et al. [6] reported that this T > C po-
lymorphism resulted in a non-synonymous serine to proline amino acid substi-
tution in the c-terminal of bovine SMO protein. Without mutation, activation of
the SMO protein is triggered by phosphorylation of serine-threonine residue at
the c-terminal end of the protein [34]. A substitution of serine to proline will not
permit phosphorylation, which will invariably inactivate SMO protein. There-
fore, this protein inactivation might be the basis for cattle with the C-allele hav-
DOI: 10.4236/abb.2020.117023 334 Advances in Bioscience and BiotechnologyR. O. Ahmed et al.
ing lower body measurement traits. The protein, which is a membrane signal
transducer, plays a role in the control of bone formation and adipogenesis through
the hedgehog signalling pathway [4].
4.7. SMO 3’UTR Polymorphisms and Its Association with BMTs
4.7.1. C23329T
White Fulani and Muturu cattle population examined had CC, CT, and TT ge-
notypes. Allelic and genotypic distribution were similar in both breeds with
C-allele predominating (92% and 91% in White Fulani and Muturu breed re-
spectively). Homozygous TT only appeared in one of the sampled animals per
breed. This suggests that this C > T mutation is not widely spread in Nigeria’s
White Fulani and Muturu cattle. Statistical analysis revealed that no significant
(P > 0.05) difference existed between the three genotypes for this SNP in both
breeds. This result is not in tandem with what was observed in Chinese Qin-
chuan cattle by Zhang et al. [6]. Animals with CC genotype had significantly (P
< 0.05) larger body measurement traits when compared to those with TT geno-
type in Qinchuan cattle. The absence of this SNP effect on body measurement
traits here might arise from the very low frequency of occurrence of T-allele in
both breeds under examination. It could also be that this SNP does not have an
effect on body measurement traits in Nigeria’s White Fulani and Muturu breeds,
and as such cannot be as molecular marker for cattle selection. The best practice
is to examine the effect of a marker on a breed using a large population of that
breed, as it is not unusual to find inconsistencies between different studies that
utilized different breeds [35]. Therefore, a larger sample size is needed to con-
firm the veracity of this result.
4.7.2. T23458G
Contrary to the dominance of one allele found in the C23329T SNP, both T and
G-alleles of the T23458G SNP of SMO 3’UTR have appreciable occurrence in
both breeds. T-allele frequency was 53% and 57% in White Fulani and Muturu
respectively. This shows that the T > G mutation on the 3’UTR region of SMO
has been fully established in both breeds. Also, as opposed to the no-effect of the
C23329T SNP, T23458G SNP has a significant influence on body measurement
traits in both cattle breeds. In White Fulani, individuals with TT genotype had
significantly (P < 0.05) greater mean values for body length and wither height
when compared to those with CC genotype. In the same vein, Muturu cattle with
TT genotype had significantly (P < 0.01) greater body length, heart girth, wither
height, and rump length relative to those with CC genotype. Taken together, it
will be beneficial to increase the T-allele in the population to achieve superior
body measurement traits. It can be argued that since this SNP is in the gene’s
non-coding region, it should not normally influence the protein function. How-
ever, studies have indicated that mutation on the 3’UTR region could influence
gene expression pattern. [36, 37] are examples of studies that have shown a posi-
tive influence of 3’UTR sequence mutation of gene expression pattern. Stacho-
DOI: 10.4236/abb.2020.117023 335 Advances in Bioscience and BiotechnologyR. O. Ahmed et al.
wiak et al. [37] showed that a mutation in the 3’UTR region of PPARA gene in-
fluenced transcript level of the gene, and subsequently had significant influence
of adipose tissue accumulation in pig.
4.7.3. LMF1 Polymorphism and Its Association with BMTs
All animals in both breeds investigated for the T27154C SNP were monomor-
phic and homozygous for the T-allele. Ren et al. [10] had associated this SNP
with body size in Chinese Nanyang cattle. It appears that Nigerian cattle—both
taurine and indicine—are monomorphic at the mutation site or genetic drift has
resulted in the loss of this variation. In Chinese Holstein cattle breed screened by
[10], all the animals were also monomorphic and homozygous for the T-allele at
the 27154 T > C site. Ren et al. [10] offered an explanation that C-allele of the
C > T polymorphism might only be found in meat-type cattle breeds considering
that Chinese Holstein, which is not polymorphic at the mutation site, was the
only dairy breed out of the four cattle breeds examined. It is difficult to infer the
same explanation for result of this study as Muturu and White Fulani cattle have
not been specialized. Overall, based on the findings of this study revealing lack
of polymorphism within both breeds, LMF1 exon 4 mutation cannot be asso-
ciated with growth traits in these breeds, and can therefore not be used for
marker-assisted selection. However, this conclusion is limited to the outcome of
this study; further research is needed before it can be confirmed or refuted.
5. Conclusion
In this study, we’ve showed evidence of polymorphism of SMO gene in White Fu-
lani and Muturu cattle breeds. In addition, we report that variations at G21234C,
C22424T, T22939C and T23458G loci significantly affected BMTs in both cattle
breeds. However, evidence suggests the absence of LMF1 polymorphism in the
two African cattle breeds.
Acknowledgements
I’m indebted to the Commonwealth Scholarship Commission and Aberystwyth
University who provided sponsorship for my MSc degree in Aberystwyth Uni-
versity where the research was conducted. My appreciation also goes to my Su-
pervisor, Dr Matthew Hegarty, for guiding me through the processes. I’m grate-
ful to Mr Oladiti Ridwan, Moibi Adeyemi, Adeniyi Abdul-Ganiy and Amune Je-
remiah for their assistance during the execution of the field work.
Authors Contribution
MJ Hegarty supervised the whole process. Ridwan Olawale Ahmed designed the
experiment, carried out laboratory works, did the statistical analysis. Ridwan
Olawale Ahmed and Ibrahim Shu’aibu wrote the manuscript. Semiu Folaniyi Bello
collected field data-collection of nasal swabs and morphological data from cattle.
All authors read and approved the manuscript.
DOI: 10.4236/abb.2020.117023 336 Advances in Bioscience and BiotechnologyR. O. Ahmed et al.
Conflicts of Interest
The authors declare no conflicts of interest regarding the publication of this pa-
per.
References
[1] Thornton, P.K. (2010) Livestock Production: Recent Trends, Future Prospects. Phi-
losophical Transactions of the Royal Society: Biological Sciences, 365, 2853-2867.
https://doi.org/10.1098/rstb.2010.0134
[2] Ojiako, I.A. and Olayode, G.O. (2008) Analysis of Trends in Livestock Production
in Nigeria: 1970-2005. Journal of Agriculture and Social Research, 8, 114-120.
https://www.ajol.info/index.php/jasr/article/view/2892
https://doi.org/10.4314/jasr.v8i1.2892
[3] Okunmadewa, F. (1999) Livestock Industry as a Tool for Poverty Allevation. Nige-
rian Journal of Animal Science, 2, 1-7. https://doi.org/10.4314/tjas.v2i2.49678
https://www.ajol.info/index.php/tjas/article/view/49678
[4] McMahon, A.P., Ingham, P.W. and Tabin, C.J. (2003) Developmental Roles and
Clinical Significance of Hedgehog Signaling. Current Topics in Developmental Bi-
ology, 53, 1-114. https://doi.org/10.1016/S0070-2153(03)53002-2
https://www.sciencedirect.com/science/article/abs/pii/S0070215303530022
[5] Suh, J.M., Gao, X., McKay, J., McKay, R., Salo, Z. and Graff, J.M. (2006) Hedgehog
Signaling Plays a Conserved Role in Inhibiting Fat Formation. Cell Metabolism, 3,
25-34. https://www.sciencedirect.com/science/article/pii/S1550413105003487
https://doi.org/10.1016/j.cmet.2005.11.012
[6] Zhang, Y.R., Gui, L.S., Li, Y.K., Jiang, B.J., Wang, H.C., Zhang, Y.Y. and Zan, L.S.
(2015) Molecular Characterization of Bovine SMO Gene and Effects of Its Genetic
Variations on Body Size Traits in Qinchuan Cattle (Bostaurus). International Jour-
nal of Molecular Sciences, 16, 16966-16980. https://doi.org/10.3390/ijms160816966
https://www.mdpi.com/1422-0067/16/8/16966/htm
[7] Zhang, Y.R., Li, Y.K., Fu, C.Z., Wang, J.L., Wang, H.B. and Zan, L.S. (2014) Effects
of Bovine SMO Gene Polymorphisms on the Body Measurement and Meat Quality
Traits of Qinchuan Cattle. Genetics and Molecular Research, 13, 8105-8117.
https://pdfs.semanticscholar.org/d208/5e7e7f631e948fd0e7eadcc35d8f7816e4c9.pdf
https://doi.org/10.4238/2014.October.7.5
[8] Paterniti, J.R., Brown, W.V., Ginsberg, H.N. and Artzt, K. (1983) Combined Lipase
Deficiency (cld): A Lethal Mutation on Chromosome 17 of the Mouse. Science, 221,
167-169. https://science.sciencemag.org/content/221/4606/167
https://doi.org/10.1126/science.6857276
[9] Ben-Zeev, O., Hosseini, M., Lai, C.M., Ehrhardt, N., Wong, H., Cefalù, A.B., Péterfy,
M., et al. (2011) Lipase Maturation Factor 1 Is Required for Endothelial Lipase Ac-
tivity. Journal of Lipid Research, 52, 1162-1169.
https://www.jlr.org/content/52/6/1162.short
https://doi.org/10.1194/jlr.M011155
[10] Ren, G., Liu, J.X., Li, F., Lan, X.Y., Li, M.J., Zhang, Z.Y. and Chen, H. (2011) A
Novel Missense Mutation of Bovine Lipase Maturation Factor 1 (LMF1) Gene and
Its Association with Growth Traits. African Journal of Biotechnology, 10, 7562-
7566. https://www.ajol.info/index.php/ajb/article/view/94814
[11] Young, S.G. and Zechner, R. (2013) Biochemistry and Pathophysiology of Intravas-
cular and Intracellular Lipolysis. Genes & Development, 27, 459-484.
DOI: 10.4236/abb.2020.117023 337 Advances in Bioscience and BiotechnologyR. O. Ahmed et al.
http://genesdev.cshlp.org/content/27/5/459.short
https://doi.org/10.1101/gad.209296.112
[12] Doolittle, M.H. and Péterfy, M. (2010) Mechanisms of Lipase Maturation. Clinical
Lipidology, 5, 117-130. https://doi.org/10.2217/clp.09.84
[13] Péterfy, M., Ben-Zeev, O., Mao, H.Z., Weissglas-Volkov, D., Aouizerat, B.E., Pul-
linger, C.R., Pajukanta, P., et al. (2007) Mutations in LMF1 Cause Combined Lipase
Deficiency and Severe Hypertriglyceridemia. Nature Genetics, 39, 1483.
https://www.nature.com/articles/ng.2007.24
https://doi.org/10.1038/ng.2007.24
[14] Ben-Zeev, O., Doolittle, M.H., Davis, R.C., Elovson, J. and Schotz, M.C. (1992) Ma-
turation of Lipoprotein Lipase. Expression of Full Catalytic Activity Requires Glu-
cose Trimming But Not Translocation to the Cis-Golgi Compartment. Journal of
Biological Chemistry, 267, 6219-6227.
https://www.jbc.org/content/267/9/6219.short
[15] Alphonsus, C., Akpa, G.N. and Barje, P.P. (2012) Comparative Evaluation of Linear
Udder and Body Conformation Traits of Bunaji and Friesian x Bunaji Cows. World
Journal of Life Science Medical Research, 2, 134-140.
https://www.ajol.info/index.php/ari/article/view/79799
[16] Maule, J.P. (1990) The Cattle of the Tropics. University of Edinburgh Centre for
Tropical Veterinary Medicine, Edinburgh.
[17] Koenen, E.P.C. and Groen, A.F. (1998) Genetic Evaluation of Body Weight of Lac-
tating Holstein Heifers Using Body Measurements and Conformation Traits. Jour-
nal of Dairy Science, 81, 1709-1713.
https://doi.org/10.3168/jds.S0022-0302(98)75738-8
https://www.sciencedirect.com/science/article/pii/S0022030298757388
[18] Ige, A.O., Adedeji, T.A., Ojedapo, L.O., Obafemi, S.O. and Ariyo, O.O. (2015) Li-
near Body Measurement Relationship in White Fulani Cattle in Derived Savannah
Zone of Nigeria. Journal of Biological Agriculture Healthcare, 5, 1-6.
https://pdfs.semanticscholar.org/4360/0d580020440e179cc7759635c7ce8bbf60b0.pdf
[19] Dim, N.I., Egahi, J.O. and Tanko, M.U. (2012) Zoometrical Measurements of Body
Parts and Their Relationship with Live Weight in Bunaji Cows in Zaria, Nigeria.
International Journal of Advanced Biological Research, 2, 339-341.
http://scienceandnature.org/IJABR_Vol2(2)2012/IJABR_V2(2)27.pdf
[20] Daikwo, S.I., Ogah, D.M., Amuda, A.J. and Dike, U.A. (2018) Prediction of Body
Weight of SavannaMuturu Cattle (Bosbrachyceros). Asian Journal of Research in
Animal and Veterinary Sciences, 2, 1-6.
http://journalajravs.com/index.php/AJRAVS/article/view/293
[21] Gilbert, R.P., Bailey, D.R. and Shannon, N.H. (1993) Linear Body Measurements of
Cattle before and after 20 Years of Selection for Postweaning Gain When Fed Two
Different Diets. Journal of Animal Science, 71, 1712-1720.
https://academic.oup.com/jas/article-abstract/71/7/1712/4632342
https://doi.org/10.2527/1993.7171712x
[22] Kearse, M., Moir, R., Wilson, A., Stones-Havas, S., Cheung, M., Sturrock, S., Thier-
er, T., et al. (2012) Geneious Basic: An Integrated and Extendable desktop Software
Platform for the Organization and Analysis of Sequence Data. Bioinformatics, 28,
1647-1649. https://academic.oup.com/bioinformatics/article/28/12/1647/267326
https://doi.org/10.1093/bioinformatics/bts199
[23] Berge, S. (1977) On the Estimation of Weight and Increase of Weight by Means of
the Chest Girth in Norwegian Red Cattle at the Agricultural University at Ås, Nor-
DOI: 10.4236/abb.2020.117023 338 Advances in Bioscience and BiotechnologyR. O. Ahmed et al.
way in the Years 1972 and 1974. Acta Agriculturae Scandinavica, 27, 65-66.
https://www.tandfonline.com/doi/abs/10.1080/00015127709435110?journalCode=sa
ga19
https://doi.org/10.1080/00015127709435110
[24] Hoste, C.H., Chalon, E., d’leteren, G. and Trail, J.C.M. (1992) Trypanotolerant Li-
vestock in West & Central Africa (Vol. 3). International Livestock Centre for Africa,
Addis Ababa.
[25] Tawah, C.L. and Rege, J.E.O. (1996) White Fulani Cattle of West and Central Afri-
ca. Animal Genetic Resources, 17, 127-145.
https://doi.org/10.1017/S101423390000064X
https://www.cambridge.org/core/journals/animal-genetic-resources-resources-genetiq
ues-animales-recursos-geneticos-animales/article/white-fulani-cattle-of-west-and-cen
tral-africa/E6A2FE9D075EA71FE823E9011F97A1A1
[26] Oduguwa, B.O., Adedeji, A.A., Sowande, S.O., Isah, O.A. and Amole, T.A. (2013)
Estimation of Live Weight from Linear Body Measurements of Three African
Breeds of Cattle under Extensive Management System in Nigeria. Nigerian Journal
of Animal Science, 15, 1-9. https://www.ajol.info/index.php/tjas/article/view/94026
[27] Bene, S., Nagy, B., Nagy, L., Kiss, B.A., Polgar, J.P. and Szabo, F. (2007) Comparison
of Body Measurements of Beef Cows of Different Breeds. Archives Animal Breed-
ing, 50, 363-373. https://d-nb.info/1148700862/34
https://doi.org/10.5194/aab-50-363-2007
[28] Udeh, I., Akporhuarho, P.O. and Onogbe, C.O. (2011) Phenotypic Correlations
among Body Measurements and Physiological Parameters in Muturu and Zebu Cat-
tle. Journal of Agricultural and Biological Science, 6, 1-4.
https://www.cabdirect.org/cabdirect/abstract/20113231829
[29] Liu, Q., Dou, S., Ji, Z. and Xue, Q. (2005) Synonymous Codon Usage and Gene
Function Are Strongly Related in Oryzasativa. Biosystems, 80, 123-131.
https://www.sciencedirect.com/science/article/pii/S0303264704002114
https://doi.org/10.1016/j.biosystems.2004.10.008
[30] Kimchi-Sarfaty, C., Oh, J.M., Kim, I.W., Sauna, Z.E., Calcagno, A.M., Ambudkar,
S.V. and Gottesman, M.M. (2007) A “Silent” Polymorphism in the MDR1 Gene
Changes Substrate Specificity. Science, 315, 525-528.
https://science.sciencemag.org/content/315/5811/525/tab-pdf
https://doi.org/10.1126/science.1135308
[31] Glisovic, T., Bachorik, J.L., Yong, J. and Dreyfuss, G. (2008) RNA-Binding Proteins
and Post-Transcriptional Gene Regulation. FEBS Letters, 582, 1977-1986.
https://doi.org/10.1016/j.febslet.2008.03.004
[32] Shabalina, S.A., Spiridonov, N.A. and Kashina, A. (2013) Sounds of Silence: Syn-
onymous Nucleotides as a Key to Biological Regulation and Complexity. Nucleic
Acids Research, 41, 2073-2094. https://doi.org/10.1093/nar/gks1205
https://academic.oup.com/nar/article/41/4/2073/2414416
[33] Shilpi, A., Bi, Y., Jung, S., Patra, S.K. and Davuluri, R.V. (2017) Identification of
Genetic and Epigenetic Variants Associated with Breast Cancer Prognosis by Inte-
grative Bioinformatics Analysis. Cancer Informatics, 16, CIN-S39783.
https://journals.sagepub.com/doi/pdf/10.4137/CIN.S39783
https://doi.org/10.4137/CIN.S39783
[34] Apionishev, S., Katanayeva, N.M., Marks, S.A., Kalderon, D. and Tomlinson, A.
(2005) Drosophila Smoothened Phosphorylation Sites Essential for Hedgehog Sig-
nal Transduction. Nature Cell Biology, 7, 86.
https://www.nature.com/articles/ncb1210.pdf
DOI: 10.4236/abb.2020.117023 339 Advances in Bioscience and BiotechnologyR. O. Ahmed et al.
https://doi.org/10.1038/ncb1210
[35] Rischkowsky, B. and Pilling, D. (2007) Genetic Improvement Methods to Support
Sustainable Utilization. Section D. In: The State of the World’s Genetic Resources
for Food and Agriculture, FAO, Rome, 380-422.
http://www.fao.org/docrep/010/a1250e/a1250e00.htm
[36] Clop, A., Marcq, F., Takeda, H., Pirottin, D., Tordoir, X., Bibé, B., Larzul, C., et al.
(2006) A Mutation Creating a Potential Illegitimate microRNA Target Site in the
Myostatin Gene Affects Muscularity in Sheep. Nature Genetics, 38, 813.
https://www.nature.com/articles/ng1810.pdf
https://doi.org/10.1038/ng1810
[37] Stachowiak, M., Szydlowski, M., Flisikowski, K., Flisikowska, T., Bartz, M., Schnieke,
A. and Switonski, M. (2014) Polymorphism in 3’ Untranslated Region of the Pig
PPARA Gene Influences Its Transcript Level and Is Associated with Adipose Tissue
Accumulation. Journal of Animal Science, 92, 2363-2371.
https://academic.oup.com/jas/article/92/6/2363/4701500
https://doi.org/10.2527/jas.2013-7509
DOI: 10.4236/abb.2020.117023 340 Advances in Bioscience and BiotechnologyR. O. Ahmed et al.
Supplementary Data
Table S1. Association of C22424T SNP genotypes of SMO exon 11 gene with body mea-
surement traits in White Fulani and Muturu cattle.
Traits Genotype
Breed P-value
(means in cm ± SE) CC CT
WF (37) BL 133.44 ± 0.83 134.51 ± 1.47 0.533
a b
HG 175.00 ± 0.98 179.12 ± 1.74 0.047
WH 145.36a ± 0.87 149.85b ± 1.54 0.016
RL 51.78a ± 0.78 55.47b ± 1.37 0.025
a b
CD 73.12 ± 0.94 78.06 ± 1.65 0.013
a b
Mut (39) BL 101.98 ± 0.51 104.45 ± 0.94 0.026
HG 128.27 ± 0.48 129.21 ± 0.88 0.349
WH 83.38 ± 0.43 84.12 ± 0.78 0.414
RL 36.91 ± 0.31 37.77 ± 0.56 0.190
a b
CD 55.48 ± 0.25 56.80 ± 0.45 0.015
ab
Means with different superscript within rows are significantly different (p < 0.05). WF, White Fulani; Mut,
Muturu; BL, Body Length; HG, Heart Girth; WH, Wither Height; RL, Rump Length; CD, Chest Depth.
Table S2. Association of C22481T SNP genotypes of SMO exon 11 gene with body mea-
surement traits in White Fulani cattle.
Traits Genotype
Breed P-value
(means in cm ± SE) CC CT
WF (37) BL 133.93 ± 0.78 132.24 ± 1.97 0.429
HG 176.07 ± 0.96 174.44 ± 2.42 0.535
WH 146.41 ± 0.87 146.96 ± 2.25 0.823
RL 52.60 ± 0.78 52.70 ± 1.98 0.964
CD 74.29 ± 0.96 73.84 ± 2.43 0.863
All means within the same row are not significantly different (P > 0.05). WF, White Fulani; BL, Body
length; HG, Heart girth; WH, Wither height; RL, Rump length; CD, Chest depth.
Table S3. Association of T22939C SNP genotypes of SMO exon 12 gene with body mea-
surement traits in White Fulani and Muturu cattle.
Traits Genotype
Breed P-value
(means in cm ± SE) CC CT TT
WF (37) BL 131.86a ± 0.72 135.78b ± 1.18 133.24ab ± 3.34 0.031
HG 174.04 ± 0.90 176.54 ± 1.46 182.66 ± 4.12 0.076
WH 144.67a ± 0.86 149.23b ± 1.40 147.56ab ± 3.94 0.031
RL 51.40 ± 0.57 53.13 ± 0.92 49.78 ± 2.59 0.221
CD 72.58 ± 0.88 76.53 ± 1.43 79.24 ± 4.04 0.096
DOI: 10.4236/abb.2020.117023 341 Advances in Bioscience and BiotechnologyR. O. Ahmed et al.
Continued
Mut (39) BL 98.60a ± 0.65 102.78b ± 0.58 104.81c ± 0.69 < 0.001
a b c
HG 125.55 ± 0.52 127.85 ± 0.47 131.98 ± 0.56 < 0.001
a b c
WH 81.57 ± 0.59 83.47 ± 0.53 85.79 ± 0.63 < 0.001
a a b
RL 35.98 ± 0.38 36.94 ± 0.34 38.33 ± 0.47 0.001
CD 54.88 ± 0.49 55.83 ± 0.44 56.68 ± 0.53 0.064
abc
Means with different superscript within rows are significantly different (p < 0.05 or 0.001). WF, White
Fulani; Mut, Muturu; BL, Body length; HG, Heart girth; WH, Wither height; RL, Rump length; CD, Chest
depth.
Table S4. Association of C23329T SNP genotypes of SMO 3’UTR region with body mea-
surement traits in White Fulani and Muturu cattle.
Traits Genotype
Breed P-value
(means in cm ± SE) CC CT TT
WF (39) BL 134.02 ± 0.73 130.46 ± 2.12 126.80 ± 4.24 0.094
HG 176.23 ± 0.92 173.07 ± 2.68 172.45a ± 5.35 0.445
WH 147.12 ± 0.84 143.24 ± 2.45 145.70 ± 4.89 0.330
RL 52.78 ± 0.74 50.77 ± 2.16 55.10 ± 4.31 0.578
CD 74.25 ± 0.91 72.71 ± 2.65 78.55 ± 5.29 0.612
Mut (37) BL 102.79 ± 0.59 100.60 ± 1.32 102.28 ± 2.96 0.319
HG 128.89 ± 0.46 126.44 ± 1.15 125.70 ± 2.76 0.095
WH 83.80 ± 0.40 82.43 ± 0.99 81.36 ± 2.22 0.283
RL 37.17 ± 0.24 36.56 ± 0.60 36.50 ± 1.33 0.591
CD 54.91 ± 0.26 55.18 ± 0.64 55.12 ± 1.44 0.522
All means within the same row are not significantly different (p > 0.05). WF, White Fulani; Mut, Muturu;
BL, Body length; HG, Heart girth; WH, Wither height; RL, Rump length; CD, Chest depth.
Table S5. Association of T23458G SNP genotypes of SMO 3’UTR region with body mea-
surement traits in White Fulani and Muturu cattle.
Traits Genotype
Breed P-value
(means in cm ± SE) TT TG GG
WF (38) BL 135.67a ± 1.03 134.67a ± 0.99 129.81b ± 1.12 0.001
HG 177.42 ± 1.43 176.77 ± 1.38 172.71 ± 1.55 0.07
a a b
WH 147.75 ± 1.26 148.53 ± 1.21 143.27 ± 1.39 0.017
RL 53.57 ± 1.20 53.06 ± 1.15 51.20 ± 1.30 0.352
CD 75.46 ± 1.41 75.30 ± 1.35 71.22 ± 1.53 0.086
a b b
Mut (35) BL 104.65 ± 0.61 102.19 ± 0.66 100.37 ± 0.76 < 0.001
a b c
HG 130.28 ± 0.59 128.38 ± 0.64 126.33 ± 0.74 0.001
WH 85.07a ± 0.52 83.01b ± 0.56 81.90b ± 0.64 0.001
RL 37.81a ± 0.31 37.13a ± 0.34 36.04b ± 0.30 0.005
CD 56.26 ± 0.38 55.83 ± 0.41 55.15 ± 0.47 0.195
abc
Means with different superscript within rows are significantly different (p < 0.05 or 0.001). WF, White
Fulani; Mut, Muturu; BL, Body length; HG, Heart girth; WH, Wither height; RL, Rump length; CD, Chest
depth.
DOI: 10.4236/abb.2020.117023 342 Advances in Bioscience and BiotechnologyYou can also read