Genetic analysis of multiple fruit quality traits in mango across sites and years
←
→
Page content transcription
If your browser does not render page correctly, please read the page content below
Euphytica (2021)217:44
https://doi.org/10.1007/s10681-020-02750-3   (0123456789().,-volV)
                                                                 ( 01234567
                                                                         89().,-volV)

Genetic analysis of multiple fruit quality traits in mango
across sites and years
Ian S. E. Bally      . Joanne De Faveri

Received: 8 August 2020 / Accepted: 9 December 2020
Ó Crown 2021

Abstract A key strategy to improve fruit quality and                                    Introduction
consumer appeal in mangoes is to breed trait improve-
ments into new cultivars. There are several key fruit                                   The global production of mangoes is approximately
quality traits in mango. Knowledge of the heritability                                  43.3 Million metric tons produced from 105 countries
and relationship among these traits is important for                                    (Galan Saco 2017). Australian mango production is
breeding success. This paper implements a linear                                        less than 0.2% of global production with approxi-
mixed model analysis including paternal information                                     mately 61,474 tonnes produced annually, with a gross
for analysis of 13 important fruit quality traits from                                  value of production (GVP) of $195 million. Mangoes
mango cultivars planted across three environments                                       are grown across the tropical and subtropical regions
and assessed over several seasons. The traits analysed                                  of Queensland, the Northern Territory and Western
were average fruit weight, skin background colour,                                      Australia. 89% of all Australian production is sold and
blush colour, percentage blush, blush intensity, skin                                   consumed domestically, with 83% sold as fresh fruit
thickness, beak shape, stem-end shape, deformities,                                     and 6% as processed (Horticulture Innovation Aus-
mesocarp colour, mesocarp texture, seed width and                                       tralia 2018).
mesocarp recovery. The analysis allows investigation                                       Genetic improvement of crops through breeding is
into trait heritabilities and stability of traits over years                            a key strategy for delivery of sustainable improvement
and sites, as well as genetic correlations among traits.                                in production efficiency and product quality. Many
                                                                                        improved cultivars arise from breeding programs in
Keywords BLUP  Heritability  Fruit quality traits                                    India, USA, Israel, Brazil, Australia and South Africa
Genetic correlation                                                                     (Bally and Dillon 2018; Iyer and Schnell 2009). Most
                                                                                        of these programs aim to improve tree productivity,
                                                                                        tree architecture and fruit quality such as fruit size,
                                                                                        colour and flavour (Iyer and Schnell 2009; Bally and
                                                                                        Dillon 2018). The ease of vegetative reproduction in
                                                                                        mango allows the efficient capture and exploitation of
                                                                                        genetic gain at any stage of a hybridisation program.
                                                                                           In Australia several factors have been identified as
                                                                                        limiting mango industry growth, including the appeal
I. S. E. Bally (&)  J. De Faveri
Queensland Department of Agriculture and Fisheries,
                                                                                        of mangoes to consumers (fruit colour, flavour, aroma
PO Box 1054, Mareeba, QLD 4880, Australia                                               and mesocarp texture), seasonality of fruit, limited
e-mail: Ian.bally@daf.qld.gov.au

                                                                                                                                    123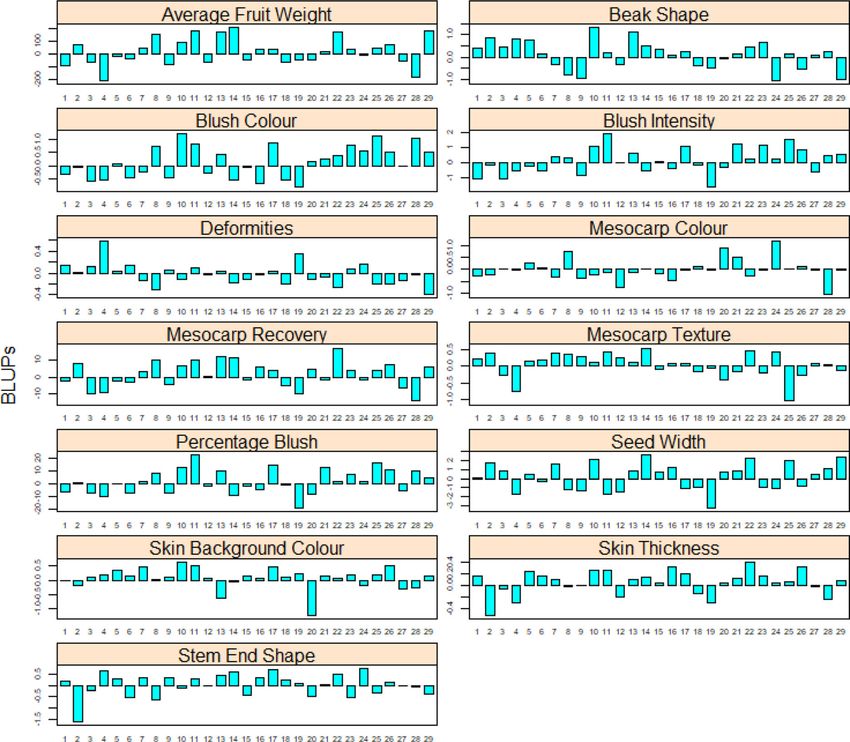
44   Page 2 of 18                                                             Euphytica (2021)217:44

productive capacity of some cultivars, low first grade       covariance structure over sites and years. The analysis
pack-out and access to new cultivars and orchard             provides predictions of breeding values (BLUPs) and
systems (Horticulture Innovation Australia 2017;             narrow sense heritabilities for each trait and allows
AMIA 2014).                                                  investigation into genotype by environment interac-
   The breeding objectives of the Australian Mango           tion. The analysis also provides insight into the genetic
Breeding Program are aligned with industry needs and         correlation among traits. A similar mixed model
include improvement of tree productivity, architec-          approach was implemented in the univariate analysis
ture, disease resistance and fruit quality traits of fruit   of mango fruit weight (Hardner et al. 2012).
size, colour and flavour (Kulkarni et al. 2002; Bally
et al. 2017, 2013; Bally 2008).
   To achieve these objectives the Australian Mango          Methods
Breeding Program is combining genetic traits of
different cultivars through controlled hand pollination      Genetic material and trial environments
techniques to generate new hybrid progeny. Accurate
parental identification and evaluation of progeny’s          The trees evaluated in this study consisted of 1719
phenotypic performance across a range of environ-            hybrids (progeny) from 39 families, generated by
ments has enabled analyses of multiple fruit traits for      crossing 29 parents in a sparse design (Hardner et al.
their heritabilities, breeding values and correlation        2012). Hybrids were generated using hand pollination
among traits (Bally et al. 2009b; Hardner et al. 2012).      techniques (Bally et al. 2009a). Hybrid progeny were
These genetic relationships are useful to guide the          planted at three sites across Northern Australia, at
selection of suitable next generation parents from the       Coastal Plains Horticultural Research Farm, Darwin in
families represented in the breeding program.                the Northern Territory (NT), at Southedge Research
   The optimal selection of future parents to maximize       Station, Mareeba, in Queensland (QLD) and at Frank
progress in desirable traits is a key factor in any          Wise Institute, Kununurra in Western Australia (WA).
breeding program. Evaluating the breeding value or           Hybrid seedlings were planted in the NT while
additive genetic effect for a cultivar for a given trait     budwood from these seedlings was grafted on to
gives the expected average performance of progeny            Kensington Pride rootstock and planted in QLD and
derived from crosses using this cultivar as a parent         WA. Families with between one to 138 progeny were
(Falconer and Mackay 1996). By selecting potential           analysed (Table 1).
parents based on their breeding values for a key trait,         Subsets of hybrid progeny were assessed at the 3
the resulting progeny are likely to have improved            locations over 6 years (QLD: 1999 to 2005; NT: 2000
values of this trait.                                        to 2002 and 2004; WA: 2000 to 2005). Individual
   The heritability of a trait represents the proportion     progeny were assessed, in at least 2 of the 6 years,
of variation in the phenotype that is due to genetic         resulting in an unbalanced sampling method (Table 2).
factors, with the narrow sense heritability being the
proportion of phenotypic variance that can be                Fruit quality traits
attributed to additive genetic variance. The narrow
sense heritability is important in plant breeding as it      Thirteen fruit quality traits were assessed on each
determines the amount of progress that can be made by        hybrid progeny, including five traits with continuous
selecting and crossing the best individuals in a             rating scales and eight traits with ordered categorical
population (Bernardo 2010). Traits with higher narrow        rating scales with four or more categories (Table 3).
sense heritability are likely to provide greater response    Each trait is described below.
to selection.
   This paper presents a statistical genetic analysis of     Average fruit weight
multi-site, multi-year data from multiple key traits
from the Australian Mango Breeding Program. The              The average fruit weight per tree was calculated from
analysis approach is based on linear mixed models            five fruit harvested from each tree at full maturity and
including pedigree information and factor analytic           weighed at the eating ripe stage. Average fruit weight
models (Smith et al. 2001) for determining the genetic       data were analysed as continuous quantitative data.

123
Euphytica (2021)217:44                                                                         Page 3 of 18   44

Table 1 Parents and the number of progeny per family assessed across the 3 locations (Mareeba, Darwin and Kununurra). Numbers
in brackets after parent names are the numerical identification of the parents used in Fig. 2
Female parent       Male parent
                    Banana callow    Hybrid 10      Kensington pride   Nam doc mai       R2E2        Sensation     Tommy Atkins
                    (3)              (8)            (16)               (19)              (22)        (23)          (25)

Alphonso (1)                                                                             110
Apple (2)                            138            124
Creeper (4)                                           1
Edward (5)                                            3
Early Gold (6)                        33             51
Glenn (7)           9                                51
Hybrid 17 (9)                                        83                                                            1
Haden (10)                            50            117                83                  4                       2
Irwin (11)                                            3
Julie (12)                                          102
Keitt (13)                                           44                                              3
Kent (14)                                                                                  2         1
Kensington Mono                                      76
 (15)
Kensington Pride                                     14
 (16)
Lippens (17)                                          1
Magovar (18)                                                                                         1
Nam Doc Mai                           68             67
 (19)
Padiri (20)                                          21
Palmer (21)                           12             58
Suvarnareka (24)                                    100
Tommy Atkins                                         55
 (25)
Van Dyke (26)                                         2
Vellai Columban                                      78                                  115
 (27)
Willard (28)        3                                 3
Zill (29)                                            41

Table 2 The number of             Assessment year         Queensland        Northern Territory        Western Australia    Total
hybrid progeny assessed
each year at each location        1999–00                  356                 0                          0                 356
used in the analyses
                                  2000–01                  417               199                         82                 698
                                  2001–02                  590               243                      112                   945
                                  2002–03                  445               562                       94                  1101
                                  2003–04                  322                 0                      108                   430
                                  2004–05                  470               637                      170                  1277
                                  Total                   2600              1641                      566                  4807

                                                                                                                          123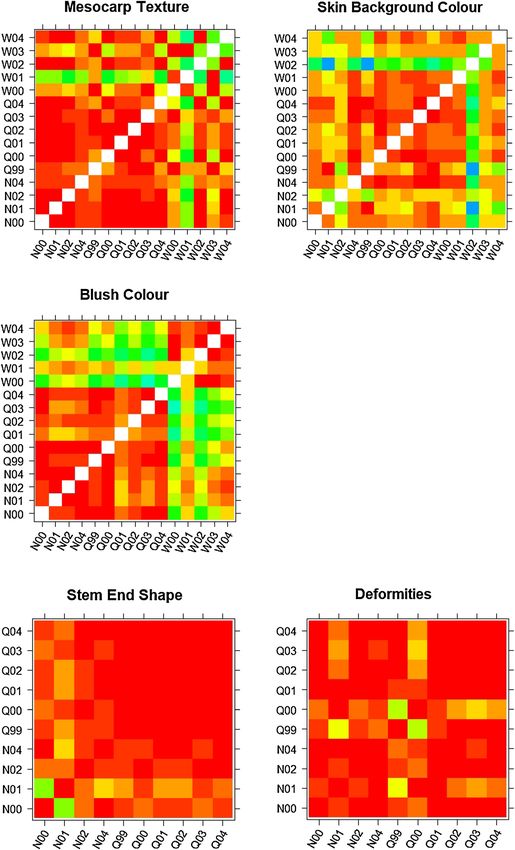
44   Page 4 of 18                                                                   Euphytica (2021)217:44

Table 3 Thirteen fruit quality traits that were analysed, rating   Percent blush coverage
scales and rating levels. Five traits with continuous rating
scales and eight traits with ordered categorical rating scales
                                                                   The percentage of fruit skin covered with blush was
Description                  Scale           Unit/Rating levels    assessed by visually estimating the percentage of
                                                                   blush separately on both sides of the fruit at eating ripe
Average fruit weight         Continuous      grams
                                                                   stage and taking the average. The percentage blush
Skin background colour       Categorical     4
                                                                   was analysed as continuous quantitative data with
Blush colour                 Categorical     4
                                                                   higher percentages preferable.
Percentage blush             Continuous      %
Blush intensity              Categorical     5
                                                                   Bush intensity
Skin thickness               Continuous      mm
Beak shape                   Categorical     5
                                                                   The blush colour on the fruit skin can vary not only by
Stem-end shape               Categorical     5                     the amount of skin covered, but also by the intensity of
Deformities                  Categorical     4                     the blush colour. The more intense the blush colour the
Mesocarp colour              Categorical     5                     more it completely covers the underlying ground
Mesocarp texture             Categorical     5                     colour of the fruit. Blush intensity was scored as an
Seed width                   Continuous      mm                    ordered categorical rating in order of most to least
Mesocarp recovery            Continuous      mm                    desirable as: medium intensity similar to the cultivar
                                                                   ‘Haden’, slight intensity, similar to the cultivar
                                                                   ‘Kensington Pride’, solid intensity, similar to the
                                                                   cultivar ‘Tommy Atkins’, barely visible, or no blush.
Skin background colour                                             Blush intensity data from Western Australia was not
                                                                   included in the multi-trait analyses.
The skin ground colour is the underlying green/
yellow/ orange colour of the fruit skin at eating ripe.            Skin thickness
This colour does not include the blush colour of the
fruit. The skin ground colour transitions from green to            The thickness of mango fruit skin influences the total
yellow as the fruit ripen and chlorophyll is lost from             mesocarp (flesh) recovery of the fruit and how easy it
the fruit skin (Medlicott et al. 1986). Skin ground                is to peel the skin from the fruit. Skin thickness was
colour was categorised according to the predominant                measured in mm at the eating ripe stage using a digital
colour of the un-blushed skin at eating ripe and                   calliper. Skin thickness was calculated as the average
analysed in order of most to least desirable as either             skin thickness of five measurements taken randomly
yellow, orange, green/yellow, or green. Some cultivars             around the longitudinal circumference after removing
do not de-green fully during ripening resulting in an              the fruit cheek from the seed on each of the five fruit in
undesirable blotchy green, yellow appearance.                      the sample.

Blush colour                                                       Beak shape

Mango fruit blush colours range from orange, through               The shape of mango fruit vary from round to elongate
pink, to red and purple from anthocyanin pigments                  and with fruit colour are the most recognisable
that result from the activation of cyanidin-O-galac-               features of a mango cultivar for consumers. The beak
toside synthesis stimulated by direct exposure to                  shape describes the amount the stylar end of the fruit
sunlight (Berardini et al. 2005a). Mango fruit blush               protrudes and is a significant component of fruit shape.
colour was rated on an ordered categorical scale, in               Beak shape was scored in ripe fruit, in an ordered
order of most to least desirable, as burgundy, red, pink           categorical rating scale, in order of most to least
or orange.                                                         desirable, as absent, very slight, slight, medium, or
                                                                   prominent. Beak shape data from Western Australia
                                                                   was not included in the multi-trait analyses.

123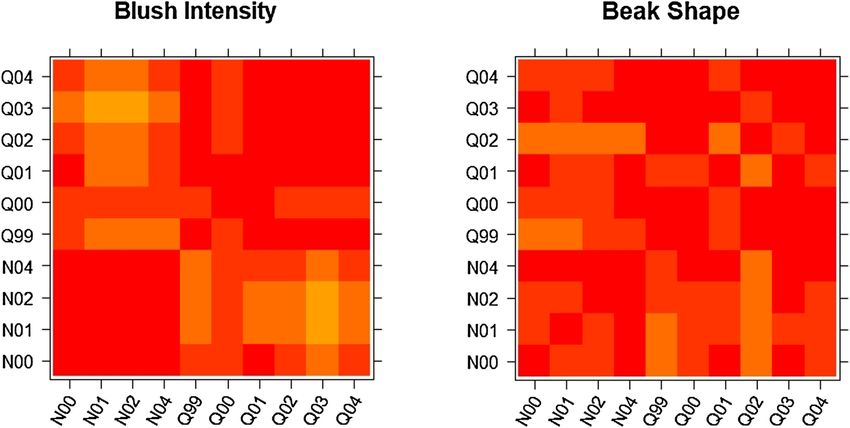
Euphytica (2021)217:44                                                               Page 5 of 18   44

Stem-end shape                                              Seed width

The stem-end shape of a mango fruit influences the          Seed width refers to the width of the seed and leathery
shape of the fruit and the amount of detritus material      endocarp, often referred to as the stone. Seeds
and moisture that accumulates externally at the stem        (embryos enclosed in their leathery endocarp) were
end of the fruit during growth. Depressed stem-ends         extracted from the ripe fruit samples, measured with
accumulate more material that can blemish the fruit         digital callipers in mm and analysed as continuous
and cause a degrading of fruit quality. Stem-end shape      quantitative data. Thinner seeds are seen as more
was scored an ordered categorical rating scale, in order    desirable as they increase mesocarp recovery.
of most to least desirable, as level, slightly depressed,
slightly raised or highly depressed. Stem-end shape         Mesocarp recovery
data from Western Australia was not included in the
multi-trait analyses.                                       The mesocarp (flesh) recovery refers to the percentage
                                                            of edible mesocarp that can be extracted from the fruit.
Deformities                                                 Higher percentages of mesocarp recovery are pre-
                                                            ferred. Mesocarp recovery was calculated by subtract-
Fruit deformities appear as lumps on the fruit or as        ing the seed and skin weight from the fruit weight and
misshapen fruit which are unmarketable. Fruit defor-        expressing it as a percentage of the fruit weight as
mities were rated on an ordered categorical scale, with     follows:
lower valued preferred as either, none, slight, medium                         ðFruitweight  ðSeed þ SkinweightÞÞ
or many.                                                    Flesh recovery ¼                                        100
                                                                                           Fruitweight

Mesocarp colour
                                                            Statistical methods
The colour of the fruit mesocarp (flesh) ranges from
pale yellow green to dark orange in ripe fruit. Both        Prior to analysis, each of the categorical variables
carotenoids and anthocyanins contribute to the inten-       were transformed to a numerical rating scale with
sity of the mesocarp colour (Proctor and Creasy 1969;       higher ratings associated with more desirable fruit.
Pott et al. 2003). Mesocarp colour was scored, in order     Then all traits were analysed individually across sites
of most to least desirable, on a one to five ordered        and years using a multi-environment (MET) multi-
categorical scale using colour patch cards (The Royal       harvest analysis (Hardner et al. 2012; De Faveri 2013)
Horticultural Society 2001) as either orange group          using linear mixed models incorporating factor ana-
24A, yellow orange group 32A, yellow group 15A,             lytic models (Smith et al. 2001; Meyer 2007) and
yellow group 13 B, or yellow group 6A.                      pedigree information. The models were fitted using
                                                            ASReml-R (Butler et al. 2009). Residuals were
Mesocarp texture                                            investigated and assessed to meet the assumptions
                                                            for analysis.
Mesocarp texture refers to the firmness and fibre              The aim of the linear mixed model analysis was to
associated with the fruit mesocarp. Firm, low fibre         predict additive genetic effects (BLUPs) for each
textures are preferable to soft fibrous textures. Meso-     cultivar for each trait and genetic and residual variance
carp texture was scored, in order of most to least          components for estimation of genetic correlations and
desirable, using an ordered categorical rating scale        narrow sense heritabilities for each trait across harvest
based on commonly known cultivars as either soft or         seasons within trials. The linear mixed model used for
no fibre (c.v. ‘Nam Doc Mai’), soft and low fibre (c.v.     analysis of each trait was of the form:
‘Kensington Pride’) firm and medium fibre (c.v.
‘R2E20 ), firm and stringy (c.v. ‘Tommy Atkins’) and        y ¼ Xs þ Zo uo þ Zg ug þ Zf uf þ e
soft and stringy (c.v. ‘Common’).                           where y is the vector of observations, fixed effects are
                                                            given by Xs, random (non-genetic) effects are given

                                                                                                             123
44 Page 6 of 18 Euphytica (2021)217:44
by Z o uo , the random additive genetic effects by Z g ug , year combinations) was estimated for each trait to
random family effects by Z f uf and the residual effects investigate the stability of traits across sites and years.
by e. It is assumed that e is normally distributed with Heat maps were constructed to visualise these genetic
zero mean and covariance matrix R. correlations and to assist in interpretation of the
The additive genetic effects ug are assumed to be covariance matrices from the factor analytic models
normally distributed and have mean zero and are (De Faveri et al. 2015; Cullis et al. 2010).
independent of other random effects. The multi- Variance components from the model were used to
site/multi-year model used in this paper treats the site estimate the narrow sense heritability for each trait for
by year combinations as a single component. It is each year by trial combination using the following
assumed that the variance matrix of ug is given by: formula:
var ug ¼ Gs A r^2a
h^2 ¼
r^2a þ r^2f þ r^2e
where Gs is the genetic covariance matrix for the site
by year combinations, is the Kronecker product, and where b r 2a was the estimated additive genetic variance,
A is the additive relationship matrix as determined by r 2f was the estimated family variance and b
b r 2e was the
the pedigree. estimated residual variance for the trait at a particular
The random additive genetic effects were corre- year within a trial.
lated across sites and years and BLUPs calculated for Breeding values (random additive genetic effects)
each cultivar across sites and years. The genetic were predicted for each line for all years and trials for
covariance matrix Gs consisting of genetic variances each trait separately. A principal component analysis
for each site by year and genetic covariances between was performed and biplot constructed on the trait by
site by year combinations was modelled using factor cultivar BLUPs (predicted over sites and years) to
analytic models (Smith et al. 2001). The factor investigate the relationships among multiple traits and
analytic model provides a parsimonious approxima- represented in a biplot (Fig. 4), generated using the
tion to the fully unstructured covariance model (Kelly statistical package R (R Core Team 2015).
et al. 2007). The order of factor analytic model
required for each trait was determined using REML
likelihood ratio tests (REMLRT). Results
In multi-environment trials the full residual covari-
ance matrix R is typically given by a block diagonal The mean and standard errors based on the raw data for
matrix where Rj is the residual variance matrix for the each trait by harvest within years and sites are
jth trial: presented in Table 4. It can be seen that some trait
R ¼ diag Rj means differed across sites, for example average fruit
weight was consistently higher in QLD than WA or
Therefore, each trial has its own residual covari- NT. WA trials showed higher variation in average fruit
ance structure and residuals are assumed independent weight between seasons than the other sites (Table 4).
among trials. In this study the residual structure for The analyses of each trait were based on factor
each trial has been modelled using a diagonal variance analytic models for modelling the genetic effects over
matrix for each site, giving a separate residual sites and years. The order of factor analytic model
variance for each year. Spatial analyses were not (number of factors) was determined using REML
performed as at any one time only a selection of non- likelihood ratio tests. For most traits a model with two
contiguous trees were measured. Models fitting more factors (FA2) was deemed best, while for percent
structured temporal residual correlation structures blush and average fruit weight a model with three
were investigated but were not significant or unable factors (FA3) was chosen as the best model and for
to be fitted most likely because of insufficient mesocarp recovery a model with four factors (FA4)
individual trees being measured at consecutive times. was used.
The genetic covariance matrix ðGs ) (giving the
genetic variances and correlations for the 15 site by
123Euphytica (2021)217:44 Page 7 of 18 44
Table 4 Means and standard errors (se) for site by harvest year (rows) for each trait (columns)
Environment Average se Mesocarp se Blush se Mesocarp se Stem- se Deformities se
fruit colour percentage recovery end
weight shape
NT 2000–01 383.39 10.84 2.9 0.06 23.27 1.59 57.34 0.82 4.34 0.07 3.93 0.02
NT 2001–02 269.44 9.67 2.65 0.05 12.76 1.08 52.26 0.74 3.79 0.07 3.5 0.05
NT 2002–03 357.66 6.11 2.89 0.03 19.28 0.89 54.99 0.42 3.95 0.04 3.41 0.03
NT 2004–05 361.35 5.74 3.02 0.03 24.4 0.79 56.28 0.4 4.03 0.04 3.37 0.03
QLD 1999–00 431.97 9.92 2.63 0.04 36.75 1.22 60.16 0.58 4.04 0.05 3.23 0.04
QLD 2000–01 410.25 8.75 2.66 0.04 32.14 1.11 59.57 0.57 3.84 0.05 3.52 0.03
QLD 2001–02 438.76 7.63 2.63 0.04 24.65 0.87 62.06 0.49 3.74 0.05 3.13 0.03
QLD 2002–03 423.26 8.78 2.47 0.04 25.64 0.88 59.12 0.52 3.75 0.06 3.02 0.03
QLD 2003–04 425.16 8.87 2.73 0.05 22.54 1.21 62.15 0.6 4.01 0.06 2.66 0.05
QLD 2004–05 419.08 7.17 2.91 0.03 27.91 0.66 60.31 0.48 3.81 0.05 3.22 0.03
WA 2000–01 242.99 14.09 2.37 0.09 23.32 1.77 46.78 1.22 3.65 0.13 3.06 0.09
WA 2001–02 361.06 13.74 2.72 0.07 10.71 1 56.23 1.15 4.12 0.09 3.24 0.07
WA 2002–03 380.97 14.64 2.87 0.08 6.6 1.07 56.04 1.32 4.21 0.09 3.44 0.06
WA 2003–04 410.9 14 2.69 0.07 4.86 0.85 59.73 1.16 4.19 0.07 3.59 0.05
WA 2004–05 361.8 9.86 3.22 0.05 8.5 0.87 56.16 0.84 4.08 0.08 3.68 0.05
Environment Beak se Skin blush se Mesocarp se Skin se Skin se Seed se
shape intensity texture background thickness width
colour
NT 2000–01 3.6 0.1 2.61 0.09 3.21 0.07 3.6 0.04 0.9 0.03 19.09 0.2
NT 2001–02 3.35 0.08 2.29 0.08 3.31 0.08 3.51 0.05 1.27 0.03 19.15 0.19
NT 2002–03 3.88 0.05 2.29 0.05 3.47 0.05 3.55 0.03 1.01 0.02 18.97 0.11
NT 2004–05 3.97 0.04 2.83 0.04 3.67 0.05 2.89 0.05 0.93 0.01 18.61 0.1
QLD 1999–00 3.59 0.06 2.63 0.05 3.99 0.05 3.07 0.06 0.77 0.01 19.25 0.14
QLD 2000–01 3.86 0.05 2.84 0.05 3.8 0.05 3.31 0.04 0.85 0.01 19.43 0.13
QLD 2001–02 3.87 0.04 2.32 0.05 3.89 0.05 3.07 0.04 0.86 0.01 19.24 0.13
QLD 2002–03 3.52 0.06 2.23 0.05 3.13 0.07 3.37 0.04 0.71 0.01 19.08 0.14
QLD 2003–04 3.6 0.07 2.48 0.07 3.33 0.08 3.07 0.06 0.81 0.02 19.46 0.15
QLD 2004–05 3.82 0.05 2.56 0.05 3.61 0.06 3.08 0.05 0.91 0.01 19.19 0.12
WA 2000–01 3.18 0.15 2.98 0.12 3.88 0.09 3.46 0.07 1.26 0.04 19.39 0.25
WA 2001–02 3.82 0.12 2.45 0.11 3.67 0.12 2.89 0.09 0.6 0.03 21 0.26
WA 2002–03 3.77 0.12 2.13 0.13 3.66 0.13 3.19 0.08 0.46 0.02 20.57 0.26
WA 2003–04 3.82 0.11 2.32 0.12 4.17 0.09 3 0.09 0.46 0.02 19.96 0.25
WA 2004–05 3.82 0.09 2.15 0.1 3.75 0.1 3.38 0.06 0.34 0.02 19.99 0.21
NT Northern Territory, QLD Queensland, WA Western Australia
Heritabilities indicating the relative ease at transferring these traits
from parents to progeny in the Australian breeding
Heritabilities were estimated for each fruit quality trait populations. The lowest heritabilities in this study
at each site by year combination (Hardner et al. 2012) were associated with traits such as skin thickness,
(Table 5). The highest heritabilities were associated mesocarp thickness and deformities indicating the
with mesocarp recovery and average fruit weight, relative difficulty in breeding for such traits.
12344 Page 8 of 18 Euphytica (2021)217:44
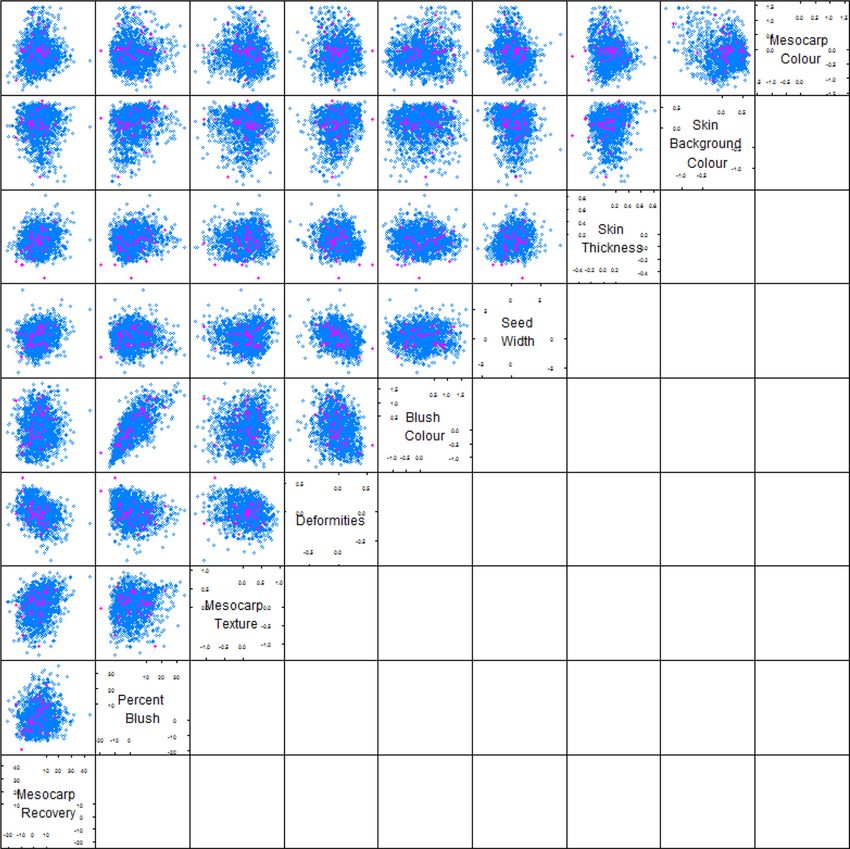
Genetic Correlations presented in Fig. 2. BLUPs are centred around zero,
so high positive BLUPs for a trait show cultivars that
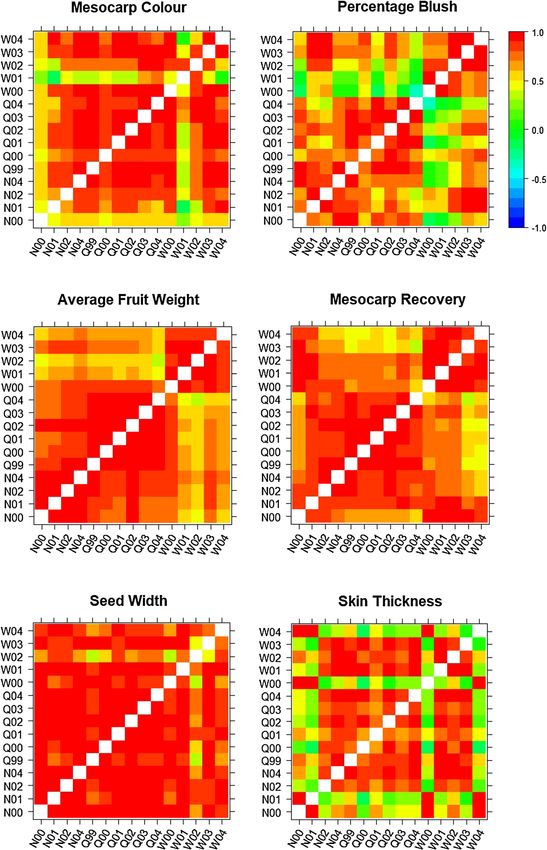
The genetic stability of traits across sites and years, are more likely to produce progeny with desirable
may be investigated in the heat maps of genetic values for that trait while high negative values will
correlations (Fig. 1), indicating how traits are influ- show cultivars that are likely to have progeny with the
enced by genetic and environment or seasonal condi- least desirable values for that trait. For example,
tions. Genetic stability data can also be an indicator of Cultivar 11 (Irwin) has the highest breeding values for
how transferable data is from one site to another and percentage blush and blush intensity while cultivar 19
helps when determining varietal performance in (Nam Doc Mai) has the lowest breeding values for
growing areas not tested. The genetic correlations these traits. cultivar 22 (R2E2) has the highest
between sites and year combinations were high for breeding value for mesocarp recovery while cultivar
most traits (with the exception of skin colour and skin 28 (Willard) has the lowest. cultivar 24 (Suvarnareka)
thickness) especially for NT and QLD, as seen by the has the highest breeding value for mesocarp colour
red blocks in each heat map (Fig. 1). while cultivar 20 (Padiri) has the lowest breeding
Seed width, average fruit weight and mesocarp value for skin background colour.
recovery showed high stability, while skin colour The BLUPs for each trait (averaged over sites and
showed low stability, as shown by more constant or years) were plotted against each other in pairs (Fig. 3)
variable colours in the heat map. The traits percent to identify the predictions for parents and progeny.
blush and mesocarp texture were fairly stable within a This plot shows the improvements in traits with high
site and relatively stable between the Northern Terri- numbers of progeny showing more desirable trait
tory and Queensland, however, between Western values than their parents. These are identified by
Australia and the other sites there was lower genetic progeny above and to the right of parents in the top
correlation. Mesocarp colour was generally stable be- right quadrant of the scatter plots in Fig. 3. For
tween sites and years except for year one in the example, there are a number of progeny with increased
Northern Territory and year two in Western Australia. percent blush together with increased blush colour
than any parents in the study.
Best linear unbiased predictions To better understand the relationships among traits,
the genotype BLUPs for each trait were analysed by
Best linear unbiased predictions (BLUPs) of breeding principal component analysis (PCA). The PCA
values were predicted for all progeny and parent explains the variation among the traits in a smaller
cultivars for each trait, averaged over Sites and Years. number of dimensions. The first two principal com-
The breeding values of the parent cultivars are ponents were used to construct a biplot (Gabriel 1971)
Table 5 Narrow sense Trait Heritability range Average heritability
heritability range and
average across sites and Average fruit weight 0.48–0.90 0.80
years for 13 fruit quality
Mesocarp recovery 0.69–0.98 0.79
traits
Blush intensity (no WA) 0.54–0.68 0.60
Beak shape (no WA) 0.46–0.75 0.59
Percent blush 0.32–0.93 0.57
Seed width 0.34–0.83 0.56
Blush colour 0.26–0.71 0.52
Stem-end shape (no WA) 0.26–0.82 0.49
Mesocarp colour 0.26–0.63 0.47
Skin background colour 0.27–0.65 0.47
Skin thickness 0.04–0.91 0.36
Mesocarp texture 0.13–0.99 0.35
Deformities (no WA) 0.09–0.42 0.27
123Euphytica (2021)217:44 Page 9 of 18 44
Fig. 1 Heat map representation of the genetic correlations among the site by year combinations for each fruit quality trait. The colours
show the range of correlations from high positive (1.0) in red to high negative (- 1.0) in dark blue
12344 Page 10 of 18 Euphytica (2021)217:44 Fig. 1 continued 123
Euphytica (2021)217:44                                                           Page 11 of 18   44

Fig. 1 continued

(Fig. 4). The biplot gives an indication of how the         the heritability of average fruit weight by Hardner
traits are correlated, with vectors (arrows) pointing in    et al. (2012), were between 0.69 and 0.94. Average
the same direction being highly positively correlated       fruit weight for mango seems to be at the higher end of
and those in the opposite direction being highly            published heritabilities in fruit species for example;
negatively correlated. Those vectors perpendicular to       Japanese pear (Pyrus pyrifolia Nakai) at 0.73 (Abe
each other are uncorrelated. The angle between the          et al. 1995), peach at 0.20 (Hansche 1986), Olive
vectors reflects the degree of correlation between the      (Olea europaea L.) between 0.17 and 0.28 (Zeinanloo
traits with the smaller the angle the higher the            et al. 2009). There was a strong positive correlation
correlation. Vectors extending furthest from the centre     between the average fruit weight and mesocarp
of the biplot identify variables that explain most of the   recovery (Fig. 4), indicating larger fruit generally
variation in the data.                                      have a higher percentage of edible mesorcarp and
                                                            these traits can be co-selected.
                                                               Mesocarp colour was generally stable across sites
Discussion                                                  and years with heritabilities ranging from 0.26 to 0.63,
                                                            indicating it is under moderate genetic control. In
Average fruit weight is an important trait as it dictates   Western Australia, in 2001–2002, and Northern Ter-
the number of fruit that fit into each 7 kg box for         ritory 2000–2001 the mesocarp colour correlated
marketing and very large or very small fruit are often      slightly less well with other sites and seasons. The
discounted on the wholesale market. Mean average            reason for this is unclear but may be due to the stage of
fruit weight varied between sites and between seasons       fruit ripeness at time of assessment. The BLUP
(Table 4) however the genetic correlations for this trait   analysis has indicated the best parental cultivars used
were high (Fig. 1) The genetic correlation of average       in the study populations for improving (darkening)
fruit weight was stable across sites and seasons,           mesocarp colour are Padiri, Palmer, Suvarnareka and
although less so in Western Australia, indicating high      Hybrid 10. The principal component biplot shows
genetic and less environmental control over this trait      mesocarp colour accounts for very little of the
and observations are relatively transferable from one       variation in the data but it seems to be positively
site to another which is helpful in determining varietal    correlated with the other mesocarp traits (mesocarp
performance in growing areas not tested. Average fruit      recovery, mesocarp texture) and average fruit weight.
weight had the highest average heritability (0.80) with     (Fig. 4).
a spread of 0.48 to 0.90 indicating the relative ease at       Mesocarp texture, a measure of two traits (meso-
transferring this trait from parents to progeny in the      carp firmness and mesocarp fibre) is a fruit trait that
Australian breeding population. Previous estimates of       changes over time as fruit ripen, and as such is highly

                                                                                                          123
44 Page 12 of 18 Euphytica (2021)217:44 Fig. 2 Best linear unbiased predictions (BLUPs) for each trait in each of the parent cultivars. Parental cultivars are represented on the horizontal axis by their numerical codes presented in Table 1. Predicted BLUP’s are displayed on the vertical axis of each plot influenced by the stage of fruit ripeness, which may be heritability and are more useful for breeders interested a reason that mesocarp texture had one of the lowest in improving mesocarp texture. average heritabilities in this study (0.35), indicating a Mesocarp recovery had one of the highest average relative difficulty in transferring this trait between heritability (0.79) and a high range of heritabilities generations in a breeding program. Mesocarp texture (0.69–0.98), indicating the relative ease at transferring was stable across seasons in the Northern Territory this trait from parents to progeny in the Australian and Queensland but less so in Western Australia breeding population. The high heritability also indi- (Fig. 1). The principal component analysis indicated cates high genetic influence and low environmental positive correlation between mesocarp texture, meso- influence on the trait. We could expect the mesocarp carp recovery and average fruit weight. Separate recovery of a cultivar to be similar when grown at measurement and analyses of mesocarp texture com- different sites and years making it a stable trait. From ponents such as firmness, fibre abundance, and fibre the data presented in Fig. 2, there are several parental strength may identify which components have higher cultivars with relatively high BLUPS indicating a 123
Euphytica (2021)217:44                                                                      Page 13 of 18   44

Fig. 3 Plot of BLUPs for each pair of traits averaged over sites and years showing parents (pink) and progeny (blue)

range of parents have good ability to improve meso-                 it allows for more of the edible fruit mesocarp.
carp recovery in their progeny. There was strong                    Cultivars such as Nam Doc Mai, and perhaps Irwin,
positive correlation between mesocarp recovery and                  have very low BLUPs (Fig. 2) indicating that they are
average fruit weight (Fig. 4), indicating larger fruit              good parents to use to reduce seed width in hybrid
generally have a higher percentage of edible mesocarp               progeny. The principal component analysis indicates
and these traits can be co-selected.                                that seed width is moderately positively correlated
   Seed width was another trait with high stability                 with mesocarp recovery and average fruit weight.
across sites and seasons indicating that it is mainly                  Skin thickness had one of the lowest average
governed by genetics with little environmental influ-               heritabilities in this study (0.36), indicating a relative
ence on its expression. Low seed width is desirable as              difficulty in transferring this trait between generations

                                                                                                                       123
44 Page 14 of 18 Euphytica (2021)217:44 Fig. 4 Biplot based on principal component analysis of and more easily co-selected whilst arrows pointing in opposite genotype BLUPs from analyses of 13 fruit traits. Traits with directions are negatively correlated arrows pointing in the same direction are positively correlated in a breeding program. Skin thickness was generally environmental influence on this trait. The de-greening stable among sites and most years, however, in some of mango skin during ripening can depend on the site by years the relationship was poor (Fig. 1). The nitrogen status of the fruit and ripening temperatures reason that some sites had poor correlations in some (Hofman 1997). The biplot (Fig. 4) shows fruit skin seasons is unclear but may be because of large background colour is moderately positively correlated environmental anomalies. Skin thickness was not with blush colour, percent blush and blush intensity. particularly highly correlated to any other fruit quality Blush colour in many Asian cultivars are un- trait (Fig. 4). blushed whereas those originating from Florida are Skin background colour had a reasonably large often highly-blushed. In Australian and other markets, spread of heritabilities (0.27–0.68, av. 0.47) (Table 5) blushed fruit receive a premium price due to their eye and BLUPs (Fig. 2) indicating the importance of appeal. Heritability of blush colour varied from 0.26 to parental selection when breeding for this trait. The 0.71 with an average of 0.52 indicating a reasonable Floridian parent cultivars Van Dyke, Irwin, Haden and ease in transferring this trait to progeny when the best Lippens had the strongest BLUPs and likelihood of parents are used. The genetic correlations in the transferring this trait to progeny. Across sites and studied populations show blush colour was years, skin background colour was less stable than stable within sites and across sites in Queensland mesocarp colour and texture, indicating a higher and the Northern Territory but not in Western 123
Euphytica (2021)217:44                                                            Page 15 of 18   44

Australia. The reasons for the difference in blush          correlation between deformities and the stem end
colour in Western Australian are unclear but may have       shape of the fruit, as growth deformities often occur at
been due to the relative difference in fruit ripeness or    the stem end of the fruit.
differences in tree shading and light transmission due
to differences in pruning between sites. Blush devel-       Comments on method and limitation of study
opment requires fruit skin exposure to direct sunlight      design
(Berardini et al. 2005a, b). As might be expected, the
skin blush colour traits (percent blush, blush colour       The statistical analysis approach presented here has
and blush intensity) were strongly positively corre-        successfully modelled mango genetic effects for
lated indicating all three can be bred for or selected      multiple traits, several years and multiple environ-
simultaneously.                                             ments, allowing insight into the heritability and
   Percentage of blush covering the skin has similar        stability of traits and the relationship among traits
variability to blush colour within sites and was            across environments. The linear mixed model, incor-
relatively stable between Queensland and the North-         porating pedigree information and modelling geno-
ern Territory but not in Western Australia. The reasons     type by environment effects using factor analytic
for the difference in the percentage of skin covered        models, provides a comprehensive multivariate mod-
with blush in Western Australian fruit are unclear but      elling approach, however there are limitations in this
may also have been due to the relative difference in        study. Firstly, the sparse data on trees across sites and
tree shading and light transmission due to differences      years has made modelling spatial and temporal
in pruning between sites. The percentage of skin            correlation problematic and only simple residual
covered by blush is negatively influenced by shading        models have been able to be fitted. In other studies
within the tree and as such can be managed through          in perennial crops, spatial and temporal correlation has
pruning and training of canopies.                           been found to be significant (Stringer and Cullis 2002;
   Blush intensity had a reasonably high average            Dutkowski et al. 2002; Smith et al. 2007; De Faveri
heritability (0.6) and was stable across years and sites    et al. 2015) and so the simple residual models fitted in
(only data from Queensland and Northern Territory           this paper may not be optimal. However as different
used here). The parental cultivar Irwin had high            trees were measured at different times the effect on
BLUPs for Blush Intensity. The principal component          predictions may not be large. Also, the limited
biplot showed high positive correlation between blush       numbers of progeny per parent create a very sparse
intensity, blush colour and percent blush.                  unbalanced data set which may have been improved
   Stem-end shape had relatively large range and            with more data on more crosses.
medium average heritability (0.26–0.82, av 0.47) in             A similar mixed model approach was implemented
this study. Stem-end shape was strongly negatively          in the univariate analysis of mango fruit weight
correlated with average fruit weight (Fig. 4) which         (Hardner et al. 2012). In that paper only factor analytic
may be contributing to the large range of heritibilities.   models with a single factor (FA1) were fitted and
Stem-end shape was strongly positively correlated           hence were not found to be the best model. In our case
with deformities (Fig. 4) indicating the stem-end of        we have fitted higher order factor analytic models
the fruit may be influencing the level of fruit             (with two to four factors) and in all cases the higher
deformities.                                                order factor analytic models were a significant
   Fruit deformities had one of the lowest heritabilities   improvement on a single factor (FA1) model. The
(0.09–0.42, av.0.27) in this study (Table 5), indicating    factor analytic model allows a good approximation to
the low genetic component and relative difficulty in        the fully unstructured covariance model where all
breeding for such trait. Fruit deformities are often        variances and pairs of covariances are estimated, but it
caused by environmental conditions such as excessive        is important to fit sufficient factors for accurate
temperatures or nutritional deficiencies during fruit       separation of genetic and non-genetic effects. Failure
development. Fruit deformities are highly negatively        to fit sufficient factors will result in biased estimates of
correlated with mesocarp recovery and average fruit         genetic effects due to interplay between genetic and
weight, indicating that heavier fruit are more likely to    residual components in the model (De Faveri 2017).
have less deformities. There was also a strong positive

                                                                                                            123
44 Page 16 of 18 Euphytica (2021)217:44
The stability analysis of traits across sites and years program. The findings on the stability of these fruit
as shown in the heatmaps (Fig. 1) allows insight into quality traits across years and environments will help
which traits may be combined across sites and which in designing future regional performance trials and in
may require more specific environment by year testing predicting performance in other non-tested environ-
in future studies. In general, the analyses showed the ments. The principal component analyses and visual
Northern Territory and Queensland sites to be very representation in the biplot presented in Fig. 4 has
similar with high genetic correlations between these highlighted where certain fruit quality traits are
sites for most traits (for example average fruit weight, closely correlated, indicating that selection of ideal
mesocarp recovery, seed width, blush intensity), hence parents for one of these traits is likely to deliver
selection based on one of these sites is likely to progeny that also have higher representation of the
correspond favourably with the other. The Western other highly correlated trait. Interpretation of heri-
Australian site showed some differences to these two tability estimates and results from other analyses
sites with lower correlation for traits such as mesocarp presented in this report must be done in the context of
texture and blush colour. Traits such as mesocarp the populations used in the analysis. Relationships and
colour, skin background colour and skin thickness heritabilities may change in populations of other
showed differences both among sites and among years breeding programs with different parents and genetic
within sites, and may need more intense sampling. profiles.
Most other traits showed very high genetic correlation
between years within a site and hence may not need to Acknowledgements We would like to acknowledge the
efforts of Peter Johnson, David Hamilton, Chris Wicks, Ping
be sampled every year.
Lu, Richard Brettell, Sam Blakie, Warren Muller and Craig
The issue of how best to obtain genetic parameters Hardner who contributed to collecting and collation of the
from tree breeding programs where data needs to be phenotypic data used in this analysis. We would like to
sampled across sites, years, traits and family groups acknowledge the Queensland Department of Agriculture and
Fisheries, the Northern Territory Department of Primary
when not all trees can be measured for all traits at all
Industry & Resources, the Western Australian Department of
times due to time and labour constraints is an Primary Industries and Regional Development and CSIRO for
interesting topic of future research. Optimal sparse their financial support of the National Mango Breeding project.
sampling designs could be developed to optimize the
accuracy of genetic parameter prediction. Having Author contributions Both authors contributed to the study
conception and design. Material preparation, and data collection
more genetic information, for example, genomic was performed by Ian Bally and data analyses were performed
marker data on the trees would also improve the by Joanne De Faveri. The first and subsequent drafts of the
power and estimation of genetic effects in sparse manuscript were written by Ian Bally and Joanne De Faveri. All
designs. authors read and approved the final manuscript.
The approach implemented here analyses each trait
Funding The National Mango Breeding project was
individually using the linear mixed model and then the supported by the Queensland Department of Agriculture and
BLUPs from each analysis have been subjected to a Fisheries, the Northern Territory Department of Primary
principal component analysis in order to investigate Industry & Resources, the Western Australian Department of
relationships among traits. A full multi-trait, multi- Primary Industries and Regional Development and CSIRO.
year, multi-site analysis would have been preferable to
Data Availability The datasets generated analysed during the
estimate genetic correlations among traits, however current study are not publicly available due to commercial in
the computational burden for such an analysis was confidence and the protection of intellectual property associated
prohibitive. with the Australian National Mango Breeding Program but are
available from the corresponding author on reasonable request.
Code availability Statistical methods and software used in
Conclusion this manuscript are outlined in the materials and methods
section.
The analyses presented here on fruit quality traits have
improved our understanding of their heritability and
the relative ease of difficulty of transferring these traits
from parents to progeny in a controlled hybridisation
123Euphytica (2021)217:44 Page 17 of 18 44
Compliance with ethical standards De Faveri J (2013) Spatial and temporal modelling for perennial
crop variety selection trials., PhD thesis, University of
Conflict of interest The authors declare that they have no Adelaide, Adelaide
conflict of interest. De Faveri J, Verbyla AP, Pitchford WS, Venkatanagappa S,
Cullis BR (2015) Statistical methods for analysis of multi-
harvest data from perennial pasture variety selection trials.
Crop Pasture Sci 66(9):947–962. https://doi.org/10.1071/
References CP14312
De Faveri J, Verbyla AP, Lee SJ, Pitchford WS (2017) Maternal
Abe K, Sato Y, Saito T, Kurihara A, Kotobuki K (1995) Narrow- body composition in seedstock herds: 5. Animal Produc-
sense heritability of fruit characters in Japanese pear (Pyrus tion Science, Multivariate analysis using factor analytic
pyrifolia Nakai). Jpn J Breed 45(1):1–5. https://doi.org/10. models and cluster analysis. https://doi.org/10.1071/
1270/jsbbs1951.45.1 AN15465
AMIA (2014) Mango Stratagic Investment Plan 2014/15. Dutkowski G, Costa e Silva J, Gilmour A, Lopez G (2002)
AMIA, p 25 Spatial analysis methods for forest genetic trials. Canadian
Bally IE, Lu P, Johnson P (2009) Mango breeding. In: Jain SM, Journal of Forest Research 32:2201–2214
Priyadarshan PM (eds) Breeding plantation tree crops: Falconer DS, Mackay TFC (1996) Introduction to Quantitative
tropical species. Springer, New York Genetics. Longman Scientific and Technical, London
Bally ISE (2008) Mango breeding activities in Australia. Paper Gabriel KR (1971) The biplot graphic display of matrices with
presented at the 4th international symposium on tropical application to principal component analysis. Biometrika
and subtropical fruits, Bogor, West Java, Indonesia, 3–7 58:453–467
November Galan Saco V (2017) Trends in world mango production and
Bally ISE, Akem CN, Dillon NL, Grice K, Lakhesar D, Stock- marketing. Acta Hort 1183:351–364
dale K (2013) Screening and breeding for genetic resis- Hansche PE (1986) Heritability of fruit quality traits in peach
tance to anthracnose in mango. Acta Hort 992:239–244 and nectarine breeding stocks dwarfed by the dw gene.
Bally ISE, De Faveri J, Maddox C (2017) Breeding for low Hortsci 21(5):1193–1195
vigour in mango. Acta Hort 1138:63–68. https://doi.org/10. Hardner C, Bally I, Wright C (2012) Prediction of breeding
17660/ActaHortic.2017.1183.9 values for average fruit weight in mango using a multi-
Bally ISE, Dillon NL (2018) Mango (Mangifera indica L.) variate individual mixed model. EUP 168(2):463–477.
Breeding. In: Al-Khayri JM, Jain SM, Johnson DV (eds) https://doi.org/10.1007/s10681-012-0639-7
Advances in Plant Breeding Strategies: Fruits, vol 3 Hofman PJ (1997) What causes green, ripe mangoes? Mango
Advances in Plant Breeding Strategies. Springer Interna- Care Newsletter 20:13–15
tional Publishing, Cham Horticulture Innovation Australia (2017) Mango Stratagic
Bally ISE, Lu P, Johnson P, Muller WJ, González A (2009) Past, Investment Plan 2017–2021. Hort Innovation, Sidney,
current and future approaches to mango genetic improve- Australia
ment in Australia. Acta Hort 820(1):153–163 Horticulture Innovation Australia (2018) Australian Horticul-
Berardini N, Fezer R, Conrad J, Beifuss U, Carle R, Schieber A ture Statistics Handbook, Fruit, 2016/2017. Horticulture
(2005) Screening of mango (Mangifera indica L.) cultivars Innovation Australia, Sydney, Australia
for their contents of flavonol O- and xanthone C-glyco- Iyer CPA, Schnell RJ (2009) Breeding and Genetics. In: Litz RE
sides, anthocyanins and pectin. J Agric Food Chem (ed) The Mango Botany, Production and Uses 2nd Edition,
53(5):1563–1570 2nd edn. CABI International, Wallingford, Oxen, pp 67–96
Berardini N, Schieber A, Klaiber I, Beifuss U, Carle R, Conrad J Kelly AM, Smith AB, Eccleston JA, Cullis BR (2007) The
(2005) 7-O-methylcyanidin 3-O-b-D-galactopyranoside, a accuracy of varietal selection using factor analytic models
novel anthocyanin from mango (Mangifera indica L. cv. for multi-environment plant breeding trials. Crop Sci
‘Tommy Atkins’) peels. Z Naturforsch 60:801–804 47:1063–1070. https://doi.org/10.2135/cropsci2006.08.
Bernardo R (2010) Breeding for Quantitative Traits in Plants. 0540
Stemma Press, Woodbury, Minn Kulkarni VJ, Bally ISE, Brettell RIS, Johnson PR, Hamilton D
Butler DG, Cullis BR, Gilmour AR, Gogel BJ (2009) ASReml- (2002) The Australian national mango breeding program -
R reference manual, release 3. Department of Primary in search of improved cultivars for the new millennium.
Industries and Fisheries, Brisbane, Australia, Toowoomba, Acta Hort 575(1):287–293
Queensland Medlicott AP, Bhogal M, Reynolds SB (1986) Changes in peel
Cullis BR, Smith AB, Beeck CP, Cowling WA (2010) Analysis pigmentation during ripening of mango fruit (Mangifera
of yield and oil from a series of canola breeding trials. Part indica var. Tommy Atkins). Ann Appl Biol 109:651–656
II. Exploring variety by environment interaction using Meyer K (2007) Multivariate analyses of carcass traits for
factor analysisThis article is one of a selection of papers Angus cattle fitting reduced rank and factor-analytic
from the conference exploiting genome-wide association models. J Anim Breed Genet 124:50–64. https://doi.org/10.
in oilseed brassicas: a model for genetic improvement of 1111/j.1439-0388.2007.00637.x
major OECD crops for sustainable farming. Genome 53 Pott I, Marx M, Neidhart S, Muhlbauer W, Carle R (2003)
(11):1002–1016.https://doi.org/10.1139/G10-080 Quantitative determination of beta-carotene stereoisomers
in fresh, dried, and solar-dried mangoes (Mangifera indica
L.). J Agric Food Chem 51(16):4527–4531
12344 Page 18 of 18 Euphytica (2021)217:44
Proctor JTA, Creasy LL (1969) The anthocyanin of the mango interplot competition in early stage sugarcane selection
fruit. Phytochemistry 8(10):2018 trials. Aust J Agric Res 53:911–918
R Core Team (2015) R: A language and environment for sta- The Royal Horticultural Society (2001) RHS colour chart, 4th
tistical computing. R Foundation for Statistical Comput- edn. Royal Horticultural Society, London
ing. https://www.R-project.org/. 2017 Zeinanloo A, Shahsavari A, Mohammadi A, Naghavi MR
Smith AB, Cullis BR, Thompson R (2001) Analysing variety by (2009) Variance component and heritability of some fruit
environment data using multiplicative mixed models and characters in olive (Olea europaea L). Sc Hort
adjustments for spatial field trend. Biometrics. https://doi. 123(1):68–72. https://doi.org/10.1016/j.scienta.2009.07.
org/10.1111/j.0006-341X.2001.01138.x 024
Smith AB, Stringer JK, Wei X, Cullis BR (2007) Varietal
selection for perennial crops where data relate to multiple
Publisher’s Note Springer Nature remains neutral with
harvests from a series of field trials. Euphytica
regard to jurisdictional claims in published maps and
157:253–266
institutional affiliations.
Stringer JK, Cullis BR (2002) Application of spatial analysis
techniques to adjust for fertility trends and identify
123You can also read