High-resolution imaging with the International LOFAR Telescope: Observations of the gravitational lenses MG 0751+2716 and - CLASS B1600+434
←
→
Page content transcription
If your browser does not render page correctly, please read the page content below
Astronomy & Astrophysics manuscript no. lofarlens                                                                                     ©ESO 2021
                                               August 18, 2021

                                                 High-resolution imaging with the International LOFAR Telescope:
                                                    Observations of the gravitational lenses MG 0751+2716 and
                                                                        CLASS B1600+434
                                               Shruti Badole1 , Deepika Venkattu1, 2 , Neal Jackson1 , Sarah Wallace1 , Jiten Dhandha1 , Philippa Hartley1, 3 , Christopher
                                                                     Riddell-Rovira1 , Alice Townsend1 , Leah K. Morabito4, 5 , J. P. McKean6, 7

                                                     1
                                                         Jodrell Bank Centre for Astrophysics, Department of Physics and Astronomy, University of Manchester, Oxford Rd, Manchester
                                                         M13 9PL, UK
arXiv:2108.07293v1 [astro-ph.GA] 16 Aug 2021

                                                         e-mail: shruti.badole@postgrad.manchester.ac.uk
                                                     2
                                                         Department of Astronomy and The Oskar Klein Centre, AlbaNova University Center, Stockholm University, SE-106 91 Stockholm,
                                                         Sweden
                                                     3
                                                         Square Kilometre Array Organisation, Jodrell Bank, Lower Withington SK11 9FT, Cheshire, UK
                                                     4
                                                         Centre for Extragalactic Astronomy, Department of Physics, Durham University, Department of Physics, South Road, Durham
                                                         DH1 3LE, UK
                                                     5
                                                         Institute for Computational Cosmology, Department of Physics, Durham University, South Road, Durham DH1 3LE, UK
                                                     6
                                                         ASTRON, Netherlands Institute for Radio Astronomy, Oude Hoogeveensedijk 4, Dwingeloo, the Netherlands
                                                     7
                                                         Kapteyn Astronomical Institute, University of Groningen, P.O. Box 800, 9700AV Groningen, the Netherlands

                                                    Received (date); accepted (date)

                                                                                                                  ABSTRACT

                                                    We present Low-Frequency Array (LOFAR) telescope observations of the radio-loud gravitational lens systems MG 0751+2716
                                                    and CLASS B1600+434. These observations produce images at 300 milliarcseconds (mas) resolution at 150 MHz. In the case of
                                                    MG 0751+2716, lens modelling is used to derive a size estimate of around 2 kpc for the low-frequency source, which is consistent
                                                    with a previous 27.4 GHz study in the radio continuum with Karl G. Jansky Very Large Array (VLA). This consistency implies that
                                                    the low-frequency radio source is cospatial with the core-jet structure that forms the radio structure at higher frequencies, and no
                                                    significant lobe emission or further components associated with star formation are detected within the magnified region of the lens.
                                                    CLASS B1600+434 is a two-image lens where one of the images passes through the edge-on spiral lensing galaxy, and the low radio
                                                    frequency allows us to derive limits on propagation effects, namely scattering, in the lensing galaxy. The observed flux density ratio
                                                    of the two lensed images is 1.19±0.04 at an observed frequency of 150 MHz. The widths of the two images give an upper limit of
                                                    0.035 kpc m−20/3 on the integrated scattering column through the galaxy at a distance approximately 1 kpc above its plane, under the
                                                    assumption that image A is not affected by scattering. This is relatively small compared to limits derived through very long baseline
                                                    interferometry (VLBI) studies of differential scattering in lens systems. These observations demonstrate that LOFAR is an excellent
                                                    instrument for studying gravitational lenses. We also report on the inability to calibrate three further lens observations: two from early
                                                    observations that have less well determined station calibration, and a third observation impacted by phase transfer problems.
                                                    Key words. gravitational lensing: strong - radio continuum: galaxies - galaxies:quasars:individual: MG0751+2716 - galax-
                                                    ies:quasars:individual: CLASS B1600+434 - techniques: interferometric

                                               1. Introduction                                                            olution and higher sensitivity (e.g. Kochanek et al. 1989; War-
                                                                                                                          ren & Dye 2003; Spingola et al. 2018; Dye et al. 2018; Hart-
                                               Strong gravitational lenses are systems in which a background              ley et al. 2019; Rybak et al. 2020; Badole et al. 2020). Finally,
                                               galaxy is multiply imaged by the gravitational field of a fore-            gravitational lens systems may be used to investigate environ-
                                               ground galaxy- or cluster-scale mass, typically at redshift z ∼            mental effects in the lensing galaxy, since lens systems consist
                                               0.5 − 1, and typically producing two or four images of the                 of multiple images of the same object seen along different lines
                                               background source (see Treu 2010 and Bartelmann 2010 for re-               of sight through the lensing galaxy. This can be done in a number
                                               views). They are astrophysically useful tools, for three main rea-         of ways, including differential effects on radio polarization, dif-
                                               sons. Firstly, they can be used to determine a very accurate total         ferential optical extinction, differential scattering of radio waves,
                                               mass within the Einstein radius of the lens galaxy, and they can           or differential X-ray absorption (e.g. Wucknitz et al. 2003; Biggs
                                               constrain its mass distribution (e.g. Chen et al. 1995; Saha &             et al. 2003; Elíasdóttir et al. 2006; Dai & Kochanek 2009; Mos-
                                               Williams 1997; Cohn et al. 2001; Rusin et al. 2002; Koopmans               quera et al. 2011; Mao et al. 2017).
                                               & Treu 2003; van de Ven et al. 2009; Suyu et al. 2012). Secondly,              Several hundred gravitational lens systems are now known,
                                               lensing preserves surface brightness, so the effective increase in         of which a minority (approximately 10%) contain radio-loud
                                               solid angle containing images of the source allows us to investi-          background sources, either in the form of radio-loud quasars,
                                               gate the background source at some combination of higher res-              which produce compact images of the radio core and jet emis-
                                                                                                                                                                       Article number, page 1 of 8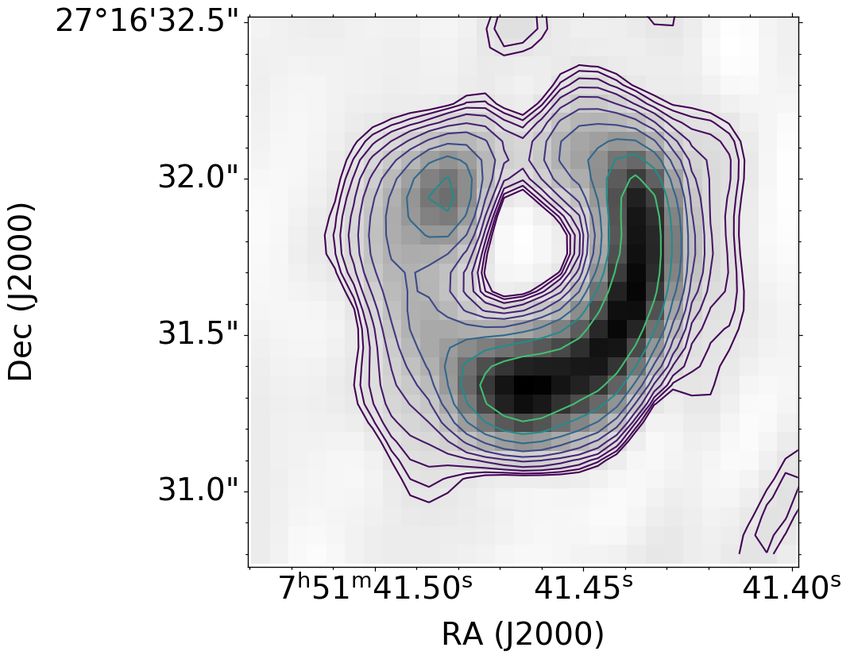
A&A proofs: manuscript no. lofarlens

sion (e.g. Biggs et al. 2004), or in extended images of large-scale   given the ν−2 dependence of scattering and free-free absorption
radio jets. In addition, many of the 90% of radio-quiet lens sys-     effects.
tems have detectable radio emission at the level of a few tens            As a first step, we present LOFAR maps produced using ob-
of µJy, although in many cases this is likely to be produced by       servations that included the international baselines of two lens
star-forming processes (Wucknitz & Volino 2008; Jackson 2011;         systems. We first investigate MG 0751+2716 (Hewitt et al. 1988)
Jackson et al. 2015; Badole et al. 2020).                             in order to study the lensed source, to deduce its overall size and
    The first aim of this work is to use lens models to recon-        to compare it to that observed at shorter wavelengths. We also
struct the radio source. Many studies of radio lenses have at-        present an observation of CLASS B1600+434 (Jackson et al.
tempted to do the same (e.g. Kochanek et al. 1989; Lehar et al.       1995); this lens system consists of a quasar that is lensed by an
1993; King et al. 1997; Wucknitz 2004; Wucknitz et al. 2004;          edge-on spiral galaxy. Because of the passage of one of the im-
Hartley et al. 2019; Spingola et al. 2020; Stacey et al. 2020)        ages close to the plane of the galaxy, this offers an opportunity
and study the relation of the radio source components to other        to investigate a system in which scattering effects and absorption
components of the source emitting at other wavebands. The rela-       would be potentially important. Lastly, we also discuss three ob-
tion of steep-spectrum, synchrotron radio components with other       servations that we were unable to calibrate successfully.
source components can also be investigated, given sufficient res-         Where necessary, we assume a standard flat Universe with
olution at low frequency, which no instrument other than the          H0 = 70 km s−1 Mpc−1 and ΩΛ = 0.7.
Low-Frequency Array (LOFAR) operated by the International
LOFAR Telescope (ILT) foundation is capable of providing.
    A second aim of this work is to use radio lenses to ex-           2. MG 0751+2716
plore environmental effects in the lens galaxy. Optical studies       2.1. The lens system MG 0751+2716
have shown effects including reddening of lensed images pass-
ing through the lens galaxy disk (Elíasdóttir et al. 2006; Muñoz      MG 0751+2716 (07h 51m 41.5s 27◦ 160 3100 ) is a gravitational lens
et al. 2011), and microlensing, which can reveal the lens galaxy      system originally observed in the MIT-Greenbank radio survey
stellar population (for a review, see e.g. Mao 2012). A number        (Langston et al. 1990) and identified as a gravitational lens by
of the known radio lenses show significant foreground effects,        Lehar et al. (1997). It consists of a z = 3.2 quasar lensed by a
notably CLASS B0218+357, which has a range of absorption              galaxy at redshift 0.35 (Tonry & Kochanek 1999). It is a bright
effects due to passage through molecular gas in the spiral lensing    radio source, with a flux density of 1.47 Jy at 365 MHz (Dou-
galaxy (Wiklind & Combes 1995; Menten & Reid 1996; Mittal             glas et al. 1996). Its radio spectrum peaks at a few hundred MHz,
et al. 2006, 2007), and PKS1830−211, in which absorption ef-          but is steeper at higher frequencies, and it consists of lensed jet
fects are also seen (Wiklind & Combes 1996, 1998). In addition        emission from a classical synchrotron radio source originating in
to absorption, radio waves may be scattered by ionised columns        an active galactic nucleus (AGN). The core-jet system is gravi-
within any intervening object. Very long baseline interferome-        tationally lensed, resulting in a complex structure stretched out
try (VLBI) studies that show broadening of one or more com-           along an arc of emission (Lehar et al. 1997). In addition to being
ponents are indicative of scattering either in the lensing galaxy     a source of strong radio emission, the quasar was discovered to
(Marlow et al. 1999; Jones et al. 1996; Biggs et al. 2003; Winn       be a source of CO molecular line emission (Barvainis et al. 2002;
et al. 2003a; Biggs et al. 2004) and occasionally in our own          Alloin et al. 2007; Riechers et al. 2011; Spingola et al. 2020) as
Galaxy (Koopmans et al. 2003). Scattering effects are more no-        well as sub-millimetre continuum (Wu et al. 2009; Stacey et al.
ticeable at lower frequencies, generally increasing as ν−2 , and      2018).
therefore should be more prevalent, provided high enough reso-            Its radio structure was mapped in detail by Spingola et al.
lution (which only LOFAR can provide) can be obtained to sepa-        (2018), who studied MG 0751+2716 using 1.65 GHz global
rate the lensed images and quantify any scatter-induced broaden-      VLBI observations and obtained images at milliarcsecond res-
ing in them. Such high levels of scattering or free-free absorption   olution. They found evidence of low-mass structure in the mass
could also impact potential wide-area surveys for lenses at low       distribution of the lens, although it is not certain whether this
radio frequencies.                                                    is in the form of 106 to 108 M sub-haloes or more complex
    A few high-resolution observations of gravitational lenses        mass distributions in the group associated with the main lensing
have previously been made at frequencies below 500 MHz.               galaxy. Here we use the observed structure at a frequency ∼10
These have included low-frequency VLBI observations at                times lower, together with lens modelling, to investigate whether
327 MHz (e.g. Lenc et al. 2008) and Multi-Element Ra-                 the size of the lensed structure at the lower frequency is similar
dio Linked Interferometer Network (MERLIN) observations at            to that at higher (GHz) frequencies.
408 MHz (e.g. Noble & Walsh 1980). The advent of LOFAR
(van Haarlem et al. 2013) at still lower frequencies, however, has    2.2. Observations and data reduction
opened up a new spectral window for high-sensitivity observa-
tions at low radio frequencies. Recent progress in the calibration    MG 0751+2716 was observed on 2018 January 17 with LO-
of the LOFAR international baselines (Morabito 2021) offers the       FAR as part of programme LC9-012 (PI: Jackson), using the
prospect of routine studies at 30-200 MHz with resolutions of         High Band Array (HBA), with the HBA Dual Inner antenna set
200-300 milliarcseconds (mas), ideally matched to the angular         (van Haarlem et al. 2013) with a bandwidth ranging from 120
scale of the images in strong gravitational lens systems, which       to 183 MHz. The observation was preceded by a ten-minute ob-
typically have image separations of the order of 100 . LOFAR ob-      servation of the bright calibrator source 3C 196, and followed
servations, given their low radio frequency, are uniquely able        by a similar observation of 3C 295. This is the standard ob-
to probe steep-spectrum synchrotron-emitting plasma at resolu-        serving strategy for the LOFAR Two-metre Sky Survey (LoTSS;
tions comparable to Atacama Large Millimeter Array (ALMA)             Shimwell et al. 2017). All stations were used, including all 13 in-
or the Very Large Array (VLA) at THz and GHz frequencies, re-         ternational stations (6 in Germany, 3 in Poland and 1 each in Ire-
spectively. At these low radio frequencies, we also gain a signifi-   land, France, Sweden, and the UK). Data were initially recorded
cant advantage in the study of scattering and related phenomena,      at 64 channels per 196 kHz sub-band, which was averaged to
Article number, page 2 of 8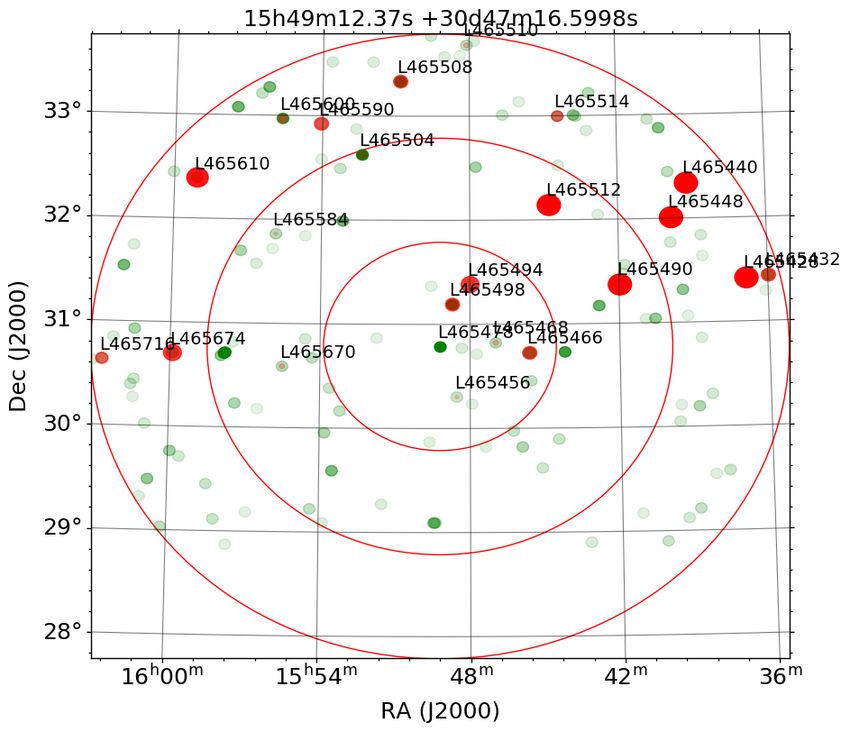
Badole et al.: LOFAR observations of gravitational lenses

                                                                        kilometres of the centre of the array, were combined to form a
                                                                        single super-station.
                                                                            Imaging and self-calibration was performed in Difmap
                                                                        (Shepherd 1997), with both the phase calibrator source and tar-
                                                                        get data initially phase self-calibrated using a point-source start-
                                                                        ing model. Although the phase calibrator source was intended
                                                                        for use in generating phase solutions to apply to the target, this
                                                                        proved unnecessary as the convergence of the target model was
                                                                        good; however, the phase calibrator was imaged using the same
                                                                        procedure as MG 0751+2716 to verify that the pipeline was
                                                                        working correctly. Six iterations of CLEANing were performed,
                                                                        using uniform weighting, 50 mas pixels, and a u-v plane taper of
                                                                        50% at 25kλ, in order to downweight the short baselines. Phase-
                                                                        only self-calibration was done between each CLEAN iteration,
                                                                        and final maps were produced with contour levels of three times
                                                                        the nominal r.m.s. noise level in the image close to the sources.
                                                                            The maps of the calibrator source L588369 and the target
                                                                        source are shown in Fig. 2. The calibrator source has a distorted
                                                                        structure of core and two lobes, possibly a small wide-angle tail
Fig. 1. LBCS sources in the vicinity of MG 0751+2716. Sources from      source. MG 0751+2716 has the main structural features pre-
the Westerbork Northern Sky Survey (declination limit of about 29◦ )    viously observed in investigations of this object, with a bright
are in green and LBCS sources are in red. The source indicated by the   south-western arc and north-eastern counterimage (Lehar et al.
blue ellipse is the phase calibrator L588369.                           1997; Spingola et al. 2018).
                                                                            The flux density scale in the maps of Fig. 2 was produced
                                                                        directly by prefactor. The total flux density of the calibrator
16 channels per sub-band, and were recorded with one-second             L588369 is measured as 1.4 Jy at a mean frequency of 150 MHz,
integration time.                                                       which compares well to the 3.23 Jy at 74 MHz and 0.81 Jy
     The data analysis was performed during the development of          at 408 MHz measured in the VLA Low-Frequency Sky Survey
the LOFAR-VLBI Pipeline described by Morabito (2021). The               (Cohen et al. 2007) and B2 radio survey (Colla et al. 1972), re-
initial calibration of the Dutch part of the array, including the       spectively. Because the calibrator L588369 is about 0.5 degrees
core stations close to the centre of the array at Exloo, Nether-        from the field centre, its flux density may be reduced by about
lands, and the remote stations at baselines up to 80 km, was done       20-30% by a combination of time and bandwidth smearing.
using a model for 3C295 that was established for the LOFAR
HBA by F. Sweijen1 . Good solutions for total electron content
(TEC) and bandpass were obtained for all core and remote sta-           2.3. Unlensed source modelling
tions, using CS001 as the reference station, with the standard          We incorporated the lens model, Model 1, described by Spingola
procedures (known as prefactor2 , de Gasperin et al. 2019). An          et al. (2018) (Table 1) to fit the u-v data using the visilens pack-
initial phase calibration of the Dutch stations was then performed      age (Hezaveh et al. 2013; Spilker et al. 2016). visilens uses in-
using an input sky model from the Tata Institute of Fundamen-           terferometric visibility data to arrive at the structure of the back-
tal Research - Giant Metrewave Radio Telescope Sky Survey               ground source and the lens that form the gravitational lens sys-
(TGSS) Alternative Data Release (Intema et al. 2017). Data at           tem. The lens structure is described by a few key parameters,
frequencies higher than 166 MHz were excluded from the sam-             namely the critical radius of the lens, the position of the lens, the
ple, due to severe radio frequency interference.                        ellipticity of the lens mass distribution, the position angle of the
     The LOFAR Long-Baseline Calibrator Survey (LBCS, Jack-             major axis, and the magnitude and position angle of the external
son et al. 2016; Jackson 2021) was used to search for phase             shear. The critical radius of a lens is the radius of the Einstein
calibrators near the source (Fig. 1). A bright compact calibra-         ring for a spherical lens which is directly in front of the source
tor, L588369 (B0747+27), lies about half a degree away from             and is proportional to the square root of the lensing galaxy mass.
MG 0751+2716, which itself is an LBCS source (L588367).                 External shear refers to the distortion of the lensed images, in a
This source was used to correct the clock (non-dispersive) and          preferred direction, caused by the lens galaxy environment.
ionospheric (dispersive) delays, as outlined by Morabito (2021).             The density slope γ of the ellipsoidal power-law mass dis-
We solved for TEC using the LOFAR-VLBI Pipeline. Smoothly               tribution in the original Model 1 is 2.079; however, we assumed
varying solutions with most values lying below 1 TECU (1                a singular isothermal ellipsoid (SIE) profile for our lens model
TECU = 1016 electrons/m2 ) were found for all international sta-        fitting, for which γ = 2, and let the mass of the lensing galaxy
tions, with gradients of at most 1 TECU/hour.                           vary. We also let all the source parameters vary, assuming the
     Once the delay solutions were obtained, they were applied          source to have a Gaussian profile. visilens uses the package ‘em-
to the data. The entire dataset was then phase-rotated to the po-       cee’ to carry out a Markov chain Monte Carlo (MCMC) analysis
sitions of the target and nearby calibrator in order to produce         (Foreman-Mackey et al. 2013).
two smaller datasets, averaged by a factor of 8 in both time and             To ensure that the MCMC walkers explore the parameter
frequency to give 8s integrations and channels of 97 kHz width.         space well, we ran the optimisation several times, starting with
The Dutch core stations, which are all within approximately 4           a different set of initial parameter values every time. The dif-
                                                                        ferent MCMC runs gave very similar sets of parameters and,
1
    https://github.com/lofar-astron/prefactor                           consequently, very similar looking lensed images from the fit-
2
    https://www.astron.nl/citt/prefactor/                               ted model. One such example is shown in Fig. 3. The range of
                                                                                                                  Article number, page 3 of 8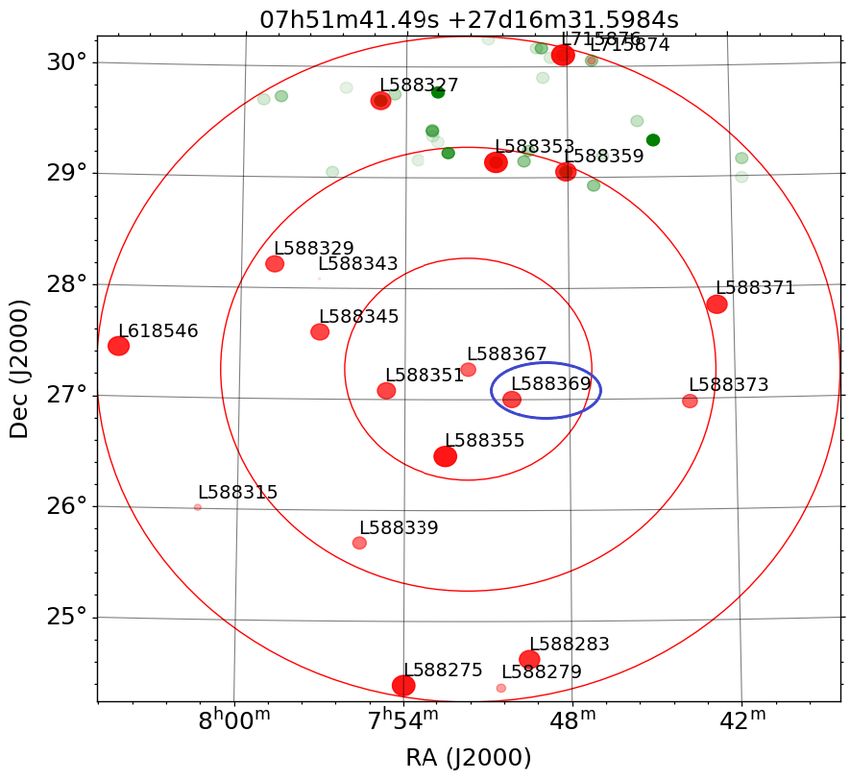
A&A proofs: manuscript no. lofarlens

Fig. 2. LOFAR-HBA maps of L588369     √ and MG 0751+2716. Left: Image of the phase calibrator L588369. The lowest contour is at 690 µJy/beam
and√contours increase by factors of 2. Right: Image of MG 0751+2716. The lowest contour is at 790 µJy/beam and contours increase by factors
of 2. The beam size is 000. 306 × 000. 184 with a position angle of 0.41◦ .

Table 1. Parameters of the lens model, Model 1, determined by Spin-            the emission from the 27.4 GHz radio source originates from
gola et al. 2018, together with the range of the fitted values from the        an approximately 500 pc region. We also see that the total size
data in a procedure with Model 1 as a starting point.
                                                                               of the radio source in this study is approximately equal to 000. 3,
                                                                               which corresponds to around 2 kpc at this redshift, a figure that
      Parameters                 Lens model        Fitted values
                                                                               is consistent with the size of the radio source studied in Spingola
      Lens parameters:           ...               ...
                                                                               et al. (2020). This also shows that the quasar radio structure cor-
      b (00 )                    0.40249           0.403±0.007
                                                                               responds to an extended, elliptical source (under the assumption
      ∆xL (00 )                  0.052             ...
                                                                               of a single elliptical Gaussian source model).
      ∆yL (00 )                  0.3804            ...
                                                                                   Several studies of MG 0751+2716 at radio and optical wave-
      e                          0.159             ...
                                                                               lengths have been conducted in the past (Carilli et al. 2005;
      θ (◦ )                     35.7              ...
                                                                               Riechers et al. 2006; Spingola et al. 2018, 2020; Powell et al.
      Γ                          0.0837            ...
                                                                               2021). Our results show consistency with Spingola et al. 2020;
      Γθ (◦ )                    79.2              ...
                                                                               this study finds, at high radio frequencies (27 GHz), radio AGN
                                                                               jets embedded in the extended molecular gas. This consistency
      Source parameters:         ...               ...
                                                                               implies an absence of an additional steep-spectrum component
      ∆xS (00 )                  ...               0.041±0.022
                                                                               emitted in the radio; the low-frequency radio source is co-spatial
      ∆yS (00 )                  ...               −0.012±0.001
                                                                               with the core-jet structure that forms the radio structure at higher
      Flux density (mJy)         ...               7.1±1.3
                                                                               frequencies, and no significant lobe emission or further compo-
      FWHM (00 )                 ...               0.048±0.018
                                                                               nents associated with star formation are visible within the mag-
      Axis ratio                 ...               0.46±0.23
                                                                               nified region of the lens.
      Position angle (◦ )        ...               73.3 ± 4.5
Notes. b is the critical radius of the lens galaxy, ∆xL and ∆yL are the        3. CLASS B1600+434
positions of the lens (in right ascension and declination) with respect to
the phase centre of the observations, ∆xS and ∆yS are the fitted positions     3.1. The lens system B1600+434
of the source with respect to the lens, e is the ellipticity of the lens, θ
is the position angle of the ellipticity, Γ is the external shear magnitude,   CLASS B1600+434 (16h 01m 40.45s 43◦ 160 4700. 78) is a gravita-
and Γθ is the external shear position angle. All angles are in degrees,        tional lens system that was discovered during the Cosmic Lens
east of north.                                                                 All-Sky Survey (Jackson et al. 1995; Browne et al. 2003; Myers
                                                                               et al. 2003). The source is lensed into two images at both radio
                                                                               and optical frequencies, with a separation of 100. 4 and a flux ra-
the final parameter values found from the runs is shown in Table               tio of 1.30 ± 0.04 at 8.4 GHz (Jackson et al. 1995). The main
1.                                                                             lens is an edge-on spiral galaxy at z = 0.41, and the source is a
    The initial values for the source major axis in the different              quasar at z = 1.59 (Jaunsen & Hjorth 1997; Fassnacht & Cohen
MCMCs were 500 mas, 100 mas, 80 mas, and 50 mas. We found                      1998; Koopmans et al. 1998). The fainter south-eastern image
that in all these cases, the optimisation converged to a source full           (image B) is close to the line of sight through the lensing galaxy,
width at half maximum (FWHM) of around 30 to 60 mas. At the                    and appears reddened in the optical by passage through the lens,
redshift of the source, this corresponds to 225 to 450 pc. Most                with a differential reddening between image B and A of about 1
of the chains converged towards a FWHM of 60 mas (450 pc).                     magnitude in the optical V band (Jaunsen & Hjorth 1997). This
Figure 12 of Spingola et al. (2020) demonstrates that most of                  is confirmed by infrared Hubble Space Telescope (HST) images
Article number, page 4 of 8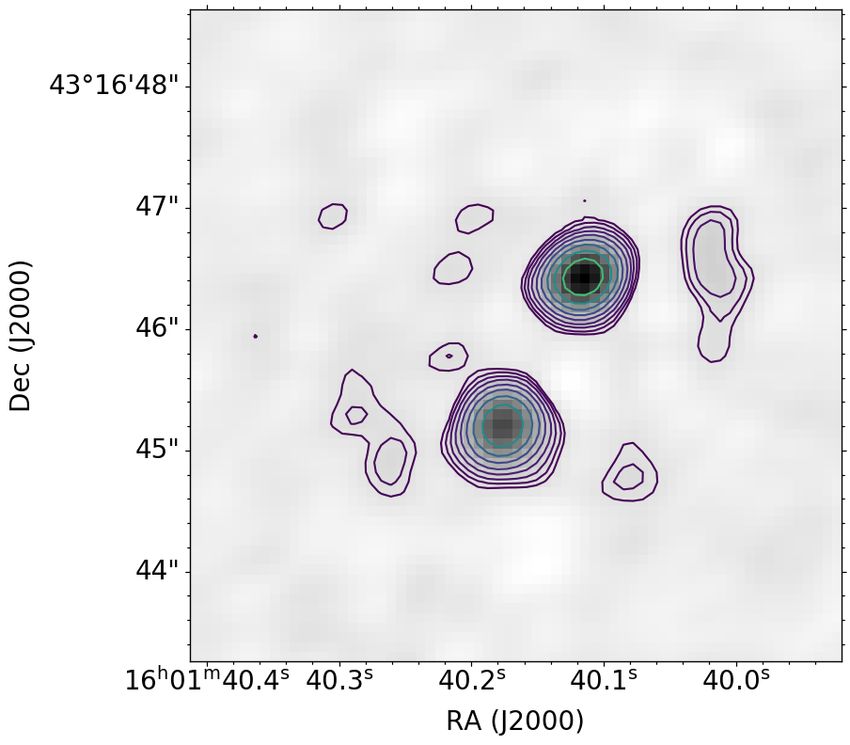
Badole et al.: LOFAR observations of gravitational lenses
Fig. 3. One of the results of the various MCMC runs to fit a source to a lens model for MG 0751+2716. The lens model, Model 1 (shown in Table
1), from Spingola et al. 2018 was used to fit our data using the visilens package. The images from left to right correspond to the dirty image of the
lensed source, the dirty image of the lensed source obtained by fitting the lens model, the corresponding residual map, a high-resolution model,
and the source plane model.
available (i.e. all currently available international stations except
the Polish and Irish stations) were used for the observations. Ob-
servations of this object were carried out as part of the LOFAR
Surveys Key Science Project (LSKSP; Shimwell et al. 2017)
with a pointing centre of 16h 03m 32.88 s 42◦ 330 2100 . This point-
ing centre is about 0.9◦ from the target. At this radius, we expect
an amplitude reduction of approximately a factor of 2-4 due to a
combination of integration time smearing and bandwidth smear-
ing, with the integration time and channel width used in the ob-
servation.
To calibrate the Dutch stations, prefactor was carried out us-
ing the Offringa high-resolution sky model3 for 3C 196, and us-
ing CS001 for the reference station. With the calibrator source,
all core and remote stations produced good solutions for TEC
and bandpass except for CS024. For the target source, these
again provided good results except for stations RS205, RS208,
and RS306. These stations and corresponding baselines were
Fig. 4. HST infrared (1.6 µm) image of CLASS B1600+434. The image
flagged during further analysis. In addition, data above 170 MHz
is 300. 69 on a side and the scale is 43 mas/pixel. Image reproduced from were discarded due to the phase between the XX and YY polari-
Jackson et al. (2000). sation calibrations being significantly large (much greater than 1
radian for a major part of the observation); these data are likely
to be severely affected by RFI.
at 1.6 µm (Jackson et al. 2000), which reveal that the infrared Following prefactor, the LOFAR-VLBI Pipeline (Morabito
image A/B flux ratio is indistinguishable from that seen in the 2021) was used for the sub-arcsecond data calibration. L256173
radio (Fig. 4). The main aim of observing CLASS B1600+434 (15h 59m 30.92s 43◦ 490 15.8000 , 4C+43.36) was selected as a cali-
is to use the two lines of sight from the same background ob- brator from the LBCS survey. This source is approximately 1.5◦
ject, corresponding to images A and B, to assess whether there from the field centre, and is likely to be subject to greater ampli-
is any evidence at these low radio frequencies for environmen- tude reductions than the target due to smearing effects.
tal effects, namely scatter broadening or free-free absorption in For calibration of this source, the data was preprocessed us-
the lensing galaxy. These effects would result in an increase in ing the Default Preprocessing Pipeline (DPPP). To obtain good
size, or reduction in flux, of the B image, which passes close solutions for TEC, direction-dependent gains were calibrated us-
to the lensing galaxy. Recently upper limits have been derived ing the DDECal step in DPPP (van Diepen et al. 2018). The so-
(Biggs 2021), using VLBI at GHz frequencies, for environmen- lutions were smoothly varying, and values were below 2 TECU
tal effects. Although our resolution is approximately a factor of for all international stations except UK608 and DE609; these
300 worse than this study, the 10-30 times lower frequency in stations did not produce good solutions. The output of this pro-
this work combined with the ∼ ν−2 dependence of absorption cess was phase shifted and averaged by factors of 8 in fre-
and scattering effects mean that we can derive limits of similar quency and time, producing small datasets of both L256173 and
stringency. CLASS B1600+434 at a frequency resolution of two channels
per unflagged sub-band or a total of 360 channels.
The calibrator L256173 was successfully mapped with the
3.2. Observations and data reduction pipeline (Fig. 5) and was found to be extended by ∼100. 5. For
CLASS B1600+434, it proved difficult to obtain good delay and
The HBA was used to observe a bright calibrator source 3C 196 phase solutions from the standard pipeline. Its output had jumps
at a frequency range 120 to 183 MHz on 2015 September 30 for in phase at regular intervals in frequency. Accordingly, the data,
10 minutes. Following this, observations of CLASS B1600+434
were taken on the same date for 8 hours at the same frequency 3
Available from https://github.com/lofar-astron/
range as the calibrator source. All core stations, remote stations prefactor/blob/master/skymodels/3C196-offringa.
within the Netherlands, and international stations that were then skymodel
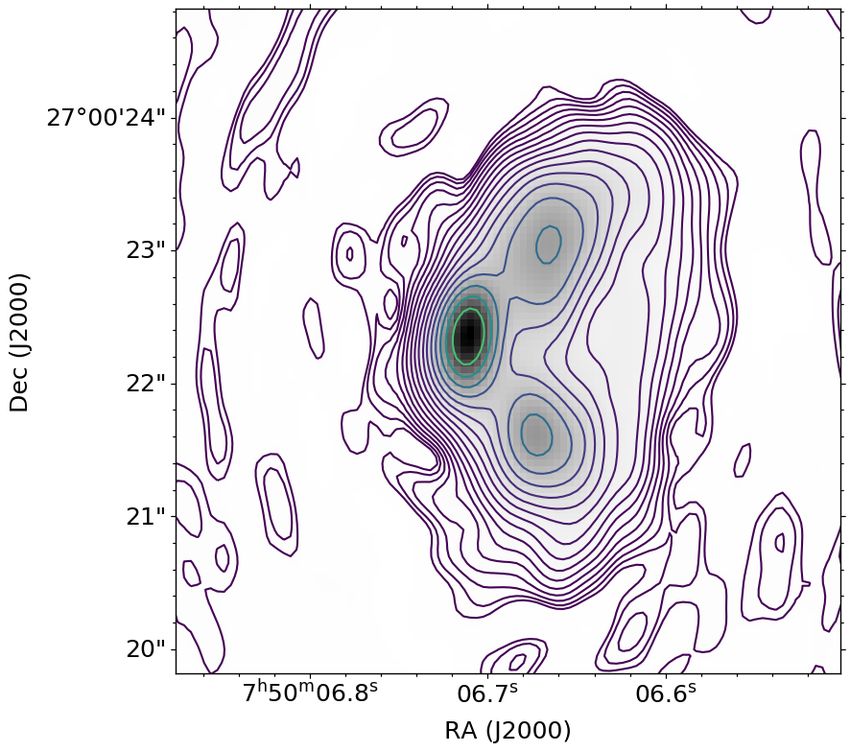
Article number, page 5 of 8A&A proofs: manuscript no. lofarlens
Fig. 6. International LOFAR Telescope image of CLASS B1600+434 at
140 MHz, with a restoring beam of 000. 46×000. 30 in PA −61.4◦ . The north-
Fig. 5. International LOFAR Telescope image of L256173 at 140 western image is A, while B is the south-eastern one. The√lowest con-
MHz, with a restoring beam of 000. 83×000. 61 in PA −59.1◦ . The tour is at 1.4 mJy/beam, and contours increase in steps of 2.
grey-scale runs from 0.0 to 0.7 mJy/beam and the contours are at
0.00786×(−1,1,2,4,8,26,32,64) mJy beam−1 .
vey (WENSS) overall flux density of 40-50 mJy at 325 MHz
with the initial corrections from DDECal, were read into the As- (Rengelink et al. 1997), although this object is known to be vari-
tronomical Image Processing System (AIPS)4 and separated into able (Koopmans et al. 2003). The final map has a noise level of
19 IFs with 40 channels each, which corresponded to the interval about 220 µJy/beam far from the sources, and is shown in Fig.
between each jump. A successful calibration for phase and delay 6. The noise increases close to the source, due to residual uncal-
was obtained with fring using a one-minute solution interval for ibrated phase and/or amplitude errors; the signal-to-noise level
both delay and phases, a signal-to-noise threshold of 2 for so- does not allow for the removal of short-timescale phase varia-
lutions, a delay window of 400 ns, and a previously made map tions or residual amplitude errors.
from a previous iteration of the mapping procedure. The proce-
dure yielded good solutions, which were edited and smoothed
3.3. Propagation effects
before application to the target source. Data were averaged to
1 minute in time and 196 kHz channels and imaged using ro- The flux ratio of images A and B in CLASS B1600+434 is
bust 0 weighting using only >80 km baselines. They were then 1.19±0.04 in these 150 MHz LOFAR observations, which is
phase self-calibrated with a ten-minute solution interval and us- statistically indistinguishable from the ratio at 8.5 GHz (Biggs
ing one phase solution for the whole band (because of the faint- 2021; the flux ratio found in this study varied from 1.19 to 1.26,
ness of B1600+434 there was not a sufficient signal-to-noise ra- depending on the observing season), and indistinguishable from
tio on less than that), together with a model consisting of the the predicted ratio of 1.25±0.03 for mass models of the system
clean components from an initial image. Images with the phase (Koopmans et al. 1998). This is despite the fact that the light
self-calibrated dataset were produced (Fig. 6). path of image B passes close to the centre of the edge-on spiral
The initial flux density scale was produced by the prefactor galaxy that acts as the lens.
pipeline. It is more difficult to establish for this object because
of the large distances of the source and phase calibrator from the Two propagation effects are capable of affecting radio waves
LoTSS field centre, which is likely to result in significant flux passing through ionised gas in the lensing galaxy: free-free ab-
loss due to time- and bandwidth-smearing. The phase calibrator sorption (e.g. Mittal et al. 2007; Winn et al. 2003b) and scatter-
L256173 has a flux density of 3.67 Jy in a low-resolution survey ing. In case of free-free absorption the optical depth is given by
at 151 MHz (Hales et al. 1988) compared to 2.3 Jy at the same τ = 0.08235 T e−1.35 ν−2.1 E, where T e is the electron temperature
frequency here. in Kelvin, ν is the frequency in GHz, and E is the emission mea-
The flux density scale was therefore established using data sure in cm−6 pc of the ionised medium (Mezger & Henderson
from the 600 resolution images from the Dutch-only stations, part 1967). The fact that the image flux ratios in this system are the
of the main LoTSS survey (Shimwell et al. 2017), in which a same as those at higher frequencies (Biggs 2021) implies an op-
total flux density of 57 mJy is measured; images were scaled tical depth τ
1 at the rest frequency of the emission from the
to match this measurement. In the scaled image, the A and B lens galaxy. This in turn implies E
42000 cm−6 pc for typi-
flux densities from this LOFAR observation were measured us- cal T e ∼ 5000 K, which is unsurprising given a passage through
ing jmfit to be 33.2±0.5 and 27.9±0.5 mJy with errors from the a typical galactic column of ∼10 kpc with ne ∼ 0.03 cm−3 , but
fit only and excluding systematic error on the flux calibration. much less than those in Hii regions in the CLASS B0218+357
The values are consistent with the Westerbork Northern Sky Sur- lens galaxy (Mittal et al. 2007).
The theory of scattering is discussed by a number of au-
4
Distributed by the US National Radio Astronomy Observatory: thors (Rickett 1977; Walker 2001; Cordes & Lazio 2001; Biggs
http://aips.nrao.edu et al. 2003; Mittal et al. 2007; Quinn et al. 2016); its effect is to
Article number, page 6 of 8Badole et al.: LOFAR observations of gravitational lenses
broaden point-source background structures with a characteristic
width, θ, of
θ !−11/5
ν0
= 64 SM3/5 , (1)
1mas 1GHz
where ν0 is the frequency at the redshift of the scatterer, and
SM is the scattering measure in units of kpc m−20/3 (Walker
2001). Estimates of scattering measure have typically been de-
rived for lenses using VLBI observations at GHz frequencies.
For example, broadening of a few milliarcseconds in the im-
age of CLASS B0218+357, which passes through a molecular
cloud in the lensing galaxy, implies SM∼100 kpc m−20/3 (Biggs
et al. 2003; Mittal et al. 2007), and similar results are derived
in CLASS B0128+437 by Biggs et al. (2004) and other lens
systems (Jones et al. 1996; Marlow et al. 1999; Wucknitz et al.
2003).
Using jmfit, we fitted two elliptical Gaussians at the posi- Fig. 7. LBCS sources in the neighbourhood of MG1549+3047. Sources
tions of the images and found the deconvolved widths of B and from the Westerbork Northern Sky Survey (declination limit of about
A to be 386.83 mas and 287.8 mas respectively. Consequently, 29◦ are in green and LBCS sources are in red.
we find an upper limit of 258.5 mas on the value of θ. This corre-
sponds to a differential SM.0.035 kpc m−20/3 ; considering a lens
galaxy redshift of 0.41 implies ν0 = 212 MHz. Here, we assume German baselines). The two nearest good calibrators lie within
that image A is not affected by scattering. The line of sight of im- one degree. The farther one, L465494, gave a good correlated
age B passes 250±50 mas (1.4±0.3 kpc) from the centre of the signal on all international baselines (although the PL610, PL611,
edge-on spiral lens (Jackson et al. 2000), about 1 kpc above its PL612, and IE613 stations were not operational at the time of the
plane. A study of CLASS B1600+434 has also been carried out observations), and the nearer one, L465498, gave a good signal
by Biggs (2021) using higher resolution observations, but at a on the shorter baselines (200-300 km).
higher frequency; these also yield an upper limit on the presence MG 1549+3047 was observed on 2018 March 13 for a stan-
of scatter broadening in the system. Assuming an upper limit of dard eight-hour track, with short ten-minute calibration scans
1.67 mas on θ at an observing frequency of 1.4 GHz (based on of 3C196 and 3C295 on either side of the observation. The
the sizes of A and B found by Biggs 2021 at 1.4 GHz), we find Dutch stations were calibrated as described in the previous sec-
an upper limit of SM.0.028 kpc m−20/3 , a value approximately tion using the prefactor procedures using the 3C295 calibration
equal to the one we found in this study. scan, together with the high-resolution model of 3C295 (credit:
The most direct comparison available is with our own F. Sweijen5 ). The RS306 station was again excluded from the
Galaxy. Extensive modelling of Galactic free electrons has been dataset. Bandpass and TEC solutions were inspected and found
done using pulsar studies (Cordes & Lazio 2001), and VLBI ob- to be satisfactory, with coherent phase solutions derived on the
servations of extragalactic point sources seen through the bar of Dutch stations from initial calibration of the target field against
our Galaxy also imply extensions of about 1 mas (Pushkarev & the TGSS data.
Kovalev 2015) at observing frequencies of 2 and 8 GHz, im- The field source L465494 was used to solve for the delays. In
plying scattering measures of about 1 kpc m−20/3 along this line this case, and unlike the case of MG 0751+2716, satisfactory de-
of sight. Scatter-broadening is not confined to milliarcsecond lay solutions could not be obtained unless short baselines (those
scales, however: an extreme scattering event in NGC 6334 (Trot- which did not involve an international station) were excluded;
ter et al. 1998) results from the passage of a point background ra- in this case, smoothly varying TEC solutions were derived for
dio source through an area of molecular clouds and Hii regions all international stations. Smaller datasets, averaged in time and
in our Galaxy. At 20 cm a consequent 300 broadening is observed, frequency were again derived for the target, for the field calibra-
corresponding to SM>1000 kpc m−20/3 in an exceptional line of tor sources within 1 degree (L465494, L465498 and L465466,
sight. see Fig. 7), and for a brighter but more distant calibrator source
(L465490). However, tests showed that in this case, it was not
possible to transfer phase solutions satisfactorily from the cali-
4. Unsuccessful sources brator to the target or to other calibrator sources. Some signal can
be recovered by self-calibration on the target itself, but the recov-
4.1. MG 1549+3047: Observations and data reduction
ered map is highly dependent on the assumed starting model.
The gravitational lens system MG 1549+3047 (15h 49m 12.6s +
30◦ 470 1500 ) was also discovered as part of the MG survey of ra-
4.2. Cycle 0 observations
dio sources, and consists of a lensed radio lobe in a radio galaxy
(Lehar et al. 1993) at redshift 1.17 (Treu & Koopmans 2003) Two further sources were observed in 2013 as part of Cycle 0, af-
imaged by a foreground galaxy at z = 0.11 (Lehar et al. 1996). ter the first LOFAR call for proposals: Q0957+561 (Walsh et al.
Figure 7 shows the LBCS map of the field. The source itself 1979) and MG 1131+0546 (Hewitt et al. 1988). These observa-
was observed with LBCS and was found to have significant cor- tions suffered from significant problems, the main one being the
related flux in the three minutes of integration used for LBCS quality of station calibration for the international stations which
only on the shortest international baselines (from the array cen-
5
tre to DE609 Norderstedt, with some correlated flux on the other https://github.com/lofar-astron/prefactor
Article number, page 7 of 8A&A proofs: manuscript no. lofarlens
was not of the same standard as the current calibration. This re- Hales, S. E. G., Baldwin, J. E., & Warner, P. J. 1988, MNRAS, 234, 919
sulted in very low signal on the calibrator for some international Hartley, P., Jackson, N., Sluse, D., Stacey, H. R., & Vives-Arias, H. 2019, MN-
RAS, 485, 3009
stations, and a consequent failure to fit delay solutions. It is likely Hewitt, J. N., Turner, E. L., Schneider, D. P., Burke, B. F., & Langston, G. I.
that good international-baseline maps cannot be produced from 1988, Nature, 333, 537
Hezaveh, Y. D., Marrone, D. P., Fassnacht, C. D., et al. 2013, ApJ, 767, 132
data taken this early. Q0957+561 is now available as part of the Intema, H. T., Jagannathan, P., Mooley, K. P., & Frail, D. A. 2017, A&A, 598,
LSKSP field, and this object is therefore under investigation with A78
the new data. Jackson, N., e. a. 2021, accepted
Jackson, N. 2011, ApJ, 739, L28
Jackson, N., de Bruyn, A. G., Myers, S., et al. 1995, MNRAS, 274, L25
Jackson, N., Tagore, A., Deller, A., et al. 2016, A&A, 595, A86
5. Conclusions Jackson, N., Tagore, A. S., Roberts, C., et al. 2015, MNRAS, 454, 287
Jackson, N., Xanthopoulos, E., & Browne, I. W. A. 2000, MNRAS, 311, 389
Jaunsen, A. O. & Hjorth, J. 1997, A&A, 317, L39
Two radio-loud gravitational lenses, MG 0751+2716 and Jones, D. L., Preston, R. A., Murphy, D. W., et al. 1996, ApJ, 470, L23
CLASS B1600+434, have been observed with the LOFAR HBA King, L. J., Browne, I. W. A., Muxlow, T. W. B., et al. 1997, MNRAS, 289, 450
Kochanek, C. S., Blandford, R. D., Lawrence, C. R., & Narayan, R. 1989, MN-
at a frequency centred around 150 MHz. We obtained the first RAS, 238, 43
high-resolution images of lens systems at such a low frequency Koopmans, L. V. E., Biggs, A., Blandford, R. D., et al. 2003, ApJ, 595, 712
Koopmans, L. V. E., de Bruyn, A. G., & Jackson, N. 1998, MNRAS, 295, 534
with the ILT. The low-frequency structure of the recovered Koopmans, L. V. E. & Treu, T. 2003, ApJ, 583, 606
source in MG 0751+2716 is very similar to that at higher fre- Langston, G. I., Heflin, M. B., Conner, S. R., et al. 1990, ApJS, 72, 621
Lehar, J., Burke, B. F., Conner, S. R., et al. 1997, AJ, 114, 48
quencies, and no evidence is found for extra steep-spectrum Lehar, J., Cooke, A. J., Lawrence, C. R., Silber, A. D., & Langston, G. I. 1996,
radio-emitting components. In CLASS B1600+434 we find a AJ, 111, 1812
flux ratio between the double images of the background quasar Lehar, J., Langston, G. I., Silber, A., Lawrence, C. R., & Burke, B. F. 1993, AJ,
105, 847
that is consistent with the value at higher frequencies. The widths Lenc, E., Garrett, M. A., Wucknitz, O., Anderson, J. M., & Tingay, S. J. 2008,
of the two components give a consequent limit on the differen- ApJ, 673, 78
tial scattering measure, and the flux ratios give a limit on the Mao, S. 2012, Research in Astronomy and Astrophysics, 12, 947
Mao, S. A., Carilli, C., Gaensler, B. M., et al. 2017, Nature Astronomy, 1, 621
electron density and/or clumpiness of two lines of sight through Marlow, D. R., Browne, I. W. A., Jackson, N., & Wilkinson, P. N. 1999, MNRAS,
the bulge of the edge-on spiral lens galaxy. Attempts at calibra- 305, 15
Menten, K. M. & Reid, M. J. 1996, ApJ, 465, L99
tions of three further observations, two of them being Cycle 0 Mezger, P. G. & Henderson, A. P. 1967, ApJ, 147, 471
observations, were unsuccessful. Further investigations are un- Mittal, R., Porcas, R., & Wucknitz, O. 2007, A&A, 465, 405
Mittal, R., Porcas, R., Wucknitz, O., Biggs, A., & Browne, I. 2006, A&A, 447,
der way to improve the reliability of the imaging pipeline, and to 515
understand the possible effects of the varying ionosphere on the Morabito, L., e. a. 2021, accepted
calibratibility of some observations. Mosquera, A. M., Muñoz, J. A., Mediavilla, E., & Kochanek, C. S. 2011, ApJ,
728, 145
Acknowledgements. We thank the anonymous referee for their comments on the Muñoz, J. A., Mediavilla, E., Kochanek, C. S., Falco, E. E., & Mosquera, A. M.
paper. This paper is based on data obtained with the International LOFAR Tele- 2011, ApJ, 742, 67
scope (ILT) under project code LC9-012. Part of this work was supported by LO- Myers, S. T., Jackson, N. J., Browne, I. W. A., et al. 2003, MNRAS, 341, 1
Noble, R. G. & Walsh, D. 1980, Nature, 288, 69
FAR, the Low Frequency Array designed and constructed by ASTRON, that has Powell, D., Vegetti, S., McKean, J. P., et al. 2021, MNRAS, 501, 515
facilities in several countries, that are owned by various parties (each with their Pushkarev, A. B. & Kovalev, Y. Y. 2015, MNRAS, 452, 4274
own funding sources), and that are collectively operated by the ILT foundation Quinn, J., Jackson, N., Tagore, A., et al. 2016, MNRAS, 459, 2394
under a joint scientific policy. Data analysis for this project used the LOFAR- Rengelink, R. B., Tang, Y., de Bruyn, A. G., et al. 1997, A&AS, 124, 259
Rickett, B. J. 1977, ARA&A, 15, 479
UK computing cluster based at the University of Hertfordshire. JPM acknowl- Riechers, D. A., Carilli, C. L., Maddalena, R. J., et al. 2011, ApJ, 739, L32
edges support from the Netherlands Organization for Scientific Research (NWO) Riechers, D. A., Weiss, A., Walter, F., Carilli, C. L., & Knudsen, K. K. 2006,
(Project No. 629.001.023) and the Chinese Academy of Sciences (CAS) (Project ApJ, 649, 635
No. 114A11KYSB20170054). LKM is grateful for support from the UKRI Fu- Rusin, D., Norbury, M., Biggs, A. D., et al. 2002, MNRAS, 330, 205
ture Leaders Fellowship (grant MR/T042842/1). Rybak, M., Hodge, J. A., Vegetti, S., et al. 2020, MNRAS, 494, 5542
Saha, P. & Williams, L. L. R. 1997, MNRAS, 292, 148
Shepherd, M. C. 1997, in Astronomical Society of the Pacific Conference Series,
Vol. 125, Astronomical Data Analysis Software and Systems VI, ed. G. Hunt
& H. Payne, 77
References Shimwell, T. W., Röttgering, H. J. A., Best, P. N., et al. 2017, A&A, 598, A104
Spilker, J. S., Marrone, D. P., Aravena, M., et al. 2016, ApJ, 826, 112
Alloin, D., Kneib, J. P., Guilloteau, S., & Bremer, M. 2007, A&A, 470, 53 Spingola, C., McKean, J. P., Auger, M. W., et al. 2018, MNRAS, 478, 4816
Badole, S., Jackson, N., Hartley, P., et al. 2020, MNRAS, 496, 138 Spingola, C., McKean, J. P., Vegetti, S., et al. 2020, MNRAS, 495, 2387
Stacey, H. R., Lafontaine, A., & McKean, J. P. 2020, MNRAS, 493, 5290
Bartelmann, M. 2010, Classical and Quantum Gravity, 27, 233001 Stacey, H. R., McKean, J. P., Robertson, N. C., et al. 2018, MNRAS, 476, 5075
Barvainis, R., Alloin, D., & Bremer, M. 2002, A&A, 385, 399 Suyu, S. H., Hensel, S. W., McKean, J. P., et al. 2012, ApJ, 750, 10
Biggs, A. D. 2021, MNRAS, 505, 2610 Tonry, J. L. & Kochanek, C. S. 1999, AJ, 117, 2034
Biggs, A. D., Browne, I. W. A., Jackson, N. J., et al. 2004, MNRAS, 350, 949 Treu, T. 2010, ARA&A, 48, 87
Treu, T. & Koopmans, L. V. E. 2003, MNRAS, 343, L29
Biggs, A. D., Wucknitz, O., Porcas, R. W., et al. 2003, MNRAS, 338, 599 Trotter, A. S., Moran, J. M., & Rodríguez, L. F. 1998, ApJ, 493, 666
Browne, I. W. A., Wilkinson, P. N., Jackson, N. J. F., et al. 2003, MNRAS, 341, van de Ven, G., Mandelbaum, R., & Keeton, C. R. 2009, MNRAS, 398, 607
13 van Diepen, G., Dijkema, T. J., & Offringa, A. 2018, DPPP: Default Pre-
Carilli, C. L., Solomon, P., Vanden Bout, P., et al. 2005, ApJ, 618, 586 Processing Pipeline
Chen, G. H., Kochanek, C. S., & Hewitt, J. N. 1995, ApJ, 447, 62 van Haarlem, M. P., Wise, M. W., Gunst, A. W., et al. 2013, A&A, 556, A2
Cohen, A. S., Lane, W. M., Cotton, W. D., et al. 2007, AJ, 134, 1245 Walker, M. A. 2001, Ap&SS, 278, 149
Walsh, D., Carswell, R. F., & Weymann, R. J. 1979, Nature, 279, 381
Cohn, J. D., Kochanek, C. S., McLeod, B. A., & Keeton, C. R. 2001, ApJ, 554, Warren, S. J. & Dye, S. 2003, ApJ, 590, 673
1216 Wiklind, T. & Combes, F. 1995, A&A, 299, 382
Colla, G., Fanti, C., Fanti, R., et al. 1972, A&AS, 7, 1 Wiklind, T. & Combes, F. 1996, Nature, 379, 139
Cordes, J. M. & Lazio, T. J. W. 2001, ApJ, 549, 997 Wiklind, T. & Combes, F. 1998, ApJ, 500, 129
Winn, J. N., Kochanek, C. S., Keeton, C. R., & Lovell, J. E. J. 2003a, ApJ, 590,
Dai, X. & Kochanek, C. S. 2009, ApJ, 692, 677
26
de Gasperin, F., Dijkema, T. J., Drabent, A., et al. 2019, A&A, 622, A5 Winn, J. N., Rusin, D., & Kochanek, C. S. 2003b, ApJ, 587, 80
Douglas, J. N., Bash, F. N., Bozyan, F. A., Torrence, G. W., & Wolfe, C. 1996, Wu, J., Vanden Bout, P. A., Evans, Neal J., I., & Dunham, M. M. 2009, ApJ, 707,
AJ, 111, 1945 988
Dye, S., Furlanetto, C., Dunne, L., et al. 2018, MNRAS, 476, 4383 Wucknitz, O. 2004, MNRAS, 349, 1
Elíasdóttir, Á., Hjorth, J., Toft, S., Burud, I., & Paraficz, D. 2006, ApJS, 166, 443 Wucknitz, O., Biggs, A. D., & Browne, I. W. A. 2004, MNRAS, 349, 14
Wucknitz, O. & Volino, F. 2008, in The role of VLBI in the Golden Age for
Fassnacht, C. D. & Cohen, J. G. 1998, AJ, 115, 377
Radio Astronomy, Vol. 9, 102
Foreman-Mackey, D., Hogg, D. W., Lang, D., & Goodman, J. 2013, PASP, 125, Wucknitz, O., Wisotzki, L., Lopez, S., & Gregg, M. D. 2003, A&A, 405, 445
306
Article number, page 8 of 8You can also read