Diagnosing air quality changes in the UK during the COVID-19 lockdown using TROPOMI and GEOS-Chem
←
→
Page content transcription
If your browser does not render page correctly, please read the page content below
LETTER • OPEN ACCESS

Diagnosing air quality changes in the UK during the COVID-19 lockdown
using TROPOMI and GEOS-Chem
To cite this article: Daniel A Potts et al 2021 Environ. Res. Lett. 16 054031

View the article online for updates and enhancements.

                               This content was downloaded from IP address 89.34.167.113 on 05/05/2021 at 15:45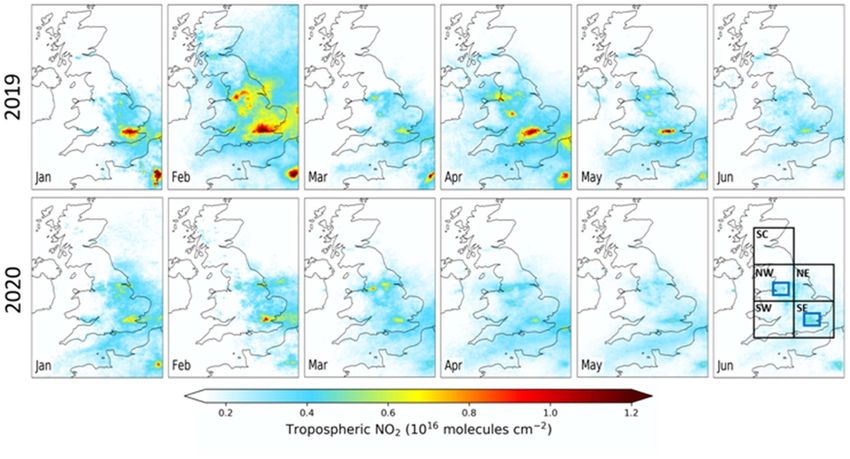
Environ. Res. Lett. 16 (2021) 054031 https://doi.org/10.1088/1748-9326/abde5d
LETTER
Diagnosing air quality changes in the UK during the COVID-19
OPEN ACCESS
lockdown using TROPOMI and GEOS-Chem
RECEIVED
6 November 2020 Daniel A Potts1, Eloise A Marais1,2, Hartmut Boesch1,3, Richard J Pope4,5, James Lee6, Will Drysdale6,
REVISED Martyn P Chipperfield4,5, Brian Kerridge7,8, Richard Siddans7,8, David P Moore1,3 and John Remedios1,3
11 January 2021
1
ACCEPTED FOR PUBLICATION
School of Physics and Astronomy, University of Leicester, Leicester, United Kingdom
2
21 January 2021 Department of Geography, University of College London, London, United Kingdom
3
National Centre for Earth Observation, University of Leicester, Leicester, United Kingdom
PUBLISHED 4
29 April 2021 School of Earth and Environment, University of Leeds, Leeds, United Kingdom
5
National Centre for Earth Observation, University of Leeds, Leeds, United Kingdom
6
National Centre for Atmospheric Science, University of York, York, United Kingdom
Original content from 7
Remote Sensing Group, STFC Rutherford Appleton Laboratory, Chilton, United Kingdom
this work may be used 8
under the terms of the National Centre for Earth Observation, STFC Rutherford Appleton Laboratory, Chilton, United Kingdom
Creative Commons
E-mail: hb100@le.ac.uk
Attribution 4.0 licence.
Any further distribution Keywords: air quality, COVID-19, satellite NO2 , atmospheric chemistry modelling
of this work must
maintain attribution to Supplementary material for this article is available online
the author(s) and the title
of the work, journal
citation and DOI.
Abstract
The dramatic and sudden reduction in anthropogenic activity due to lockdown measures in the
UK in response to the COVID-19 outbreak has resulted in a concerted effort to estimate local and
regional changes in air quality, though changes in underlying emissions remain uncertain. Here we
combine satellite observations of tropospheric NO2 from TROPOspheric Monitoring Instrument
and the Goddard Earth Observing System (GEOS)-Chem 3D chemical transport model to estimate
that NOx emissions declined nationwide by ∼20% during the lockdown (23 March to 31 May
2020). Regionally, these range from 22% to 23% in the western portion of the country to 29% in
the southeast and Manchester, and >40% in London. We apply a uniform 20% lockdown period
emission reduction to GEOS-Chem anthropogenic emissions over the UK to determine that decline
in lockdown emissions led to a national decline in PM2.5 of 1.1 µg m−3 , ranging from 0.6 µg m−3
in Scotland to 2 µg m−3 in the southwest. The decline in emissions in cities (>40%) is greater than
the national average and causes an increase in ozone of ∼2 ppbv in London and Manchester. The
change in ozone and PM2.5 concentrations due to emission reductions alone is about half the total
change from 2019 to 2020. This emphasizes the need to account for emissions and other factors, in
particular meteorology, in future air pollution abatement strategies and regulatory action.
1. Introduction decline in road traffic and slowdown or shutdown of
intensive industries. The associated reduction in air
The first cases of COVID-19 were reported in Decem- pollutant emissions has led to a flurry of research to
ber 2019 in Wuhan, China, the initial epicentre of the determine the short-term response in air quality and
outbreak, and rapidly spread to the US and Europe. atmospheric composition. A contemporary record of
By mid-March, all European countries had confirmed these is maintained by the Health Effects Institute
cases, leading to the implementation of travel restric- (https://tinyurl.com/y3xyty6x). The general pattern
tions and local, regional, or national lockdown meas- that emerges from these studies comparing air pollut-
ures. The UK government imposed strict lockdown ant concentrations before and after lockdown meas-
measures on 23 March 2020 in response to model ures is widespread regional decline in nitrogen oxide
simulations that showed that the rate of spread of the (NOx ≡ NO + NO2 ) concentrations. Also observed is
virus would overwhelm the healthcare system [1]. the anticipated increase in ozone due to reduced titra-
The movement restrictions imposed by the UK tion of ozone by NOx in cities where this titration is
and other governments led to an unprecedented prevalent [2–12]. Studies that use models to interpret
© 2021 The Author(s). Published by IOP Publishing Ltd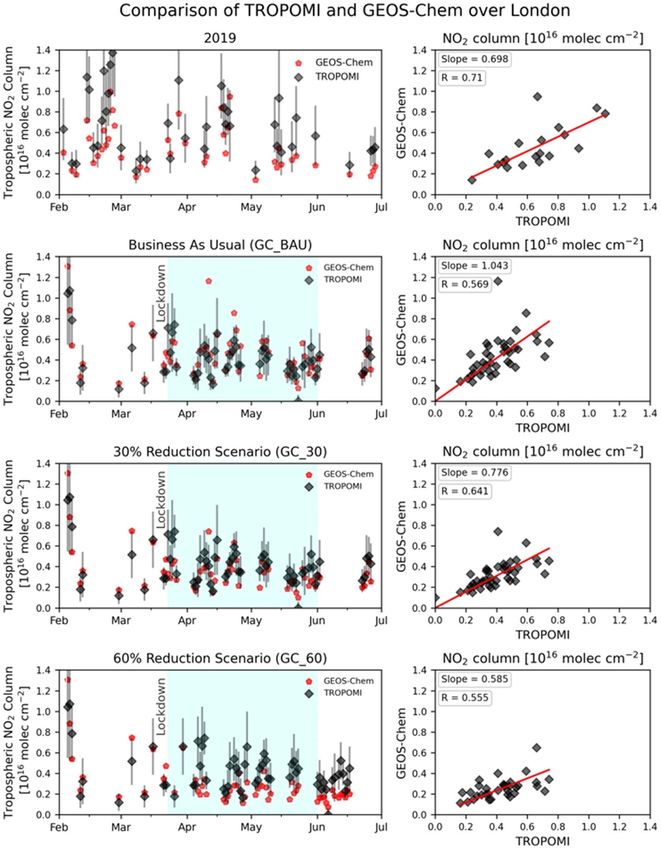
Environ. Res. Lett. 16 (2021) 054031                                                                     D A Potts et al

air quality observations have also diagnosed the con-        model (CTM) [10, 13, 14, 19] or to account for con-
tribution of meteorology to the observed changes in          founding effects of weather using appropriate statist-
atmospheric composition and air quality [13], estim-         ical methods [7, 11, 13, 20]. The UK network of refer-
ated the influence of emission changes on the oxid-          ence monitors, while relatively extensive compared to
izing capacity of the atmosphere [5], and quantified         most countries, has large monitoring gaps, so may not
regional decline in emissions due to lockdown meas-          be appropriate for diagnosing national and regional
ures [14]. Across China, for example, NO2 concen-            changes in air quality.
trations declined by 40%–60% [2–4], whereas PM2.5                 Here we use satellite observations of tropospheric
(particles with aerodynamic diameter < 2.5 µm)               column NO2 from the TROPOspheric Monitor-
increased in heavily populated and very polluted             ing Instrument (TROPOMI) to quantify national,
northern China. This was due to a combination of             regional and large city (London, Manchester) changes
stagnant conditions, unusually high humidity pro-            in NO2 in the UK due to the lockdown. Analysis of
moting heterogeneous chemistry, sustained indus-             the satellite observations is supported by observations
trial emissions, and an increase in the oxidizing capa-      of surface concentrations of NO2 from the air qual-
city of the atmosphere [5]. In India, an increase in         ity networks in London and Manchester and inter-
fire activity in 2020 masked the anticipated decline in      preted with targeted Goddard Earth Observing Sys-
NOx due to lockdown measures in cities close to these        tem (GEOS)-Chem CTM simulations. The model is
fires [15].                                                  used to account for non-linearities in atmospheric
     In the UK, preliminary reports on changes in air        chemistry driving changes in air quality [21], relate
quality were commissioned by the national Depart-            changes in the tropospheric column to changes in
ment for the Environment, Food and Rural Affairs.            emissions at the surface, discern the role of meteor-
These mostly compared surface network observations           ology and emission changes, and quantify the effect
in 2020 before and during the lockdown. Repor-               of lockdown measures on regional and national sur-
ted changes in air pollutants included an average            face concentrations of the criteria pollutants ozone
21% decline in NO2 from roadside reference net-              and PM2.5 that adversely affect our health and the
work monitors [16, 17], though this percent decline          environment.
includes ordinary seasonal decrease in NOx due to
changes in photochemistry during the shift from              2. Data and methods
winter to spring [18]. A surprising change in air qual-
ity in London was an observed increase in PM2.5 , des-       2.1. Space-based TROPOMI tropospheric column
pite the decline in NOx , that was attributed to long-       observations of NO2
range transport of PM2.5 -laden air from mainland            We use tropospheric NO2 column densities from
Europe [16]. The impact of the lockdown on air qual-         TROPOMI onboard the Sentinel-5 Precursor (S5P)
ity throughout the UK was later diagnosed by Lee             satellite [22, 23]. S5P was launched on 13 October
et al [6] using surface data from 126 in situ meas-          2017 and has an overpass time of 13:30 local solar
urement sites distributed across the UK. They found          time (LST). TROPOMI achieves daily global cover-
from comparison of observations averaged over 23             age with a swath width of 2600 km and a ground
March to 31 May that surface NO2 was 42% less and            pixel resolution of 7.2 km × 3.5 km at nadir (along
surface ozone 11% more in 2020 than the mean of              track × across track) until 5 August 2019, refined
the 5 preceding years. They speculated that routine          thereafter to 5.6 km × 3.5 km [24]. We use TROPOMI
exceedances of NO2 air quality limits in London              NO2 over the UK from the offline Level 2 product
would halve in 2020 relative to 2019 as a result of          (version 01–03-02) from the S5P Pre-Operations
the lockdown. They also identified a marked increase         Data Hub (https://s5phub.copernicus.eu/dhus/; last
in ozone exceedances during the lockdown, but sug-           accessed 20 July 2020) for 1 January to 30 June 2019
gested that the influence of this on the rest of 2020        and 2020. TROPOMI data are filtered to remove poor
depends on emissions and meteorological conditions           quality retrievals with a quality flag (‘qa_value’ in the
in summer when surface ozone concentrations in the           data file) >0.5 and cloudy scenes identified with a
UK peak [6].                                                 TROPOMI cloud radiance fraction ⩾0.5, as sugges-
     Changes in air quality by comparison of the lock-       ted by Eskes et al [25] for comparison of TROPOMI
down period to previous weeks or years will be               to models. TROPOMI validation studies generally
impacted by interannual variability due to extreme           find that TROPOMI overestimates NO2 at rural and
weather or shifts in transport patterns, seasonality in      remote locations and underestimates NO2 over pol-
photochemistry affecting formation and persistence           luted scenes from comparison to ground-based total
of air pollution, and ongoing decline in emissions due       and tropospheric column measurements [26–30].
to air quality policies. As a result, it is challenging to
disentangle the contribution of changes in emissions         2.2. Surface air quality measurements
and other factors to changes in air quality with obser-      Surface hourly in situ observations that we use
vations alone. A more suitable approach is to use an         to assess temporal variability of TROPOMI NO2
explicit and detailed atmospheric chemical transport         in Manchester and London and the ability of

                                                2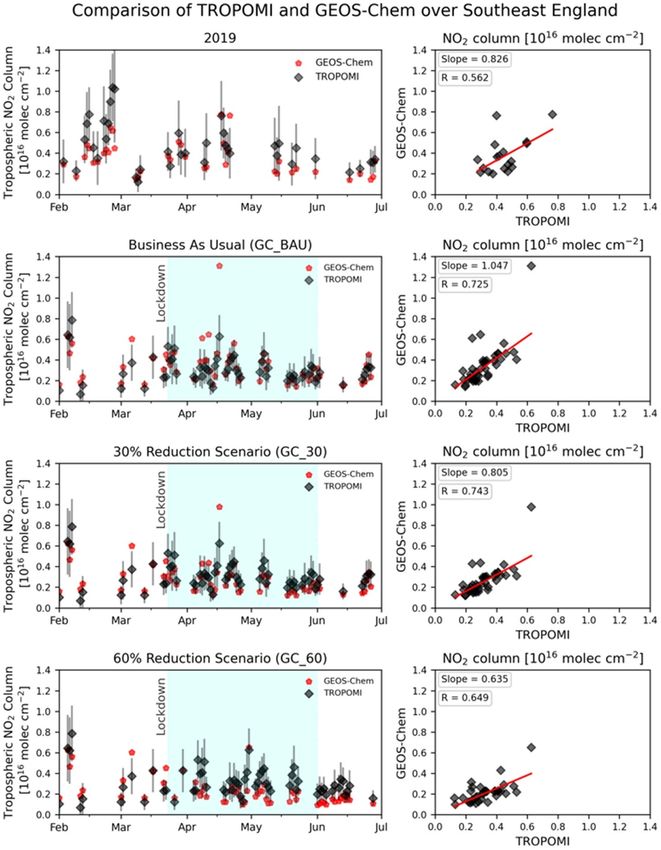
Environ. Res. Lett. 16 (2021) 054031                                                                  D A Potts et al

the model to reproduce changes in surface con-            measures (such as in Italy). There was also a range
centrations of ozone and PM2.5 across the UK              in the timing of national lockdowns (17 March for
are from the Automatic Urban and Rural Net-               France to 23 March for Germany) and severity of
work (AURN). All data are downloaded from                 measures. The Netherlands and Greece, for example,
the UK-AIR data portal (https://uk-air.defra.             did not impose a national lockdown [32]. The model
gov.uk/networks/network-info?view=aurn; accessed          is sampled from 1 February to 30 June for the refer-
11 August 2020 for NO2 and 25 September 2020              ence year (2019) and the GC_BAU emission scenario.
for ozone and PM2.5 ). We use NO2 data from eight         The GC_x simulatios are sampled from 15 March to
sites in London and three sites in Manchester. City-      30 June 2020.
wide average NO2 is estimated for each city from
observations obtained during the satellite overpass       3. Results and discussion
(13:00–14:00 LST). Ozone data are available from 71
monitors in both 2019 and 2020 and 80 monitors            3.1. Changes in column densities of NO2 in the UK
in 2019 and 81 in 2020 for PM2.5 . These are used to      Figure 1 shows TROPOMI monthly mean tropo-
calculate 24-hour averages at each site to compare to     spheric NO2 columns over the UK for 2019 and 2020.
coincident GEOS-Chem data.                                The decline in TROPOMI tropospheric column NO2
                                                          from January to June is expected, due to seasonal
2.3. The GEOS-Chem CTM                                    variability in photochemistry leading to a longer life-
We use GEOS-Chem version 12.1.0 (https://doi.             time and greater abundance of NOx in winter than in
org/10.5281/zenodo.1553349) nested over Europe            spring and summer. The location of cities with large
(32.75–61.25◦ N, 15◦ W–40◦ E) at 0.25◦ (∼25 km            traffic emissions of NOx , such as London in the south-
latitude) × 0.3125◦ (∼31 km longitude) horizontal         east and Manchester in the northwest, are particularly
resolution and extending from the Earth’s surface to      apparent in winter 2019.
0.01 hPa. Dynamic boundary conditions are from                 TROPOMI NO2 over the UK is in general lower
a global simulation at 4◦ × 5◦ . The model is             in 2020 than 2019, even for the months preceding the
driven with NASA Global Modelling and Assimila-           lockdown. Lower concentrations of NO2 in January
tion Office GEOS—Forward Processing assimilated           and February for 2020 compared to the mean of the
meteorology. The model also includes detailed gas-        five preceding years has also been observed for surface
and aerosol-phase chemistry and physical loss pro-        NO2 and attributed to unusually high wind speeds
cesses (wet and dry deposition). Emission inventor-       and frequent storms in 2020 [6]. In April, the peak of
ies are updated in this work to include anthropogenic     the lockdown period, the relative decrease from 2019
emissions over the UK and mainland Europe from the        to 2020 is 36 ± 13% (median ± standard error) for
gridded European Monitoring and Evaluation Pro-           the SE, 31 ± 11% for the SW, 19 ± 11% for the NE,
gramme inventory for 2016 scaled to the simulation        38 ± 11% for the NW, 31 ± 11% for SC, 40 ± 12%
year of interest using reported rates of annual emis-     for London, and 31 ± 14% for Manchester. In May,
sion reductions [31]. The model also includes natural     when there was a gradual transition to more lenient
emissions from vegetation, soils, seabirds, lightning     lockdown measures in the UK, there is generally a
and volcanoes.                                            smaller reduction in TROPOMI NO2 in 2020 relat-
     The model is simulated in 2019 as a reference        ive to 2019 (29 ± 15% for the NW, 17 ± 11% for
year in terms of anthropogenic emissions and in           SC, and 31 ± 17% for London). The SE (36 ± 9%)
2020 using five emission scenarios. These include         and Manchester (34 ± 14%) show greater decline in
business-as-usual (BAU) using normal annual decline       May than April. The decline in the SW in May is not
in anthropogenic emissions due to air quality policies,   significant (20 ± 19%) and there is a non-significant
and lockdown emission reduction scenarios that, in        increase in the NE of 9 ± 18%.
addition to the normal annual decline in emissions,            Figure 2 assesses the skill of TROPOMI at repro-
include anthropogenic emission reductions of NOx ,        ducing day-to-day variability in surface NO2 in Lon-
SO2 , non-methane volatile organic compounds, and         don and Manchester which have been used in the
primary PM2.5 in the UK and mainland Europe. We           study by Lee et al [6]. City-average daily mean surface
refer to these throughout as GC_BAU for the BAU           observations are compared to TROPOMI daily mean
scenario, GC_x for x% emission reduction, where x         tropospheric columns for TROPOMI pixel centres
is 15, 30, 45, and 60. In the GC_x simulations, emis-     within the city domains shown in figure 1. The range
sions reductions are applied to mainland Europe on        in surface NO2 concentrations is similar for the two
15 March and the UK on 23 March to represent the          cities (5–75 µg m−3 ), declining from winter to spring,
earlier lockdown measures across mainland Europe.         as is expected from seasonal changes in photochem-
Sectors that are reduced include industry, trans-         istry. There is also large day-to-day variability related
port, and other residential and commercial activ-         to weather and weekend–weekday variability in traffic
ity. The instantaneous reduction in emissions in          activity [34, 35], though midday TROPOMI and sur-
the model is approximate, as some countries gradu-        face observations will be less sensitive to this effect
ally transitioned from local to national lockdown         than observations during rush hour [36]. TROPOMI

                                             3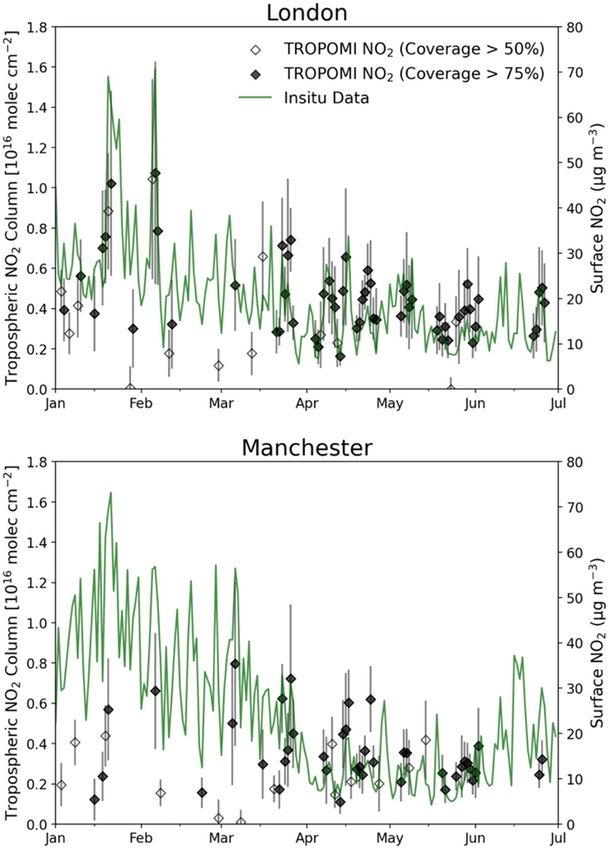
Environ. Res. Lett. 16 (2021) 054031                                                                                        D A Potts et al

   Figure 1. Monthly mean TROPOMI tropospheric column NO2 for the UK from January to June 2019 (top) and 2020 (bottom).
   Individual daily TROPOMI measurements are gridded to 0.04◦ × 0.04◦ (∼4 km) using the gridding technique described in Pope
   et al [33]. In the lower right panel, black boxes indicate the sampling extent of the five regions (SC for Scotland, NW for northwest
   England and Wales, NE for northeast England, SW for southwest England and Wales, and SE for southeast England) and blue
   boxes the sampling extent of London and Manchester.

NO2 are sparse in winter due to persistent clouds. A                   applying the modelled ratios of tropospheric column
relatively shallow planetary boundary layer in winter                  NO2 to surface emissions of NOx to TROPOMI tro-
also leads to reduced sensitivity to surface NO2 and                   pospheric NO2 columns to derive NOx emissions
degrades temporal consistency between the column                       [39] for two different time periods and estimating
and surface [37]. The surface in situ observations are                 the relative change in satellite-derived emissions. Our
also more prone to positive interference in winter                     regression approach eliminates unnecessary steps in
from thermal decomposition of reservoir compounds                      the calculation and also minimizes influence of sys-
to NO2 [38]. Despite these issues, the temporal cor-                   tematic biases in the model and observations. In all
relation between the surface and satellite observa-                    comparisons of the model to TROPOMI we apply
tions is reasonably strong. For the full record shown                  the TROPOMI averaging kernels to the model to
in figure 2, the Pearson’s correlation coefficient, R,                 ensure the comparison is independent of the TRO-
is 0.78 for London and 0.51 for Manchester using a                     POMI a priori [25, 40, 41]. City and regional aver-
75% spatial coverage threshold for TROPOMI. Simil-                     ages for the domains shown in figure 1 are obtained
arly, during just the lockdown period and again using                  using the Level 2 pixels and coincident GEOS-Chem
a 75% spatial coverage threshold, R is 0.71 for Lon-                   grids. The model is sampled during the satellite over-
don and 0.70 for Manchester. The increase in R for                     pass (12:00–15:00 LST), as is standard. The difference
Manchester during the lockdown period is because                       in modelled fields obtained for a narrower sampling
the pre-lockdown period has fewer coincident obser-                    range (13:00–14:00 LST) is negligible.
vations. The small decrease in R for London may be                          Figures 3 and 4 compare temporal variabil-
due to less dynamic variability in NO2 during the                      ity in daily mean TROPOMI and GEOS-Chem
lockdown period.                                                       regional (SE, figure 3) and city (London, figure 4)
                                                                       tropospheric columns. Only the results for the
3.2. Interpretation of observed changes in NO2                         GC_BAU, GC_30, and GC_60 scenarios are shown,
with GEOS-Chem                                                         as the response of the model to emission changes
We use GEOS-Chem to determine the contribu-                            is approximately linear. Comparisons for the other
tion of anthropogenic emissions changes associated                     regions and Manchester for all scenarios are in
with lockdown measures to the observed changes                         supplementary figures S1–S5 (available online at
in TROPOMI NO2 from 2019 to 2020. We do this                           stacks.iop.org/ERL/16/054031/mmedia). We use
by identifying the emission scenario in 2020 that                      2019 to quantify how the model compares to the satel-
yields results consistent with regression of GEOS-                     lite observations during a normal year. This accounts
Chem versus TROPOMI tropospheric NO2 columns                           for systematic biases in the modelled tropospheric
in 2019. This approach is conceptually similar to                      NO2 column that may result from model represent-
the standard approach of estimating emissions by                       ation of emissions, chemistry, and loss pathways,

                                                        4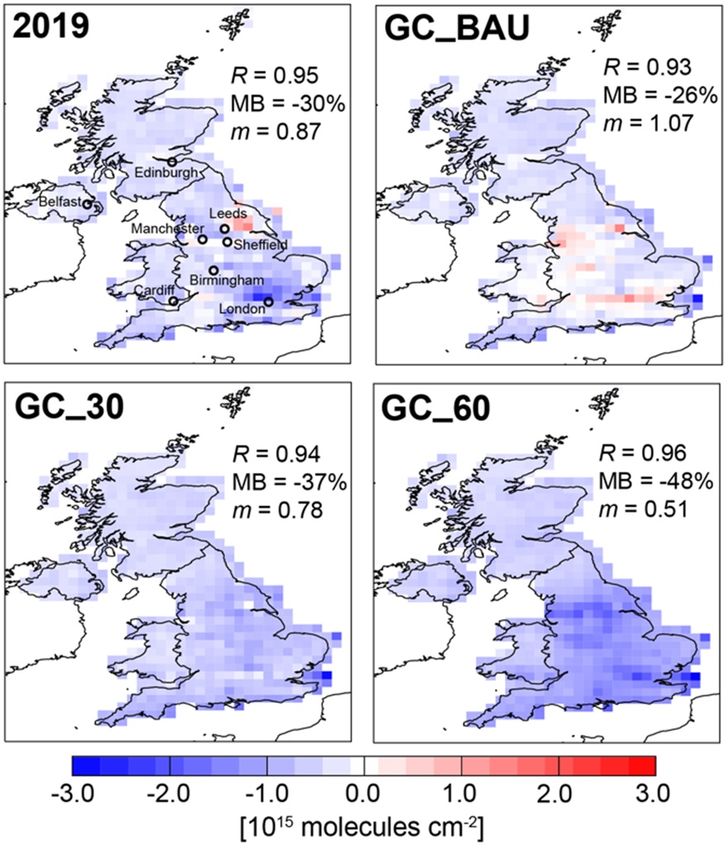
Environ. Res. Lett. 16 (2021) 054031                                                                               D A Potts et al

   Figure 2. Comparison of daily column and surface concentrations of NO2 over London and Manchester from 1 January to 30
   June 2020. Daily mean surface concentrations are obtained during the TROPOMI overpass time (13:00–14:00 LST) (green line).
   Individual points are TROPOMI Level 2 pixels averaged over city domains shown in figure 1 for days with TROPOMI spatial
   coverage >50% (open diamonds) and >75% (filled diamonds). TROPOMI error bars are domain standard deviations.

and also systematic biases in TROPOMI [26–30]. To                 that yields a slope similar to that obtained with the
do this, we regress TROPOMI columns against co-                   2019 data.
located GEOS-Chem columns for 2019. We find that                      The slopes in figures 3 and 4 and S1–S5 for the
the model underestimates variance in tropospheric                 GC_BAU scenario are 21%–49% larger than the ref-
column NO2 . Regression slopes for 2019 are less than             erence year (2019) slopes everywhere except SC and
unity in all regions (0.70–0.94) and cities (0.70 for             the NE. In SC, GC_BAU is 7% less than 2019 and
London, 0.84 for Manchester). This may be due to a                in the NE GC_BAU is consistent with (
Environ. Res. Lett. 16 (2021) 054031                                                                                       D A Potts et al

   Figure 3. Comparison of TROPOMI and GEOS-Chem tropospheric NO2 columns over southeast England (SE domain in
   figure 1). The comparison is for 2019 (top row) and 2020 for the GC_BAU (second), GC_30 (third) and GC_60 (fourth)
   scenarios. The time series (left) compares daily means from 1 February to 30 June. Error bars are standard deviations of
   TROPOMI daily means. Data during the lockdown (blue shading) are used in the scatterplots (right). The linear regression line
   and statistics are estimated using the Theil–Sen approach [44] to mitigate the influence of outliers on the regression statistics.

national total emissions. This is similar to the con-                 we estimate that emission reductions that would yield
tribution from just the London domain. NOx emis-                      a slope that best matches the slope for 2019 include
sions are also limited to a few large cities such as Edin-            42% for London, 29% for Manchester and the SE,
burgh and Glasgow (figure 1). Tropospheric columns                    23% for the NW, and 22% for the SW. There is no
of NO2 over SC will be more influenced by factors                     detectable change for the NE and SC.
such as long-range transport and meteorology than                         Figure 5 compares the spatial distribution of
perturbations in local sources. NOx emissions in the                  TROPOMI and GEOS-Chem tropospheric NO2
NE are 20% of the national total, but this includes a                 columns at the national level for 2019 and the
large contribution from industrial activity and power                 GC_BAU, GC_30, and GC_60 emission scenarios.
generation. According to the UK Office of National                    TROPOMI and GEOS-Chem are spatially consistent
Statistics, activity from these decreased less dramat-                in 2019 (R = 0.95) and in 2020 for all emission scen-
ically (20% decline in April 2020 relative to April                   arios (R = 0.93–0.96). Results for GC_15 and GC_45
2019) than road traffic. Road traffic in April 2020 was               also yield R > 0.9. Regression slopes are m = 0.92
35% of typical conditions for April and 50% of typ-                   for GC_15 and m = 0.63 for GC_45. By interpola-
ical conditions in May [45, 46]. By interpolation of                  tion, the nationwide decrease in anthropogenic NOx
slopes for the GEOS-Chem 2020 emission scenarios,                     emissions is ∼20%.

                                                        6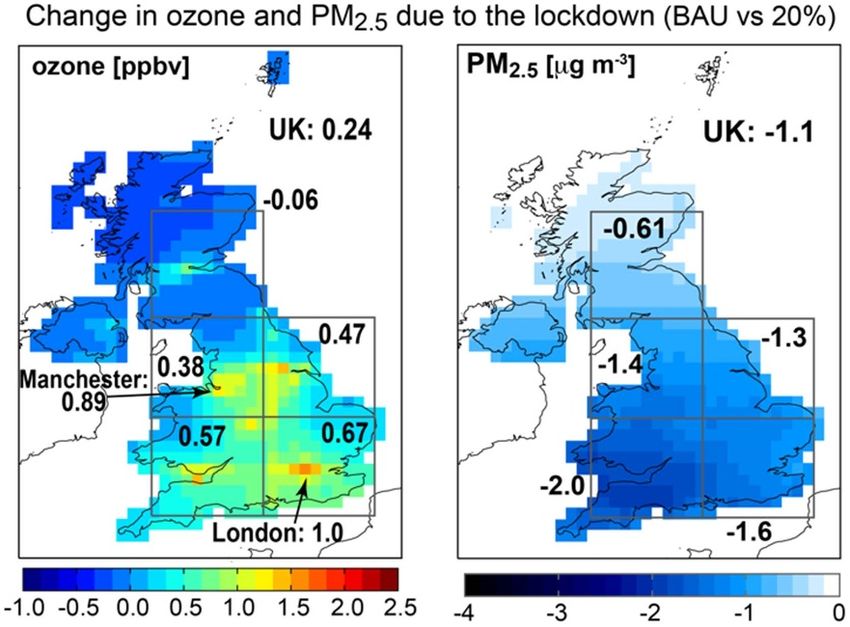
Environ. Res. Lett. 16 (2021) 054031                                                                        D A Potts et al

                                       Figure 4. Same as figure 3, but for London.

    The bar chart in figure 6 shows the relative change       NW. The relative change in the model from 2020
in city and regional median TROPOMI and GEOS-                 to 2019 due to normal emission mitigation meas-
Chem tropospheric NO2 columns from 2019 to 2020               ures and meteorology (GC_BAU) ranges from +9%
as an alternate approach to the regression method             for London to −23% for SC. The emission reduc-
to identify the scale of emission reductions required         tion estimates obtained with the relative difference
to reproduce the observations. The decline in TRO-            approach are 46% for London, 18% for Manchester,
POMI NO2 in 2020 relative to 2019 is 41% over Lon-            15% for the SW, 32% for the SE, 33% for the NW,
don and 32% over Manchester. This is greater than             and BAU for the NE and SC. These are similar to the
the decline reported by Barré et al [20] for Lon-             regression approach for London, the SE, the SW, the
don (30%) and Manchester (27%), though within                 NE and SC, but less than the regression approach for
the margin of error for Manchester. They also used            Manchester and more than the regression approach
TROPOMI, but for a lockdown period that starts                for the NW, as the relative difference is more
earlier than the UK lockdown (15 March) and so                influenced by extreme values than the regression
includes more days in March than us when 2019 and             approach.
2020 TROPOMI concentrations are relatively similar                The size of the errors are relatively large in figure 6,
(figure 1). The regional decline we obtain with TRO-          so we use the two-sample t-test to determine whether
POMI ranges from 6% over the NE to 35% over the               the differences in TROPOMI and GEOS-Chem

                                               7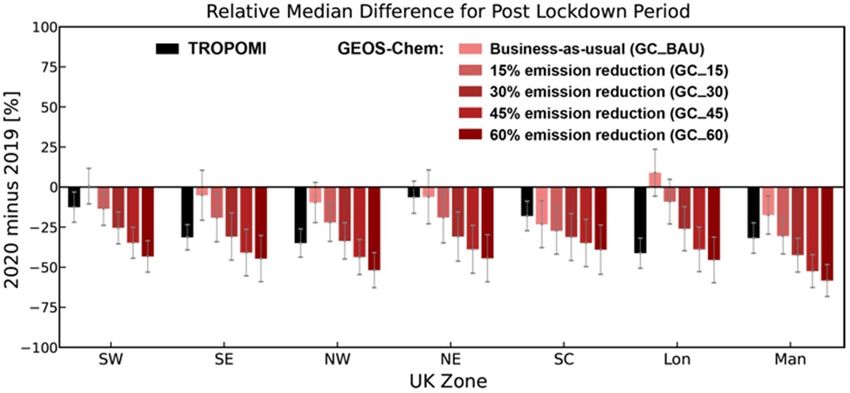
Environ. Res. Lett. 16 (2021) 054031 D A Potts et al
Figure 5. Spatial differences between TROPOMI and GEOS-Chem. Panels show the median difference of tropospheric NO2
columns (GEOS-Chem minus TROPOMI) for 23 March to 31 May in 2019 (top left) and in 2020 for the GC_BAU (top right),
GC_30 (bottom left), and GC_60 (bottom right) scenarios. Data are on the model grid (0.25◦ × 0.3125◦ ). Values inset are
Pearson’s correlation coefficients (R), model relative median biases (MB%) and Theil–Sen regression slopes (m).
Figure 6. Observed and modelled change in tropospheric column NO2 in 2020 relative to 2019. Bars are the relative change in
median NO2 columns for target regions and cities in the UK for 23 March to 31 May. Red shades distinguish the 2020 model
emission scenarios. Error bars are standard errors. Domains sampled are in figure 1.
tropospheric NO2 columns for 2019 and 2020 are for the NW and Manchester and no emissions reduc-
statistically significantly different. The t-scores and tion for the NE and SC, but yields larger reduction
p-values from this analysis are in the supplementary for London (GC_60). The results are ambiguous for
(table S1). The model emission reduction scenarios the SW (GC_15 and GC_30) and the SE (GC_30 and
for which the differences between GEOS-Chem and GC_45).
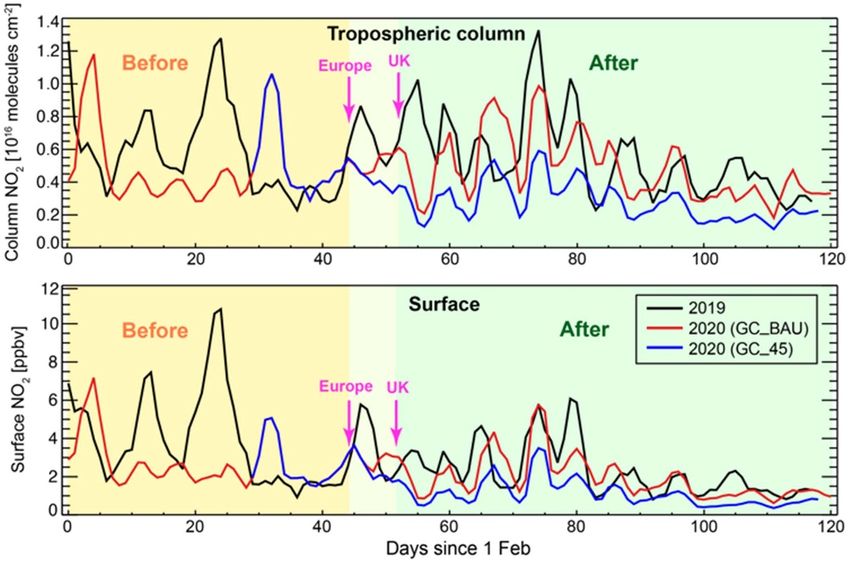
TROPOMI are inconsistent with those for 2019 have Figure 7 shows the complete GEOS-Chem time
a t-score significantly different from zero (and p- series of tropospheric column and surface NO2 for 1
value < 0.05). The t-test confirms a 30% reduction February to 31 May in 2019 and 2020 for the GC_BAU
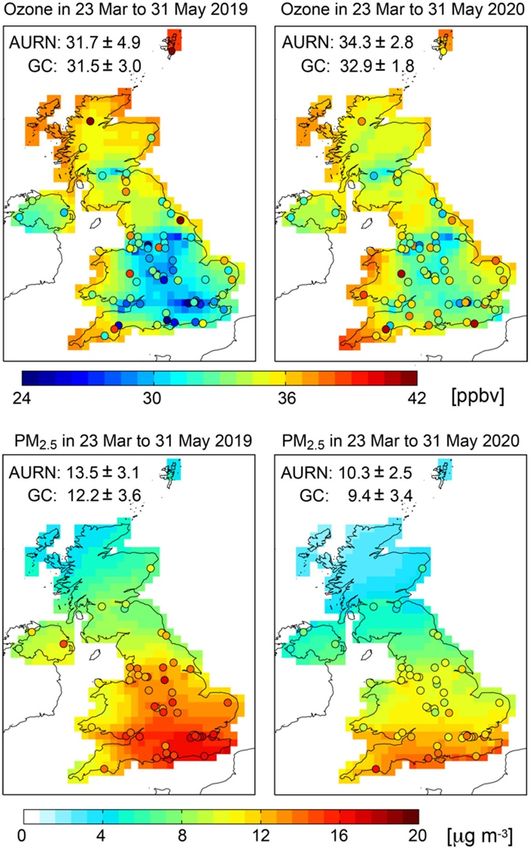
8Environ. Res. Lett. 16 (2021) 054031 D A Potts et al Figure 7. Time series of simulated daily mean tropospheric column (top panel) and surface (bottom panel) NO2 over London. The model is sampled during the satellite overpass (12:00–15:00 LST) for 1 February to 31 May 2019 (black line) and 2020 for the GC_BAU (red) and GC_45 (blue) emission scenarios. Timing of the onset of mainland Europe and UK lockdowns are indicated. scenario and the emission scenario that best fits the We first assess the ability of the model to reproduce observations over London according to the regres- AURN ozone and PM2.5 in 2019 and the observed sion slope approach (GC_45). Time series for the SW, change in PM2.5 and ozone in 2020 relative to 2019. SE, NW and Manchester are in the supplementary AURN PM2.5 are obtained at standard atmospheric (Figures S6–S9). Modelled columns and surface NO2 pressure, 20 ◦ C and 50% relatively humidity [47], so before the lockdown in 2020 are much less than NO2 GEOS-Chem PM2.5 is calculated for the same con- in the previous year, as was observed for TROPOMI ditions. Additional details of the GEOS-Chem simu- NO2 (figure 1). According to the model, this is due to lation of PM2.5 components and calculation of total buildup of pollution in 2019 due to stagnant condi- PM2.5 is in the supporting information. tions, and less precipitation and colder temperatures Figure 8 compares modelled and observed ozone in 2019 than 2020. This is consistent with the inter- and PM2.5 for 23 March to 31 May 2019 and 2020. pretation by Lee et al [6] that lower pre-lockdown sur- The comparison of the difference in these is in the face concentrations of NO2 in 2020 than 2019 were supplementary (figure S10). The relatively low ozone caused by dissipation of pollution by unusually high concentrations in 2019 (
Environ. Res. Lett. 16 (2021) 054031                                                                               D A Potts et al

   Figure 8. Modelled and observed surface ozone and PM2.5 for 23 March to 31 May 2019 and 2020. Panels show AURN (filled
   circles) and GEOS-Chem (background) ozone (top panel) and PM2.5 (bottom) for 2019 (left) and 2020 with a 20% emission
   reduction (right). Values inset are means and standard deviations for AURN and coincident GEOS-Chem grids.

from AURN, 12.2 µg m−3 from the model) and in the                 reduction (figure S10), as the measurements are influ-
decline in PM2.5 in 2020 relative to 2019 (3.2 µg m−3             enced by local effects not captured at the spatial res-
from AURN, 2.8 µg m−3 from the model). Accord-                    olution of the model and the regional analysis using
ing to AURN, PM2.5 declines at all except two sites in            TROPOMI does not capture local emission reduc-
Cornwall where PM2.5 increases by 0.4 µg m−3 and                  tions in cities.
2.1 µg m−3 (figure S10). The model underestimates                     Figure 9 shows the effect of 20% emission reduc-
the observed 6–7 µg m−3 decline in PM2.5 in cities,               tions alone on ozone and PM2.5 . The national increase
but captures the decline in rural and remote regions              in ozone is small (0.24 ppbv) and ranges from
(figure S10). The aerosol nitrate component of PM2.5              increases in ozone over cities of 0.89 ppbv for
is from oxidation of NOx and the decline in emissions             Manchester and 1.0 ppbv for London to regional
of these is constrained in this work with TROPOMI,                decline in ozone in remote and rural areas. The SE
whereas emissions of other precursors and primary                 experiences the largest regional increase in ozone of
PM2.5 are not. The spatial distribution of the mod-               0.67 ppbv. A simulation with 45% lower emissions,
elled decline in nitrate and associated ammonium                  likely more representative of the decline in emis-
and aerosol water is consistent with decline in AURN              sions in cities, leads to an increase in surface ozone
PM2.5 in rural and remote areas (figure S11). The                 of 1.9 ppbv for Manchester and 2.1 ppbv for Lon-
observed change in ozone and PM2.5 in cities is, in               don. The national decline in PM2.5 for 20% emission
general, greater than in the model using 20% emission             reduction is 1.1 µg m−3 , ranging from a decrease of

                                                   10
Environ. Res. Lett. 16 (2021) 054031 D A Potts et al
Figure 9. Response of surface ozone and PM2.5 %–20% reduction in anthropogenic emissions associated with lockdown measures.
Maps are differences between BAU and a 20% reduction in anthropogenic emissions. Numbers inset give mean changes in ozone
for target regions (boxes) and cities (arrows) and in PM2.5 for target regions only.
0.61 µg m−3 in SC to 2.0 µg m−3 in the SW. The and NE/R016518/1). EAM acknowledges funding
largest response in the SW is due in part to decline in from NERC/EPSRC (Award Number EP/R513465/1)
primary and secondary sources of PM2.5 in the SE that and from the European Research Council under
would ordinarily be transported by prevailing south- the European Union’s Horizon 2020 research and
easterlies. The response in simulated ozone and PM2.5 innovation programme (through a Starting Grant,
averaged across the UK to emissions alone (figure 9) Grant Number 851854_UPTROP). The University
is about half the combined response of meteorology of Leicester High Performance Computing Facility
and emissions (figure S10). ALICE was used to conduct data analysis and model
simulations. The manuscript was written through
4. Conclusion contributions of all authors. HB and EAM designed
the research. DP and RP conducted the data analysis
We combined data from TROPOMI and the GEOS- comparing GEOS-Chem and TROPOMI, and EAM
Chem model to determine that lockdown measures simulated and analyzed model output. EAM and HB
in the UK in response to the rise in COVID-19 cases with contributions from RP and DP wrote the manu-
in March 2020 led to a nationwide decline in NOx script. JL and WD provided surface in-situ data. JR,
emissions of ∼20%. These range from being indistin- DPM, MC, BK and RS contributed to initial discus-
guishable from BAU in Scotland and northern Eng- sions on the study and MC reviewed the manuscript.
land to >40% reduction in London. Emission changes
only account for half the national mean increase in ORCID iDs
surface ozone and decline in PM2.5 in 2020 relative to
2019. The remaining contribution is from meteoro- Eloise A Marais https://orcid.org/0000-0001-
logical differences between the 2 years, emphasizing 5477-8051
the need to account for meteorology and pollution Hartmut Boesch https://orcid.org/0000-0003-
sources in future abatement strategies and in impos- 3944-9879
ing regulatory action. Will Drysdale https://orcid.org/0000-0002-7114-
7144
Data availability statement Martyn P Chipperfield https://orcid.org/0000-
0002-6803-4149
The data that support the findings of this study
are openly available at the following URL/DOI:
https://s5phub.copernicus.eu/dhus/#/home. References
[1] Ferguson N et al 2020 Report 9: impact of
Acknowledgments non-pharmaceutical interventions (NPIs) to reduce
COVID19 mortality and healthcare demand, (Imperial
College London) p 20
HB, DAP, RJP, and MC acknowledge funding as part
[2] Shi X and Brasseur G P 2020 The response in air quality to
of NERC’s support of the National Centre for Earth the reduction of Chinese economic activities during the
Observation (NCEO Grant Numbers: nceo020005 COVID-19 outbreak Geophys. Res. Lett. 47 1–8
11Environ. Res. Lett. 16 (2021) 054031 D A Potts et al
[3] Zhao Y, Zhang K, Xu X, Shen H, Zhu X, Zhang Y, Hu Y and [22] Veefkind J P et al 2012 TROPOMI on the ESA Sentinel-5
Shen G 2020 Substantial changes in nitrogen dioxide and Precursor: a GMES mission for global observations of the
ozone after excluding meteorological impacts during the atmospheric composition for climate, air quality and ozone
COVID-19 outbreak in Mainland China Environ. Sci. layer applications Remote Sens. Environ. 120 70–83
Technol. Lett. 7 402–8 [23] van Geffen J, Boersma K F, Eskes H, Sneep M, Ter Linden M,
[4] Bauwens M et al 2020 Impact of coronavirus outbreak on Zara M and Veefkind J P 2020 S5P TROPOMI NO2 slant
NO2 pollution assessed using TROPOMI and OMI column retrieval: method, stability, uncertainties and
observations Geophys. Res. Lett. 47 1–9 comparisons with OMI Atmos. Meas. Technol. 13 1315–35
[5] Le T, Wang Y, Liu L, Yang J, Yung Y L, Li G and Seinfeld J H [24] Argyrouli A, Sneep M and Lambert J-C S5P Mission
2020 Unexpected air pollution with marked emission Performance Centre CLOUD [L2__CLOUD_] Readme
reductions during the COVID-19 outbreak in China Science (available at: https://sentinel.esa.int/documents/247904/
369 702–6 3541451/Sentinel-5P-Cloud-Level-2-Product-Readme-File)
[6] Lee J D, Drysdale W S, Finch D P, Wilde S E and Palmer P I (Accessed 20 January 2020)
2020 UK surface NO2 levels dropped by 42% during the [25] Eskes H, van Geffen J, Boersma F, Eichmann K, Apituley A,
COVID-19 lockdown: impact on surface O3 Atmos. Chem. Pedergnana M, Sneep M, Veefkind J and Loyola D 2019
Phys. 20 15743–59 Sentinel-5 precursor/TROPOMI Level 2 product user
[7] Petetin H, Bowdalo D, Soret A, Guevara M, Jorba O, manual nitrogendioxide, (Royal Netherlands Meteorological
Serradell K and Pérez García-Pando C 2020 Institute)
Meteorology-normalized impact of the COVID-19 [26] Pinardi G et al 2020 Validation of tropospheric NO2 column
lockdown upon NO2 pollution in Spain Atmos. Chem. Phys. measurements of GOME-2A and OMI using MAX-DOAS
20 11119–41 and direct sun network observations Atmos. Meas. Technol.
[8] Zoran M A, Savastru R S, Savastru D M and Tautan M N 13 6141–74
2020 Assessing the relationship between ground levels of [27] Verhoelst T et al 2021 Ground-based validation of the
ozone (O3 ) and nitrogen dioxide (NO2 ) with coronavirus Copernicus Sentinel-5p TROPOMI NO2 measurements with
(COVID-19) in Milan, Italy Sci. Total Environ. 740 140005 the NDACC ZSL-DOAS, MAX-DOAS and Pandonia global
[9] Sicard P, De Marco A, Agathokleous E, Feng Z, Xu X, networks Atmos. Meas. Tech. 14 481–510
Paoletti E, Rodriguez J J D and Calatayud V 2020 Amplified [28] Zhao X et al 2020 Assessment of the quality of TROPOMI
ozone pollution in cities during the COVID-19 lockdown high-spatial-resolution NO2 data products in the Greater
Sci. Total Environ. 735 139542 Toronto Area Atmos. Meas. Technol. 13 2131–59
[10] Menut L, Bessagnet B, Siour G, Mailler S, Pennel R and [29] Ialongo I, Virta H, Eskes H, Hovila J and Douros J 2020
Cholakian A 2020 Impact of lockdown measures to combat Comparison of TROPOMI/Sentinel-5 Precursor NO2
Covid-19 on air quality over western Europe Sci. Total observations with ground-based measurements in Helsinki
Environ. 741 140426 Atmos. Meas. Technol. 13 205–18
[11] Venter Z S, Aunan K, Chowdhury S and Lelieveld J 2020 [30] Marais E A et al 2020 New observations of upper
COVID-19 lockdowns cause global air pollution declines tropospheric NO2 from TROPOMI Atmos. Meas. Tech.
Proc. Natl Acad. Sci. 117 18984–90 Discuss. 2020 1–31
[12] Salma I, Vörösmarty M, Gyöngyösi A Z, Thén W and [31] Richmond B et al 2020 UK Informative Inventory Report
Weidinger T 2020 What can we learn about urban air quality (1990–2018) Ricardo Energy Environ. 6
with regard to the first outbreak of the COVID-19 [32] Dunford D, Dale B, Stylianou N, Lowther E, Ahmed M and
pandemic? A case study from Central Europe Atmos. Chem. Arenas I T 2020 Coronavirus: the world in lockdown in
Phys. 20 15725–42 maps and charts BBC News 6 April
[13] Goldberg D L, Anenberg S C, Griffin D, McLinden C A, Lu Z [33] Pope R J, Arnold S R, Chipperfield M P, Latter B G,
and Streets D G 2020 Disentangling the impact of the Siddans R and Kerridge B J 2018 Widespread changes
COVID-19 lockdowns on urban NO2 from natural in UK air quality observed from space Atmos. Sci. Lett.
variability Geophys. Res. Lett. 47 1–11 19 ARTN
[14] Zhang R X, Zhang Y Z, Lin H P, Feng X, Fu T M and [34] Elkus B and Wilson K R 1977 Photochemical air pollution:
Wang Y H 2020 NOx emission reduction and recovery weekend-weekday differences Atmos. Environ. 11 509–15
during COVID-19 in East China Atmos. 11 433 [35] Beirle S, Platt U, Wenig M and Wagner T 2003 Weekly cycle
[15] Biswal A et al 2021 COVID-19 lockdown induced changes in of NO2 by GOME measurements: a signature of
NO2 levels across India observed by multi-satellite and anthropogenic sources Atmos. Chem. Phys. 3 2225–32
surface observations Atmos. Chem. Phys. 21 5235–51 [36] Lourens A, Butler T, Beukes J, Zyl P G, Beirle S, Wagner T,
[16] Williams M 2020 On behalf of the environmental research Heue K-P, Pienaar J, Fourie G and Lawrence M 2012
group the effect of COVID-19 lockdown measures on air Re-evaluating the NO2 hotspot over the South African
quality in London in 2020, King’s College London Highveld South Afr. J. Sci. 108 1146–52
[17] Jenkins N, Parfitt H, Nicholls M, Beckett P, Wyche K, [37] Vohra K et al 2020 Long-term trends in air quality in major
Smallbone K, Gregg D and Smith M 2020 Estimation of cities in the UK and India: a view from space Atmos. Chem.
changes in air pollution in London during the COVID19 Phys. Discuss. 1–45
outbreak. Response to the UK Government’s Air Quality [38] Reed C, Evans M J, Di Carlo P, Lee J D and Carpenter L J
Expert Group call for evidence (London: Air Quality Expert 2016 Interferences in photolytic NO2 measurements:
Group) explanation for an apparent missing oxidant? Atmos. Chem.
[18] Seinfeld J H and Pandis S N 2016 Atmospheric Chemistry and Phys. 16 4707–24
Physics: From Air Pollution to Climate Change (New York: [39] Martin R V, Jacob D J, Chance K, Kurosu T P, Palmer P I and
Wiley) Evans M J 2003 Global inventory of nitrogen oxide emissions
[19] Zhang M, Katiyar A, Zhu S, Shen J, Xia M, Ma J, Kota S H, constrained by space-based observations of NO2 columns J.
Wang P and Zhang H 2021 Impact of reduced anthropogenic Geophys. Res. 108 4537
emissions during COVID-19 on air quality in India Atmos. [40] Boersma K F et al 2011 An improved tropospheric NO2
Chem. Phys. 21 4025–37 column retrieval algorithm for the Ozone Monitoring
[20] Barré J et al 2020 Estimating lockdown induced European Instrument Atmos. Meas. Tech. 4 1905–28
NO2 changes Atmos. Chem. Phys. Discuss. 1–28 [41] Travis K R et al 2016 Why do models overestimate surface
[21] Kroll J H, Heald C L, Cappa C D, Farmer D K, Fry J L, ozone in the Southeast United States? Atmos. Chem. Phys.
Murphy J G and Steiner A L 2020 The complex chemical 16 13561–77
effects of COVID-19 shutdowns on air quality Nat. Chem. [42] Marais E A et al 2018 Nitrogen oxides in the global upper
12 777–9 troposphere: interpreting cloud-sliced NO2 observations
12Environ. Res. Lett. 16 (2021) 054031 D A Potts et al
from the OMI satellite instrument Atmos. Chem. Phys. www.gov.uk/government/statistics/transport-use-during-
18 17017–27 the-coronavirus-covid-19-pandemic) (Accessed 10
[43] Silvern R F et al 2019 Using satellite observations of September)
tropospheric NO2 columns to infer long-term trends in US [46] Office for National Statistics Index of Production time series
NOx emissions: the importance of accounting for the free (available at: www.ons.gov.uk/economy/economicoutput
tropospheric NO2 background Atmos. Chem. Phys. andproductivity/output/timeseries/k27q/diop) (Accessed
19 8863–78 10 September)
[44] Wang X, Dang X, Peng H and Zhang H 2009 The Theil-Sen [47] Butterfield D and Quincey P 2007 NPL REPORT AS 15:
estimators in a multiple linear regression model measurement science issues relating to PM10 and PM2.5
[45] Department for Transport Transport use during the airborne particles, (National Physics Laboratory)
coronavirus (COVID-19) pandemic (available at: pp 1754–2928
13You can also read