Analysis of H 2/Air Polarization Losses of Low-Platinum-Loading Cathodes with Various I/C Ratios and Carbon Supports - IOPscience
←
→
Page content transcription
If your browser does not render page correctly, please read the page content below
Journal of The Electrochemical
Society

OPEN ACCESS

Analysis of H2/Air Polarization Losses of Low-Platinum-Loading
Cathodes with Various I/C Ratios and Carbon Supports
To cite this article: Haoran Yu et al 2018 J. Electrochem. Soc. 165 J3318

View the article online for updates and enhancements.

                               This content was downloaded from IP address 46.4.80.155 on 01/03/2021 at 23:07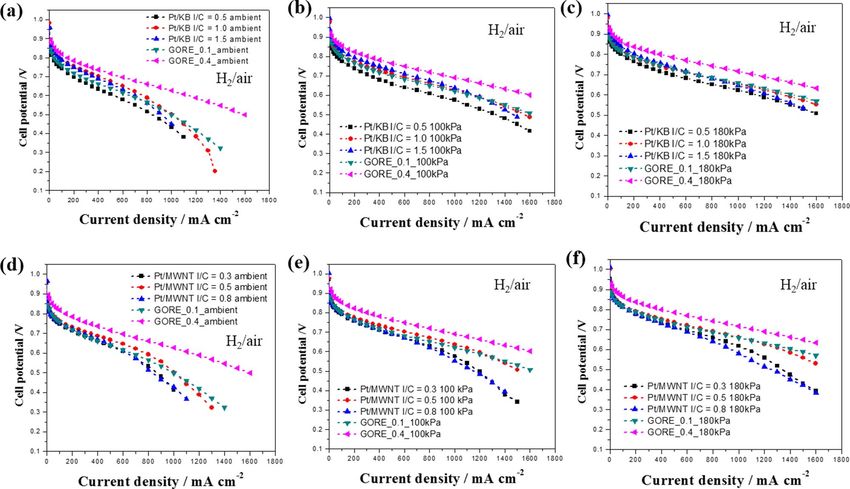
J3318                                      Journal of The Electrochemical Society, 165 (15) J3318-J3334 (2018)

                                                JES FOCUS ISSUE ON ELECTROCATALYSIS — IN HONOR OF RADOSLAV ADZIC
                            Analysis of H2 /Air Polarization Losses of Low-Platinum-Loading
                            Cathodes with Various I/C Ratios and Carbon Supports
                                               1,2,∗,z
                            Haoran Yu,                   Leonard Bonville,2 and Radenka Maric1,2,3
                            1 Department  of Chemical and Biomolecular Engineering, University of Connecticut, Storrs, Connecticut
                            06269-3222, USA
                            2 Center for Clean Energy Engineering, University of Connecticut, Storrs, Connecticut 06269-5233, USA
                            3 Department of Materials Science and Engineering, University of Connecticut, Storrs, Connecticut 06269-3136, USA

               Reduction of platinum loading is one of the major challenges for the commercialization of proton exchange membrane fuel cells.
               The role of catalyst layer microstructure and ionomer content is critically important at ultra-low platinum loading due to enhanced
               oxygen transport resistance compared to high platinum loading. In the present work, catalyst-coated membranes with two types
               of carbon supports and various I/C ratios are fabricated using reactive spray deposition technology (RSDT) where low Pt loading
               (cathode 0.1 mg cm−2 , anode 0.05 mg cm−2 ) catalyst layers are directly deposited on Nafion membranes. Similar performance is
               obtained at optimal I/C ratios for Pt/Ketjen Black (KB) CCMs and Pt /multi-wall carbon nanotube (MWNT) CCMs, with optimal
               I/C ratio being 1.0 and 0.5, respectively. Six types of polarization overpotentials are analyzed using a six-step method established
               in our previous work to elucidate the influence of catalyst layer microstructure and ionomer content on fuel cell performance. Since
               MWNT requires 50% less ionomer and are chemically more stable than KB, MWNT is a preferred support for ultra-low platinum
               loading electrodes. The six-step method connects catalyst layer properties with specifically targeted overpotentials and is thus a
               powerful tool in catalyst layer optimization.
               © The Author(s) 2018. Published by ECS. This is an open access article distributed under the terms of the Creative Commons
               Attribution 4.0 License (CC BY, http://creativecommons.org/licenses/by/4.0/), which permits unrestricted reuse of the work in any
               medium, provided the original work is properly cited. [DOI: 10.1149/2.0411815jes]

               Manuscript submitted August 2, 2018; revised manuscript received October 17, 2018. Published November 8, 2018. This was Paper
               1473 presented at the New Orleans, Louisiana, Meeting of the Society, May 28–June 1, 2017. This paper is part of the JES Focus
               Issue on Electrocatalysis — In Honor of Radoslav Adzic.

    The major challenges for commercialization of proton exchange                       In our previous work, we established a systematic six-step
membrane fuel cell (PEMFC) are cost reduction and durability.1                      method to analyze the polarization sources for low-platinum loaded
The high cost of platinum has stimulated extensive research on low-                 PEMFC.25,26 We demonstrated that the cathode electrode concentra-
platinum-loading PEMFCs.2–14 At low Pt loading, ionomer properties,                 tion overpotential was reduced with electrodes fabricated by reactive
Pt nanoparticle distribution and catalyst layer microstructures play an             spray deposition technology (RSDT) compared to commercial GORE
important role which influences both catalyst activity and mass trans-              PRIMEA CCMs at 0.4 and 0.1 mg cm−2 cathode Pt loading. The cur-
port in the catalyst layer.1,3,15 Therefore, understanding the sources of           rent limiting method was not used in Ref. 25 and the present work
polarization overpotentials is essential when tuning the catalyst layer             because it utilizes only one data point (the limiting current) to ex-
to achieve optimal performance.                                                     trapolate oxygen transport resistance. On the other hand, the six-step
    Iczkowski and Cutlip16 developed an agglomerate mathematical                    method accounts for every data point on the polarization curve and
model to separate the polarization overpotentials in a phosphoric acid              provides a comprehensive understanding of mass transport limitation
fuel cell with PTFE-bonded, Pt on carbon electrode. The overpoten-                  in the entire current region. Moreover, a real fuel cell does not operate
tial due to gas diffusion contributed 38% of the total loss and was                 near the limiting current condition due to local fuel starvation that
separated into losses from porous backing layers and catalyst layers.               causes severe carbon corrosion.27–29 Therefore, we resort to Butler-
Ohmic loss contributed the highest proportion of 54% of the total                   Volmer equation to estimate the limiting current. At the highest current
voltage loss.16 Gasteiger17 combined mathematical and experimen-                    density, the amount of variance in ηcorr3 remains as low as 5.7% with
tal methods to determine the polarization overpotentials of PEMFC.                  different limiting current densities.25 Thus, the overpotentials are in
The overpotential of oxygen reduction reaction (ORR) was calculated                 general not sensitive to the limiting current density. A window of about
from Butler-Volmer equation and the ionic resistance was determined                 100 mA cm−2 is allowed for the estimation of limiting current.25
from electrochemical impedance spectroscopy.18 However, the mass-                       In this work, we investigate the effect of ionomer-to-carbon (I/C)
transport losses are combined to one single term.19 A recent study                  ratio and several types of carbon support using electrodes fabricated
by Flick et al.20 modified this method and separated the contributions              with reactive spray deposition technology (RSDT). The RSDT process
from anode and cathode, but the mass-transport losses are still not                 has been able to optimize the electrode microstructure and to reduce
well-defined. Baker et al.,21 separated the mass-transport losses with              the optimal ionomer content to ∼15 wt% for catalyst layer composed
a limiting current method at various backpressures and low oxygen                   of Pt supported on Vulcan XC-72R.30 The ionomer of this process
concentrations. The mass-transport losses are separated into contri-                was found to penetrate the micropores and improve contact with Pt
butions from flow field, gas diffusion medium, and an unidentified                  nanoparticles.30 Herein, the investigation of the effect of I/C ratio on
source termed “other”. Recent studies1,3,22–24 using limiting current               the polarization behavior of an air-breathing fuel cell is continued
methods reveal the correlation of the “other” source with Pt surface                using the following carbon supports, each with distinctive structural
area and attributed this source of overpotential to be the oxygen trans-            properties, Ketjen Black carbon (KB) and multi-walled carbon nan-
port resistance in the ionomer thin film of cathode catalyst layer. A               otube (MWNT).
detailed review of this source of overpotential can be found in our                     The six-step analysis method26 modified for low Pt loading25 is
previous work25 and the origin of this source is still under debate in              used to separate and quantify the contributions of different polariza-
the literature.                                                                     tion sources as well as to evaluate the oxygen transport limitation
                                                                                    in the gas diffusion layer (GDL) and the cathode ionomer/Pt inter-
                                                                                    face. The assumptions for this method are: 1) the ORR follows first
  ∗ Electrochemical Society Member.                                                 order reaction with respect to oxygen partial pressure; 2) the ORR
  z
    E-mail: haoran.yu@uconn.edu                                                     kinetics follows Butler-volmer equation, i.e. Tafel kinetics; 3) oxygen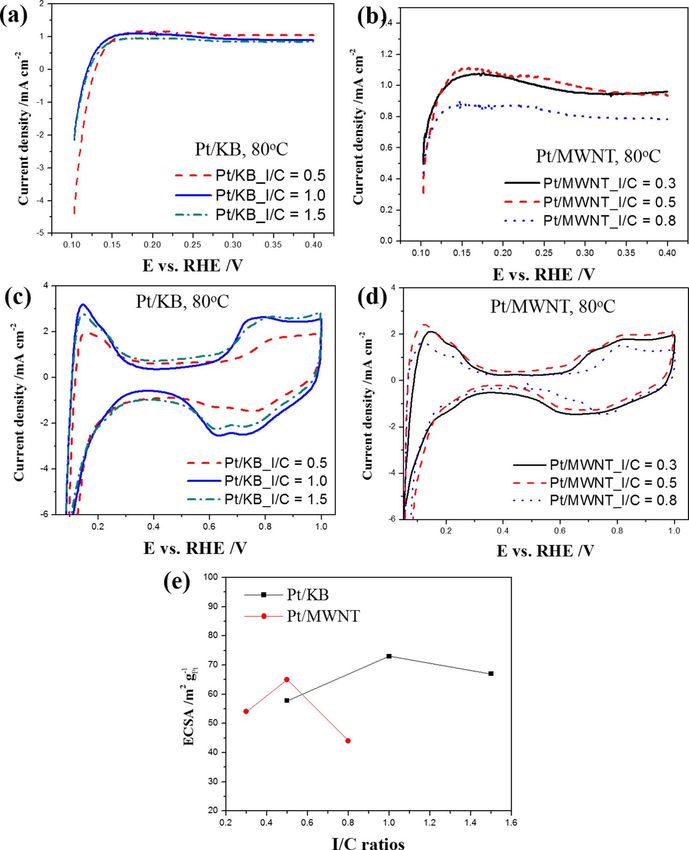
Journal of The Electrochemical Society, 165 (15) J3318-J3334 (2018)                                          J3319

transport follows Fick’s first diffusion law in the flow field, gas diffu-        where ib is called the breaking current density where the Tafel slope
sion layer, and macro pores in the cathode catalyst layer where oxygen            starts to deviate from the theoretical value, indicating additional po-
transport is governed by molecular diffusion; on the other hand, the              larization loss due to ηcorr4 . Following our previous work,25 ib is set
oxygen transport is governed by Knudsen diffusion in the cathode                  to be 10 mA cm−2 for all samples. The corrected cell potential with
catalyst layer due to mesopores (10–100 nm) and micropores (less                  electrode concentration overpotential is:
than 10 nm); 4) the effect of anode polarization can be neglected; and
                                                                                       Vcorr4 = Vcorr3 + ηcorr4 = E + iRnonelectrode + iRelectrode + ηcorr3
5) no electrical short in the cell. A brief description of each step is

provided below:25                                                                                                i + ix
                                                                                                + b − b log                 .                              [8]
1.     The non-electrode ohmic overpotential is denoted by:                                                       ib + i x

                               ηcorr1 = iRnonelectrode                     [1]
                                                                                  5.    The ORR activation overpotential from Tafel equation, ηcorr5 , is
                                                                                        defined as the potential loss due to Tafel kinetics at current density
where i is the operating current density and Rnonelectrode is the non-                  higher than the start of I-V curve (10 mA cm−2 ):
electrode ohmic resistance comprised of membrane and all other con-
tact resistances of the MEA. Rnonelectrode is measured using current                                                            i + ix
                                                                                                           ηcorr 5 = b ∗ log                               [9]
interruption method with the inherent module in the fuel cell test                                                             10 + i x
station. The first-step corrected cell potential is defined as:
                  Vcorr1 = E + ηcorr1 = E + iRnonelectrode                 [2]         The corresponding corrected cell potential is:

where E is the measured cell potential (V) at current density i.                       Vcorr5 = Vcorr4 + ηcorr5 = E + iRnonelectrode + iRelectrode + ηcorr3

                                                                                                                 i + ix                 i + ix
2.     The cathode electrode ohmic overpotential mainly concerns the                            + b − b log                 + b ∗ log                     [10]
       ionic resistance in the cathode. It is denoted by:                                                         ib + i x               10 + i x
                                ηcorr2 = iRelectrode                       [3]
                                                                                  6.    The activation overpotential from catalyst activity, ηcorr6 , is de-
                                                                                        fined as the activation potential loss at 10 mA cm−2 :
The cathode electrode ohmic resistance, Relectrode , is obtained using
an iterative method under the assumption (1) where the current ratio                                     ηcorr6 = Veq − Vcorr2@10 mA cm −2                [11]
between H2 /O2 and H2 /air I-V curves is 4.8 at the same cell potential.
The current ratio of 4.8 stems from the ratio of oxygen concentration                Hence, the potential after all the six steps of correction equals the
in pure oxygen and air (100%/21% = 4.8) when the same total gas                   theoretical equilibrium potential (Veq ) at the operating condition:
flow for air and oxygen is purging the cathode. The corrected cell
potential after this step is:                                                          Vcorr6 = Vcorr5 + ηcorr6 = E + iRnonelectrode + iRelectrode + ηcorr3

         Vcorr2 = Vcorr1 + ηcorr2 = E + iRnonelectrode + iRelectrode       [4]                                     i + ix                  i + ix
                                                                                                + (b − b) log               + b ∗ log
                                                                                                                  ib + i x               (10 + i x )
                                                                                                 + Veq − Vcorr2@10 mA cm −2                               [12]
3.     The non-electrode concentration overpotential (ηcorr3 ) is associ-
       ated with the molecular diffusion of oxygen in the flow channel,                The calculation of Veq can be found in Ref. 31.
       GDL, and the meso- and macropores in the cathode. The limiting
       current density (ilim ) needs to be determined to estimate ηcorr3 . The
                                                                                                                Experimental
       limiting current density was found using an iterative procedure
       that employs the Butler-Volmer equation:                                       Chemicals and materials.—The detailed process of CCM fabrica-
                                                                                tion by RSDT can be found in our previous publications.30,32–35 Typ-
                        i + ix                  Veq − Vcorr 2
                                   =  i   ex p                              [5]   ically, Pt-2, 4-pentanedionate (Colonial Metals, Inc.) was used as Pt
                      1 − i+iilim
                                 x      0
                                                      b                          precursor and dissolved in a combination of 62.5 wt% xylene (Sigma
                                                                                  Aldrich, ACS reagent, ≥98.5%), 21 wt% acetone (Sigma Aldrich,
   Where b’ is the modified Tafel slope when the experimentally                   HPLC ≥99.9%) and 16.5 wt% liquid propane (Air gas, ≥90%) with
controlled current is corrected for ilim (left hand side). ix is the hydro-       10 mM Pt concentration. KB EC-600JD (Akzo Nobel) or MWNT
gen crossover current. The correct magnitude of ilim makes the plot               (Ballard power systems, Inc.) was used as catalyst support. The car-
of Vcorr2 vs. log[ 1−i+ii+ix x ] linear following Equation 5. The resulting       bon supports were thermally treated at 400◦ C in nitrogen environment
                        ilim                                                      for 4 hours to remove any adsorbed organic contaminants. The carbon
straight line represent the cell potential (Vcorr3 ) corrected for ηcorr3 and     slurry was prepared by dispersing carbon in methanol with 2.5 mg
the difference between the resulting straight line and Vcorr2 is defined          mL−1 concentration, followed by adding Nafion dispersion (DuPont
as ηcorr3 . Hence, the corrected cell potential is:                               D521, 5wt%, 1100 EW) drop-wise. Then, the slurry was sonicated
     Vcorr3 = Vcorr2 + ηcorr3 = E + iRnonelectrode + iRelectrode + ηcorr3 . [6]   (Misonix S-4000, Qsonica, LLC) in an ice bath for 90 min before use.
                                                                                  The I/C ratio in the slurry was set at 0.5, 1.0, 1.5 for KB and 0.3,
                                                                                  0.5, 0.8 for MWNT. Since the BET surface area of MWNT is much
                                                                                  lower than KB, the I/C ratios for MWNT were lower than KB. The
4.     The electrode concentration overpotential (ηcorr4 ) is associated          anode and the cathode both had the same I/C ratio. For both types of
       with the Knudsen diffusion of oxygen in the cathode as well as the         carbon, the resulting Pt loading was ∼0.1 mg cm−2 for the cathode
       oxygen transport in the ionomer thin film and at the ionomer/Pt            and ∼0.05 mg cm−2 for the anode, confirmed by inductive-coupled
       interface. It is determined by the difference between the Tafel            plasma (ICP) analysis. The thickness of the cathode and anode were
       slope b in the kinetic controlled region (10–100 mA cm−2 ) of              12–13 μm and 6–7 μm, respectively.
       H2 /O2 polarization curve and Tafel slope b’ in H2 /Air polarization
       curve:                                                                         Physical characterizations.—The procedure for nitrogen adsorp-

                                               i + ix                           tion and mercury porosimetry followed that described in Ref. 30.
                        ηcorr 4 = b − b log                            [7]
                                                ib + i x                          The surface area was determined from nitrogen adsorption. Freshly-
                                                                                  deposited CCMs were cut into small strips and placed in a sample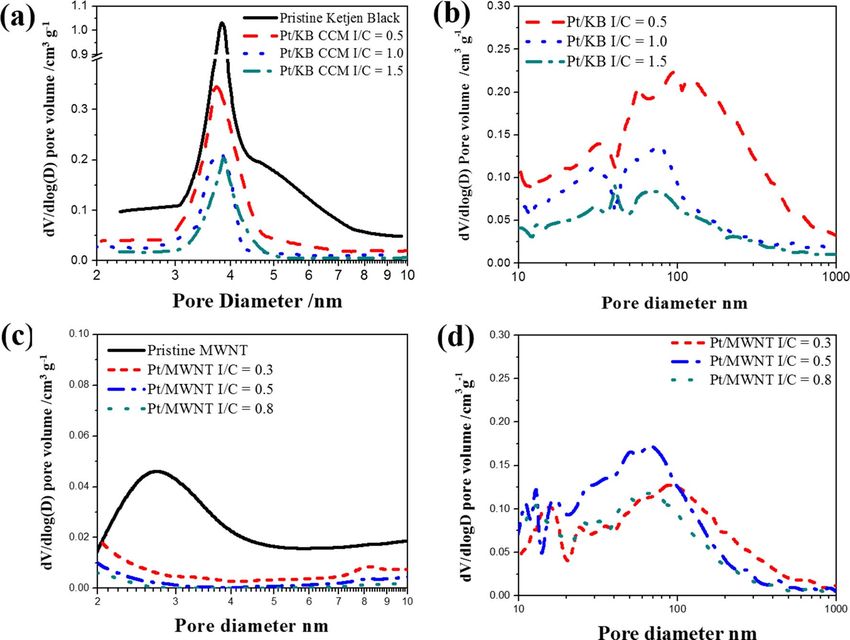
J3320 Journal of The Electrochemical Society, 165 (15) J3318-J3334 (2018)
tube for degas at 105◦ C for 12 hours. Nitrogen adsorption analy- field images of scrapped-off catalyst layer showed well-dispersed
sis was performed with a Micromeritics 2020 at 77 K with a dose Pt on carbon supports (Figure 1). The individual KB particle has
of 3 cm3 . a diameter of 30–40 nm,38 while the MWNT shows a diameter
The pore size distribution of the catalyst layer was determined of 20–30 nm.
using both nitrogen adsorption and mercury intrusion porosimetry The catalyst layer pore structure was characterized using nitrogen
(MIP) methods. The theory of Barret, Joyner and Halenda (BJH)36 adsorption and mercury intrusion porosimetry (MIP). The advantage
was applied to results from the desorption branch of the nitrogen of combining these methods is that it provides a complete charac-
adsorption isotherm to calculate pore size distribution below 100 nm. terization of the pore size distribution from 2 nm to 1000 nm in the
MIP was performed with an AutoPore IV (Micromeritics, Inc.) up to catalyst layer. The nitrogen adsorption volume for the isotherms of KB
60,000 psi to measure pore size ranging from 10 nm to 10 μm. The and MWNT CCMs both decreased when the I/C ratio was increased
Washburn equation for cylindrical pores was applied37 to calculate the (Figures 2a, 2b). Both the Pt/KB and the Pt/MWNT CCMs show a
pore size. To keep a constant electrode area for the porosimetry tests, slight hysteresis at high nitrogen partial pressure due to capillary con-
20 circular pieces with a diameter of 0.95 cm (3/8 inch) were punch densation. Further, the pristine KB powder and the Pt/KB CCMs also
out of the CCMs. show H3 type hysteresis in the medium range of nitrogen partial pres-
Bright field transmission electron microscopy (TEM) images of sure (Figure 2a). The H3 type hysteresis typically occurs in samples
freshly deposited Pt particles supported on KB and MWNT were containing a heterogeneous distribution of pores of tapered capillaries
characterized with a FEI Tecnai T12 operated at 120 kV. Catalyst or wedge-formed capillaries with closed sides and open ends.39 The
powders were carefully scraped off and dispersed in ethanol. Twenty nature of this hysteresis stems from the different equilibrium pressure
microliters of the dispersion were deposited onto a Cu TEM grid (Cu between adsorption and desorption for the pores.37,39 For materials
300 CN, Pacific Grid-Tech) and dried overnight. composed by close-packed and equal-sized spherical particles, capil-
lary condensation occurs within the interstices between the particles
MEA testing.—The CCMs were assembled with Sigracet 25BC forming primarily slit-shaped pores.39 Gregg and Sing40 and Soboleva
GDLs and placed between two flow field plates with 25 cm2 active et al.41 showed similar shape of adsorption and desorption isotherm
areas, without hot-pressing. The cathode flow field consisted of a of KB. A BET surface area of 1174.12 m2 /gcarbon was measured for
triple serpentine channel and the anode flow field was single serpen- pristine KB powder. The BET surface area of Pt/KB catalyst layer de-
tine. The single-cell test was carried out with a Scribner 850e fuel creased from 669 to 223 m2 /gcarbon as I/C ratio increased from 0.15 to
cell test system. Prior to the acquisition of the polarization curve, 1.5. For the MWNT used in this study, the BET surface area was 316
the cell was conditioned overnight by holding the cell potential at m2 /gcarbon for the pristine powder and decreased from 207 m2 /gcarbon
0.6 V with 100% RH humidified air in the cathode compartment and to 102 m2 /gcarbon for Pt/MWNT CCMs as the I/C ratio increased from
100% RH humidified hydrogen in the anode. Cyclic voltammetry 0.3 to 0.8. The porosity of the catalyst layer was obtained from MIP
(CV) and linear sweep voltammetry (LSV) were performed after the measurements (Figure 2d).
conditioning to measure the electrochemical surface area (ECSA) and The pore size distribution of cathode catalyst layers affects non-
crossover current (ix ). Polarization curves were measured at ambient, electrode (ηcorr3 ) and electrode concentration overpotential (ηcorr4 ).
100 kPa and 180 kPa backpressure after CV and LSV. Each data point For KB support, previous work25 has shown that high pore volume
on the polarization curves were equilibrated for 5 minutes at current below 10 nm suggests good ionomer distribution and low magni-
500 mA cm−2 . Al- tude of ηcorr4 . On the other hand, high pore volume in the range of
though not all samples were duplicated in fabrication, the CCMs with 30–100 nm improves the molecular diffusion of oxygen in the
optimized I/C ratios were reproduced and reproducibility were ver- cathode and results in low ηcorr3 . The magnitude of ηcorr3 is usu-
ified (see appendix, Figures A1 and A2). The test conditions were ally higher than that of ηcorr4 , especially at high current density
summarized in Table I. Constant reactant utilization was maintained (>1000 mA cm−2 ). Thus, the mesopore volume between 30 and
for all polarization curves.26 The utilization of hydrogen was kept at 100 nm has higher impact on the total overpotential than the pores less
33%. The utilization of oxygen and air was 5% and 25%, respectively, than 10 nm.
to have the same amount of total flow in the cathode. Low reactant The pore size distribution below 10 nm were calculated based on
utilization was used to minimize the inhomogeneity of local reactant BJH desorption model using the data in nitrogen adsorption exper-
partial pressure and current distribution along the channels of flow iments (Figures 3a, 3c). Pristine KB powders showed a sharp peak
fields. CVs were run for 10 cycles at 20 mV s−1 until there was no in the micropore range (3–4 nm). For Pt/KB CCMs, the peak in
change between the average of the last five cycles and the last cycle. 3–4 nm range was reduced as the I/C ratio was increased, indicating
The last cycle was used to calculate the ECSA. the coverage of ionomer in the micropores. Since the carbon is covered
with ionomer before mixing with Pt particles in the RSDT process,
such high coverage could prevent Pt nanoparticles from being trapped
Results and Discussion in the micropores as would be the case for preparing electrode with
commercial Pt/KB catalyst. Pristine MWNT powder also exhibited
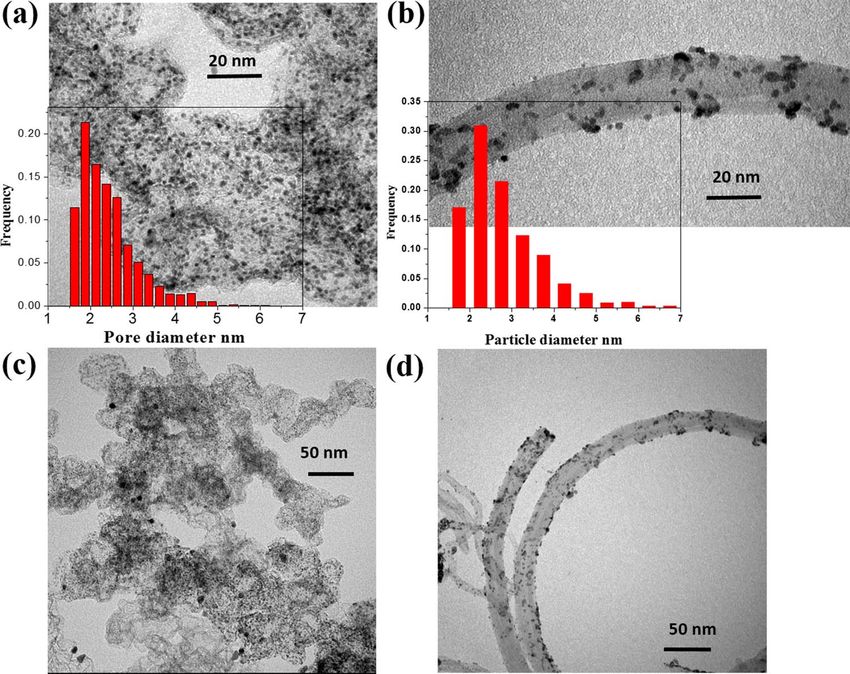
Microstructure of the catalyst layer.—Understanding the catalyst microporosity in the range of 2–5 nm. But for the Pt/MWNT catalyst
layer microstructure is essential to establish the property-performance layer, the microporosity almost disappeared, leaving only the meso-
relation in fuel cells. The Pt particle size in the catalyst layer was pores (20–80 nm). The microporosity for MWNT is likely from the
controlled by the RSDT process to be ∼2 nm for both KB and interstitial volume between the nanotubes, which is filled completely
MWNT to minimize the effect of particle size.33,35 The TEM bright with the incorporation of ionomer.
Table I. Test Conditions for CV and I-V performance.
Anode/Cathode Anode/Cathode Anode/Cathode Cell Scan Window Scan Rate
Test flow rate L min−1 %RH stoic Temperaure◦ C VRHE mV s−1
Cyclic 0.2/0.2 (H2 /N2 ) 100/100 - 80 0.05-1.0 20
voltammetry
Linear sweep 0.2/0.2 (H2 /N2 ) 100/100 - 80 0.05-0.4 2
voltammetry
I-V performance 0.05/0.05 (H2 /O2 ) 100/75 3/20 (H2 /O2 ) 3/4 80 - -
0.05/0.05 (H2 /Air) (H2 /Air)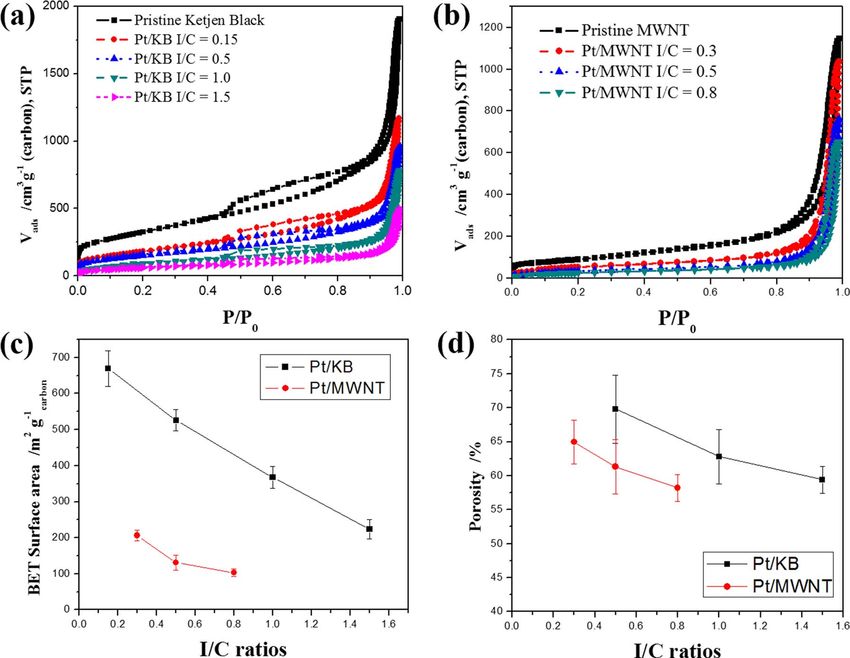
Journal of The Electrochemical Society, 165 (15) J3318-J3334 (2018)                                            J3321

Figure 1. TEM bright field images and Pt particle size distributions of Pt/KB (I/C = 1.0) (a, c) and Pt/MWNT (I/C = 0.5) (b, d) scrapped off from as-deposited
catalyst layer.

    Since the mesopores are not well resolved in nitrogen adsorption              a thin film on the carbon support to maximize the contact with Pt
method, MIP was used to further elucidate the mesopores distribution              nanoparticles.
of Pt/KB and Pt/MWNT catalyst layers (Figures 3b, 3d). Pt/KB and                      The effect of I/C ratios on the fuel cell performance is qualita-
Pt/MWNT both showed a broad distribution of peaks in the range of                 tively presented with uncorrected polarization curves of Pt/KB and
10 to 1000 nm as opposed to Pt/Vulcan which had a sharp peak from                 Pt/MWNT CCMs (Figure 5). The performance of GORE CCMs,25
50 to 100 nm.30 The overall pore volume of Pt/KB CCMs decreased                   as an example of the state-of-the-art commercially available CCMs,
with increasing I/C ratios and the peak pore diameter of the I/C = 0.5            are compared in parallel with RSDT CCMs. Pt/KB and Pt/MWNT
sample was ∼20 nm larger than the rest of the three Pt/KB CCMs.                   CCMs with optimized I/C ratio show higher performance than the
Pt/MWNT showed the same trend where lower I/C ratio (0.3) exhib-                  GORE CCM with 0.1 mg cm−2 Pt loading at current density below
ited larger peak pore diameter. The Pt/MWNT CCM with I/C ratio of                 1000–1200 mA cm−2 . At high current density (>1200 mA cm−2 ) the
0.3 shows higher pore volume in pores ranging from 100 to 1000 nm.                GORE CCM is slightly better than RSDT CCMs. The Pt/KB CCM
The Pt/MWNT CCM with I/C ratio of 0.5 showed the highest pore                     with I/C ratio of 1.0 out-performed all other Pt/KB CCMs in air-
volume in pores ranging from 10 to 100 nm.                                        breathing cells at ambient pressure (Figure 5a). At current density
                                                                                  above 800 mA cm−2 , the slope of polarization curve at I/C ratio of 0.5
   Analysis of polarization losses.—Linear sweep voltammograms                    is reduced compared to CCMs of higher I/C ratios, indicating lower
(LSV) are shown in Figures 4a and 4b where the hydrogen crossover                 oxygen transport limitation. (Figure 5a). This is probably due to the
current, ix (mA cm−2 ) is measured at 0.4 V vs. RHE. The shape of LSV             high porosity (Figure 2d) and broad pore size distribution (Figure 3b)
curves indicates that no electrical short is present for these MEAs. The          at I/C = 0.5 that allows better oxygen diffusion in the high current
ECSA is measured using the cyclic voltammetry (CV) in Figures 4c                  density region. The performance is improved for all Pt/KB CCMs
and 4d:42                                                                         when back pressures are applied (Figures 5b and 5c). At current den-
                                                                                sity below 1200 mA cm−2 , the Pt/KB CCM with I/C ratio of 1.5 shows
                                       Q H (C)
ECSA m 2 g −1 Pt =                                            ∗ 105           the highest performance. This could be due to the higher ORR activity
                     210μC cm Pt L Pt mg Pt cm −2 ∗ A cm 2
                                 2
                                                                                  and lower ORR overpotential loss in the cathode associated with high
                                                                                  I/C ratios. Above 1200 mA cm−2 , the performance of Pt/KB with I/C
                                                                       [13]
                                                                                  ratio of 1.5 decreases faster than other samples, which suggests higher
    The charge of hydrogen adsorption on platinum, QH , was inte-                 oxygen transport limitation due to low catalyst layer porosity.
grated from 0.1 V to 0.4 V (vs. RHE). For Pt/KB, the highest ECSA                     The highest performance is measured with I/C ratio of 0.5 for
for Pt/KB CCMs is 73 m2 gPt −1 measured with an I/C ratio of 1.0. The             Pt/MWNT CCMs (Figures 5d–5f). Note that at low current densities
ECSA decreased slightly to 67 m2 gPt −1 with further increase of I/C              (< 500 mA cm−2 ), the performance of Pt/MWNT CCMs with var-
ratio to 1.5. The ECSA at I/C ratio of 0.5 is the lowest of the three,            ious I/C ratios are similar. The CCM with I/C ratio of 0.5 is only
57.8 m2 gPt −1 , suggesting a low catalyst utilization due to insufficient        slightly higher than the other two CCMs. At high current densities (>
ionomer in the catalyst layer. The highest ECSA for Pt/MWNT is 67                 500 mA cm−2 ), the CCM of I/C ratio 0.5 out-performed the other two
m2 gPt −1 measured with an I/C ratio of 0.5. Since the surface area and           CCMs, which indicates a significant reduction of oxygen transport
porosity of KB is much higher than MWNT, the optimal I/C ratio for                limitation. To establish a relationship between the catalyst layer mi-
ECSA was higher for KB because more ionomer is needed to form                     crostructure and the performance, quantitative analysis of polarization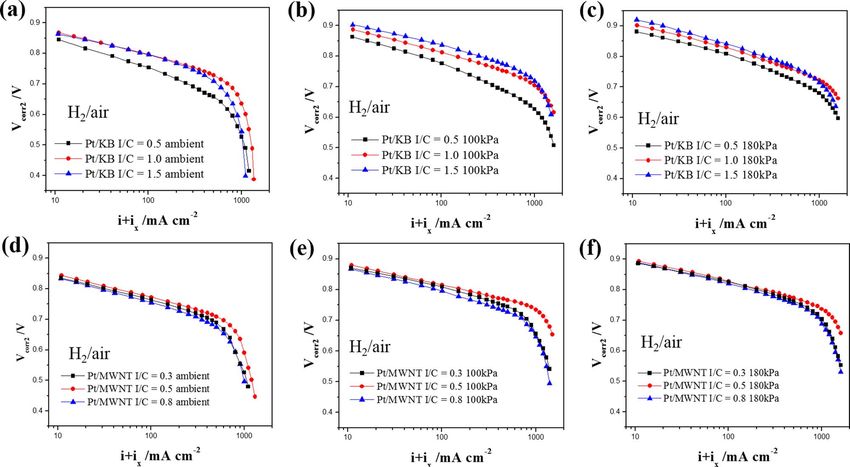
J3322                                    Journal of The Electrochemical Society, 165 (15) J3318-J3334 (2018)

Figure 2. Nitrogen adsorption isotherm for Pt/KB (a) and Pt/MWNT (b) CCMs. BET surface area (c) and porosity (d) of Pt/C catalyst layer are plotted as a
function of I/C ratio. The error bars for BET surface area were obtained from three repeating tests, while the error bars for the porosity were from two identical
sample measurements.

overpotentials is needed. Thus, the six-step method is used in the fol-             trode ohmic resistance (Relectrode ) is measured at I/C ratio of 0.5 due
lowing sections to analyze the effect of I/C ratios on different polar-             to insufficient amount of ionomer in the cathode (Figure 6a). Further
ization overpotentials.                                                             increase of I/C ratio to 1.0 significantly reduced the Relectrode , follow by
    The characteristic parameters obtained from the six-step method                 a slight increase at I/C ratio of 1.5. Although high I/C ratios improved
for all CCMs and operating pressures are summarized in the Appendix                 ionic conductivity of cathode, a counter effect occurs with too much
(Tables A1–A6). The dash lines in Figures 5a–5f shows the calculated                ionomer.
polarization curves where the total potential loss is calculated with                   This contrasts with the results from Liu et al.43 where the ionic
the six-step method. Good agreement between the six-step method                     resistivity decreases monotonically with increasing I/C ratios. Liu
and experimental data is obtained25 with error less than 0.1 mV. Three              et al.43 extrapolated the ionic resistivity from EIS measured when the
Tafel regions can be distinguished for all CCMs in Tables A1–A6, in                 fuel cell is operating in H2 /N2 environment. The Rcathode measured
agreement with our previous work.25 Every Tafel region is dominated                 in the present work can be considered as the apparent cathode ohmic
by one factor. At kinetic current density > 1000 mA cm−2 (>800 mA                   resistance derived from the H2 /Air and H2 /O2 polarization curves. Fac-
cm−2 for ambient pressure polarization curves), the major contribution              tors such as oxygen reduction reaction, gas transport, water transport,
of this polarization overpotential is the molecular diffusion of oxygen             and current distribution etc. are all considered when the fuel cell is
which is the source of the non-electrode concentration overpotential                operating. On the other hand, the EIS method using transmission-line
(ηcorr3 ). At a kinetic current density of 100–1000 mA cm−2 , the major             model focus solely on measuring the through plain ionic resistivity.43
contribution of polarization overpotential is the cathode concentration             The other factors are minimized as much as possible in the H2 /N2 en-
overpotential (ηcorr4 ) which is attributed to the Knudsen diffusion                vironment where there is no oxygen reduction reaction in the cathode
of oxygen in the cathode and the oxygen transport in the ionomer                    and the mass transport issue is minor. Therefore, although a mono-
thin film and at the ionomer/Pt interface. At kinetic current density               tonic trend is observed with the EIS method,43 it is not necessarily the
10–100 mA cm−2 , the major contribution of polarization is the ORR                  case with the present work. Moreover, the values reported in Ref. 43
kinetics because the current-potential relation is governed by Tafel                corresponds to 3  cm2 to 0.3  cm2 of cathode resistance from I/C
relation.25                                                                         ratio of 0.2 to 1.2. On the other hand, the Rcathode calculated in the
                                                                                    present work is from 0.06  cm2 to 0.015  cm2 , approximately an
    Non-electrode and electrode ohmic overpotentials (ηcorr1 and                    order of magnitude less than the values reported in Ref. 43. Although
ηcorr2 ).—The non-electrode ohmic resistance were comparable for all                the ionic resistivity measured with the EIS method is likely reflecting
samples tested, ranging from 0.055 to 0.08 Ohm cm2 (Tables A1–A6)                   the real values, it cannot be used for overpotential correction. This
in agreement with our previous work using the same type of Nafion                   also suggests that the trend observed with the EIS method may not be
membrane and test conditions.25 For Pt/KB CCMs, the highest elec-                   applicable to the six-step method in this work.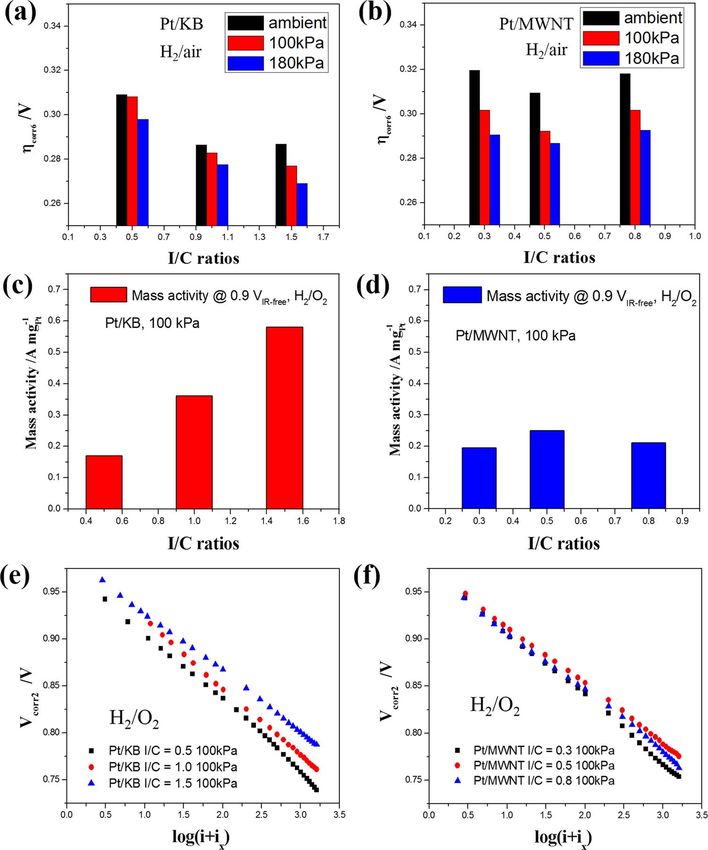
Journal of The Electrochemical Society, 165 (15) J3318-J3334 (2018)                                             J3323

Figure 3. Pore size distributions obtained from nitrogen adsorption (a, c) and MIP (b, d) methods for Pt/KB (a, b) and Pt/MWNT (c, d) catalyst layer.

    On the other hand, the Relectrode measured for Pt/MWNT CCMs                        For Pt/MWNT CCMs, the influence of I/C ratio at low current
are close to each other with a deviation less than 0.005 Ohm cm2 in                density is not significant and reduces with higher operating pressure.
magnitude (Figure 6b). Note that the magnitude of Relectrode measured              Since the surface area and porosity of MWNT is much lower than
for Pt/MWNT CCMs is close to the Pt/KB CCMs at high I/C ratios,                    KB, it is possible that less ionomer is needed to reach the maximum
1.0 and 1.5. Since MWNT has low surface area and extremely low                     ORR activity. At medium and high current density, the median I/C
microporosity, most of the ionomer is distributed at the surface and               ratio of 0.5 shows the highest performance. While an I/C ratio of 0.3 is
forms a continuous thin film for ionic transport. In other words, the              insufficient for optimal performance, I/C ratio of 0.8 is likely too much
high-surface-area carbon support has low utilization of ionomer be-                for MWNT where lumps of ionomer could occur and significantly
cause the micropores needs to be filled before a continuous ionomer                increases the oxygen transport limitation.
thin film forms at the surface. Once the ionomer content is enough for
a continuous thin film, the magnitude of Relectrode reaches a low mag-                 Non-electrode concentration overpotential (ηcorr3 ).—The influ-
nitude that is similar regardless of the carbon support type. Further              ence of I/C ratio on the non-electrode concentration overpotential
increase of ionomer content results in higher Relectrode as is the case            (ηcorr3 ) for Pt/KB and Pt/MWNT CCMs are shown in Figure 8. Since
with Pt/KB CCM at I/C ratio of 1.5.                                                the same type of GDL was used for all RSDT-derived CCMs, it can be
    Figure 7 shows the H2 /Air Tafel plot for Pt/KB and Pt/MWNT                    inferred that the only factor influencing the non-electrode concentra-
CCMs after correction of non-electrode and cathode electrode ohmic                 tion overpotential is the microstructure of the catalyst layer (Figures
overpotentials. The Tafel plot reveals the dominating process at dif-              2, 3) determined by I/C ratio and carbon support. The ηcorr3 stems
ferent current densities. For Pt/KB CCMs, the performance at low                   from the molecular diffusion of oxygen in the flow channels, GDL,
current density (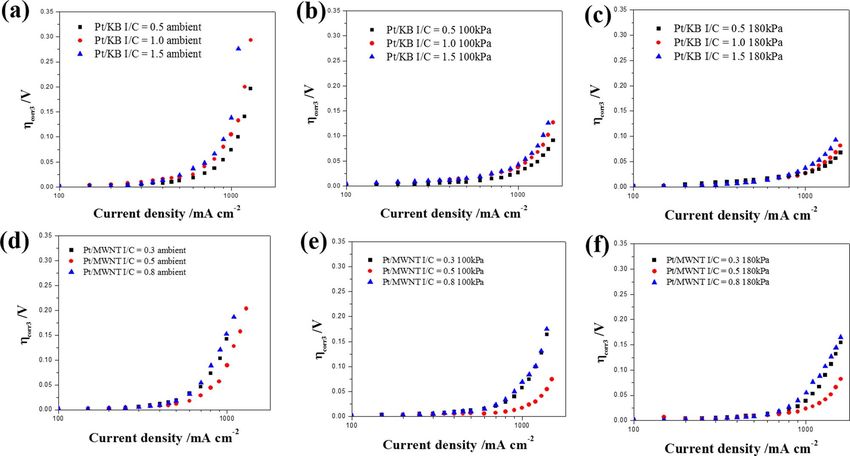
J3324                                  Journal of The Electrochemical Society, 165 (15) J3318-J3334 (2018)

                                                                                                            Figure 4. Linear sweep voltammetry (a, b)
                                                                                                            and cyclic voltammetry (c, d) of RSDT-
                                                                                                            derived CCMs with various I/C ratios. The
                                                                                                            measured ECSA is plotted in (e). Refer to
                                                                                                            Table I for testing conditions.

is lower than all other Pt/KB CCMs. As the I/C ratio was increased            in the ionomer thin film and in the small pores cathode catalyst layer
to 1.0 and 1.5, the porosity and the pore volume decreased (Figure 3)         where Knudsen diffusion dominates. The linearity of plotting against
which lead to higher ηcorr3 (Figures 8a–8c).                                  log current stems from the Butler-volmer equation (Equation 7). The
    For Pt/MWNT CCMs, the sample at I/C ratio of 0.5 shows the                magnitudes of ηcorr4 are generally lower than the GORE CCM at
lowest magnitude of ηcorr3 . The pore size distribution for the I/C ratio     0.1 mg cm−2 cathode Pt loading,25 except for the Pt/KB CCM at I/C
0.5 CCM showed higher pore volume with pore diameter of 30 to                 ratio of 0.5 which has similar magnitude of ηcorr4 with the GORE CCM.
100 nm than the samples with I/C ratios of 0.3 and 0.8, both of               As the magnitude of ηcorr4 is small, the effect of operation pressure
which showed similar distribution in the same range (Figure 3d). It is        is less pronounced than that reported in Ref. 25. The change of ηcorr4
interesting that the sample at I/C ratio of 0.3 shows higher porosity         with different pressures could be due to the variance in determining the
and pore volume in the range of 100 nm to 1000 nm. However, this              Tafel slopes. Although commercial GORE CCMs suggests possible
does not effectively reduce the magnitude of ηcorr3 . Because the role        influence of operating pressure in oxygen diffusion through ionomer
of small pores outweighs large pores as oxygen must diffuse into the          thin film, the results in Figure 9 do not show a strong dependence
small pores to reach the platinum sites. It is likely that the contribution   of operating pressure. For Pt/KB CCMs (Figures 9a–9c), the lowest
of larger pores in the overall pore volume is less than that in the range     magnitude of ηcorr4 is found at the optimal I/C ratio of 1.0. At low I/C
of 30–100 nm. Thus, for both Pt/KB and Pt/MWNT CCMs, high pore                ratio of 0.5, the ηcorr4 shows the highest magnitude at all operating
volume in the range of 30–100 nm results in lower ηcorr3 , in agreement       pressures. Further increase of I/C ratio from 1.0 to 1.5 results in higher
with our previous study of commercial GORE CCMs.25                            ηcorr4 due to thick ionomer film covering the Pt catalyst. For Pt/MWNT
                                                                              CCMs, the lowest magnitude of ηcorr4 is also found for the optimum I/C
    Electrode concentration overpotential (ηcorr4 ).—The effect of I/C        ratio of 0.5. The highest magnitude of ηcorr4 was found at the highest
ratio on electrode concentration overpotential (ηcorr4 ) for Pt/KB and        I/C ratio, 0.8, followed by the I/C ratio of 0.3 and 0.5 (Figures 9d–9f).
Pt/MWNT CCMs at various operating pressures are shown in Figure                   To illustrate the oxygen transport mechanism in the ionomer film,
9. The origin of ηcorr4 is attributed to the oxygen diffusion limitation      Nonoyama et al.22 and Jomori et al.45 introduced a concept of effective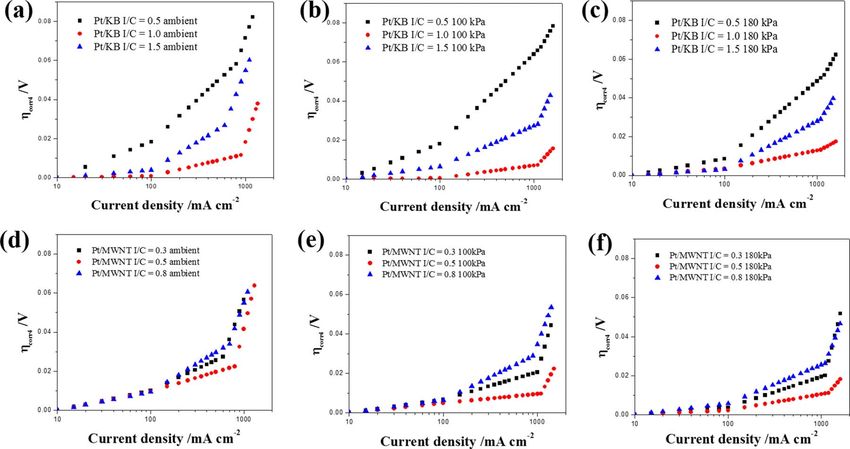
Journal of The Electrochemical Society, 165 (15) J3318-J3334 (2018)                                         J3325

Figure 5. Polarization curves of Pt/KB (a-c) and Pt/MWNT (d-f) CCMs fabricated through RSDT process with various I/C ratios and operating pressures.
Performances of GORE CCMs at 0.4 and 0.1 mg cm−2 cathode Pt loading are displayed for comparison.25 Dash lines are calculated polarizations curves using
the six-step method and good agreement with the experimental data is found. Refer to Table I for testing conditions.

ionomer area which is proportional to the ECSA. Jomori et al. pro-               Figures 10c and 10d, where high ηcorr6 is associated with low ORR
posed a non-linear relation between the oxygen transport resistance in           activity. It is noted that the ηcorr6 of Pt/MWNT CCMs is more sensitive
the cathode and the ECSA where the transport resistance decrease with            to the change of operating pressure than Pt/KB CCMs. On the other
increasing ECSA. For RSDT-derived Pt/KB and Pt/MWNT CCMs,                        hand, the ORR activity is less sensitive to I/C ratios. This is reflected
the magnitude of ηcorr4 qualitatively agrees with the magnitude of               in the H2 /Air Tafel plot at low current density (Figure 7) where the
ECSA at various I/C ratios. Note that Jormri et al. assumed spherical            curves for Pt/MWNT improves with operating pressure but varies less
carbon particles and uniform ionomer thickness which are not appro-              than Pt/KB CCMs.
priate in a real cathode. However, the concept of effective ionomer                  The relation between mass activity and I/C ratio is different be-
area can be used to interpret the correlation between ηcorr4 and ECSA            tween KB and MWNT. This could be related to different micropore
for Pt/KB and Pt/MWNT CCMs. Further study on the effect of carbon                volume and surface area between KB and MWNT. For high-surface-
support geometry, such as aspect ratio and curvature, is required to             area KB, extended ionomer coverage could be achieved at higher I/C
validate the concept of effective ionomer area.                                  ratio, without increasing the ionomer film thickness.46 The carbon
                                                                                 grains and the ionomer are well percolated forming complete path
                                                                                 of electrons and protons from GDL to PEM.47 Therefore, a continu-
   ORR kinetics and catalyst activity (ηcorr5 and ηcorr6 ).—Figure 10
                                                                                 ous decrease of activation overpotential with the increase of I/C ratio
shows comparison of activation overpotential (ηcorr6 ) and ORR activity
                                                                                 was observed, which lead to an increase of ORR activity with the
measured in oxygen-breathing cells at 0.9 VIR-free , 100 kPa. The ηcorr6
                                                                                 I/C ratio. For MWNT, as the micropores are immediately filled with
presented in Figures 10a and 10b agree with the ORR activity in

Figure 6. The electrode ohmic resistance (Relectrode ) measured for Pt/KB (a) and Pt/MWNT (b) CCMs at various I/C ratios and operating pressures.
J3326                                  Journal of The Electrochemical Society, 165 (15) J3318-J3334 (2018)

Figure 7. H2 /Air Tafel plots of Pt/KB (a-c) and Pt/MWNT (d-f) CCMs fabricated through RSDT process with various I/C ratios and operating pressures.
Non-electrode and electrode resistances are corrected. All plots are corrected with crossover current, ix .

ionomer upon mixing (Figure 3c), excessive ionomer could remain                 Based on Equation 9, the magnitude of Tafel slope is a direct mea-
on the external surface of the carbon. The maximum ORR activity                 surement of the overpotential due to ORR kinetics (ηcorr5 ). Figure 11
is obtained at I/C ratio of 0.5, which suggest that further increase of         shows that the Tafel slopes decreased slightly with the increase of I/C
ionomer content in the catalyst no longer enhance the triple-boundary           ratio, for both Pt/KB and Pt/MWNT CCMs, which agrees with the
interface between carbon, ionomer and Pt.                                       fact that higher ORR activity is found at higher I/C ratios (Figures 10c
    The Tafel slopes (Figure 11) for each CCMs are measured in the              and 10d). A recent work from Ishikawa et al. also shows low overpo-
current range of 10–100 mA cm−2 and the results lies between 60 and             tential with increasing I/C ratio which is attributed to improved proton
70 mV/dec., in agreement with the theoretical value of 70 mV/dec.               transport due to increased ionomer connectivity and reduced ionomer

Figure 8. Non-electrode concentration overpotential of Pt/KB (a-c) and Pt/MWNT (d-f) CCMs at various I/C ratio and operating pressures.
Journal of The Electrochemical Society, 165 (15) J3318-J3334 (2018) J3327
Figure 9. Cathode electrode concentration overpotential of Pt/KB (a-c) and Pt/MWNT (d-f) CCMs at various I/C ratio and operating pressures.
tortuosity.48 Another possibility is related to ionomer adsorption on is because the RSDT CCMs used thicker membrane (50 μm) than
the Pt surface which has been reported via the sulfonic acid group.49 the GORE CCMs (18 μm) while the test hardware and GDL type
It is likely that higher I/C ratio provide higher coverage of Nafion on were consistent for all sample tested. Thus, thinner membrane (about
the Pt surface, leading to a lower Tafel slope. 20 μm thickness) is recommended for future studies. In the mean-
time, RSDT process parameters may require adjustment to reduce the
Contribution of six polarization sources in PEMFC influence of process temperature on the membrane during fabrication
performance.—For a comprehensive understanding of PEMFC po- to prevent drying/deformation.
larization, Figure 12 summarizes the contribution of six types of po- In summary, at optimized I/C ratios KB shows lower activation
larization overpotentials for RSDT-derived CCMs and GORE CCMs. overpotential but higher non-electrode concentration overpotential
The analysis of overpotentials for the GORE CCMs can be found than those for MWNT. Since the total polarization overpotential is
in our previous work.25 The total polarization overpotentials (mV) comparable between KB and MWNT, MWNT is preferred for cata-
are similar for all CCMs with 0.1 mg cm−2 cathode Pt loading lyst support in PEMFC as it requires 50% less ionomer in the cathode.
(Tables A7–A9) with variances less than 5 mV, which agrees with Reduction of ionomer use can reduce the fabrication cost for the elec-
Figure 5 where comparable performance can be found at current den- trodes. More importantly, MWNT is more resistant to corrosion at
sities selected in Figure 12. high potentials during start/stop and fuel starvation conditions.54–56
Overpotentials related to ORR activation and Tafel kinetics are the The present work demonstrates that the six-step method of polariza-
dominant sources of polarization for all CCMs, including the high Pt tion analysis is a powerful tool to separate six types of overpotentials
loading GORE CCM (Figure 12). Although overpotentials related to and correlate them with catalyst layer properties, fabrication process,
ORR is mainly determined by the catalyst material (Pt), high I/C ratio and testing parameters/conditions. The six-step method points out a
for Pt/KB CCMs results in lower ORR activation overpotential than path for future optimization of low Pt-loading electrodes with specif-
Pt/MWNT and GORE CCMs. However, the Pt/KB CCMs has higher ically targeted overpotentials.
non-electrode concentration overpotential than Pt/MWNT and GORE
CCMs. Because the pore volume between 30 to 100 nm is reduced
Conclusions
at high I/C ratio. Therefore, the total overpotentials are comparable
among all RSDT and GORE CCMs at 0.1 mg cm−2 Pt loading. The In this study, CCMs with two types of carbon supports and vari-
benefit of reduced activation overpotential due to high I/C ratio is ous I/C ratios were fabricated in RSDT process where low Pt loading
counter-balanced by the reduction of pore volume in the catalyst layer. (0.1 mg cm−2 ) catalyst layer were directly deposited on Nafion mem-
The contribution of non-electrode concentration overpotential for branes. The optimal performance in air-breathing cells was achieved
both RSDT CCMs in Figure 12 are higher than the GORE CCMs. at I/C ratio of 1.0 for Pt/KB CCMs and at I/C ratio of 0.5 for Pt
Since the GDL type are consistent for all CCMs tested, the non- /MWNT CCMs. Six types polarization sources were analyzed and the
electrode concentration overpotential reflects the microstructure of key results from this study are:
cathode catalyst layer. It is shown in our previous work25 that this is
because the cathode of RSDT CCMs have lower pore volume in the 1. The non-electrode ohmic resistance (ηcorr1 ) are comparable for
range of 30–100 nm. Further optimization for RSDT-derived CCMs all cells as the MEA materials and hardware are consistent in this
will focus on increasing the mesopore volume of cathode catalyst layer work. The cathode electrode ohmic resistance (ηcorr2 ) depends
using carbon support with controlled mesopore distribution.50–53 On on I/C ratio for Pt/KB CCMs. Lowest ηcorr2 is measured at the
the other hand, the contribution of cathode electrode concentration optimal I/C ratio of 1.0. On the other hand, ηcorr2 is less sensitive
overpotential is lower for both RSDT CCMs at optimized I/C ratios. to the I/C ratio for Pt/MWNT CCMs and thus low I/C ratios can
This demonstrates the advantage of RSDT process for improving the be used to reduce the cost.
ionomer distribution in the cathode catalyst layer.25,30 2. Non-electrode concentration overpotential (ηcorr3 ) is controlled
Lastly, the non-electrode ohmic overpotential for both RSDT by the molecular diffusion of oxygen in the GDL and in the
CCMs make higher contribution than that for the GORE CCMs. This mesopores of the catalyst layer. It is reduced with higher backJ3328 Journal of The Electrochemical Society, 165 (15) J3318-J3334 (2018) Figure 10. Comparison of activation overpotential for Pt/KB (a) and Pt/MWNT (b) CCMs with various I/C ratios and operating pressures. Comparison of mass activity measured in oxygen-breathing cells at 0.9 VIR-free , 100 kPa back pressure for Pt/KB (c) and Pt/MWNT CCMs (d). The mass activity is calculated using the Tafel plots in (e) and (f). Figure 11. Comparison of Tafel slope measured from H2 /O2 polarization curves (10–100 mA cm−2 ) for Pt/KB (a) and Pt/MWNT (b) CCMs with various I/C ratios and operating pressures.
Journal of The Electrochemical Society, 165 (15) J3318-J3334 (2018)                                              J3329

Figure 12. Contribution of six types polarization overpotentials for RSDT CCMs (Pt/KB and Pt/MWNT) with cathode Pt loading of 0.1 mg cm−2 . Overpotentials
are calculated at 1000 mA cm−2 with ambient pressure and at 1400 mA cm−2 with 100kPa backpressure. GORE PRIMEA CCM with 0.1 and 0.4 mg cm−2
cathode Pt loading are shown for comparison purpose. All data are taken from Tables A7–A10.

     pressure or higher pore volume in the pore range of 30 nm-
     100 nm. At optimized I/C ratio, the ηcorr3 for Pt/KB CCM is
     higher than Pt/MWNT CCM due to lower pore volumes between
     30 nm and 100 nm.
3.   The cathode electrode concentration overpotential (ηcorr4 ) is re-
     lated to the oxygen transport in the micropores (Knudsen diffu-
     sion) and ionomer thin film. For both carbon supports, ηcorr4 was
     found to be proportional to the ECSA. The I/C ratio with highest
     ECSA suggests a maximum of effective ionomer area, which re-
     sults in minimal oxygen diffusion resistance in the ionomer thin
     film and thus gives the lowest ηcorr4 .
4.   The ORR overpotentials (ηcorr5 and ηcorr6 ) decreased with in-
     creasing I/C ratios for Pt/KB suggesting improved triple-phase
     boundary between Pt, carbon and ionomer and enhanced ionomer
     coverage on the carbon. Since MWNT has lower surface area and
     microporosity than KB, the ideal ionomer coverage requires less
     ionomer and the ORR overpotentials of Pt/MWNT does not vary
     significantly with the I/C ratio.

                                                                                             Figure A1. Comparison of Pt/KB CCM with different anode I/C ratios and
    The present work demonstrates that the six-step method is a pow-                         duplicated cathodes. Test performed at 80◦ C, ambient pressure, 100/75%RH,
erful tool to separate polarization overpotentials and to provide a clear                    H2/air stoic 3/4, H2 /O2 stoic 3/20. Anode loading: 0.05 mg cm−2 ; cathode
path for optimization with specifically targeted overpotentials. Com-                        loading 0.1 mg cm−2 , I/C ratio 1.0.
paring with GORE CCMs, the RSDT-derived CCMs shows low ηcorr4
due to improved ionomer distribution but high ηcorr3 due to insufficient
pore volume in the range of 30–100 nm. Using carbon supports with
controlled mesopore distribution will allow for a better balance be-
tween the pore volume and the ionomer content that can help reduce
ηcorr3 . In addition, using a thinner membrane can help reduce ηcorr1
for RSDT-derived CCMs. Since the performance of RSDT-derived
Pt/KB and Pt/MWNT CCMs at optimized I/C ratio is comparable, it
is beneficial to use MWNT for low Pt-loading electrode due to lower
ionomer usage in the cathode and better chemical stability against
corrosion.

                                Acknowledgment
    The authors gratefully acknowledge the UConn Research Founda-
tion and National Science Foundation [grant number CMMI-1265893]
for financial support.

                                                                                             Figure A2. Comparison of Pt/MWNT CCMs from two duplicated samples.
                                      Appendix                                               Test performed at 80◦ C, 100 kPa backpressure, 100/75%RH, H2/air stoic 3/4,
     Characteristic parameters used for calculating six sources of polarization overpoten-   H2 /O2 stoic 3/20. Anode loading: 0.05 mg cm−2 ; cathode loading 0.1 mg
tials.                                                                                       cm−2 , I/C ratio 0.5.
J3330 Journal of The Electrochemical Society, 165 (15) J3318-J3334 (2018)
Table A1. Characteristic parameters of RSDT-derived MEA tested at ambient pressure with different I/C ratio using KB as supports. These
parameters are used to calculate all six sources of polarization sources.
Related
Overpotential Characteristics Unit Pt/KB I/C = 0.5 Pt/KB I/C = 1.0 Pt/KB I/C = 1.5
N/A Equilibrium cell voltage, air, Veq V 1.1537 1.1537 1.1537
ohmic, Nonelectrode ohm-cm2 0.065–0.08 0.060–0.064 0.058–0.065
nonelectrode
ohmic, electrode Electrode ohmic resistance, Relectrode ohm-cm2 0.069 0.015 0.032
Concentration, Limiting current, air, ilim mA/cm2 1310 1450 1130
non-electrode
Concentration, Slope of Ilim plot, 10–100 mA cm−2 mV/dec. 91.5 72.21 67.92
electrode air, b‘(i>ib )
100–800 mA 117 82.84 93.51
cm−2
>800 mA cm−2 208.89 219.05 191.21
Concentration, Breaking current density, air, ib mA/cm2 10 10 10
electrode
Activation, Tafel Kinetic Tafel slope, B (10–100 mA/cm2 mV/dec. 75.25 71.49 63.98
H2 /O2 curve)
Table A2. Characteristic parameters of RSDT-derived MEA tested at 100 kPa back pressure with different I/C ratio using KB as supports. These
parameters are used to calculate all six sources of polarization sources.
Related
Overpotential Characteristics Unit Pt/KB I/C = 0.5 Pt/KB I/C = 1.0 Pt/KB I/C = 1.5
N/A Equilibrium cell voltage, air, Veq V 1.1724 1.1724 1.1724
ohmic, Nonelectrode ohm-cm2 0.057–0.065 0.062–0.065 0.055–0.065
nonelectrode
ohmic, electrode Electrode ohmic resistance, Relectrode ohm-cm2 0.060 0.012 0.023
Concentration, Limiting current, air, ilim mA/cm2 1815 1860 1735
non-electrode
Concentration, Slope of Ilim 10–100 mA mV/dec. 87.61 76.19 66.96
electrode plot, air, b‘ cm−2
(i>ib )
100–1000 mA 114.76 82.28 81.24
cm−2
>1000 mA 154.49 127.43 169.67
cm−2
Concentration, Breaking current density, air, ib mA/cm2 10 10 10
electrode
Activation, Tafel Kinetic Tafel slope, B (10–100 mA/cm2 mV/dec. 73.24 75.75 60.3
H2 /O2 curve)
Table A3. Characteristic parameters of RSDT-derived MEA tested at 180 kPa back pressure with different I/C ratio using KB as supports. These
parameters are used to calculate all six sources of polarization sources.
Related
Overpotential Characteristics Unit Pt/KB I/C = 0.5 Pt/KB I/C = 1.0 Pt/KB I/C = 1.5
N/A Equilibrium cell voltage, air, Veq V 1.1790 1.1790 1.1790
ohmic, Nonelectrode ohm-cm2 0.065–0.08 0.060–0.065 0.058–0.065
nonelectrode
ohmic, electrode Electrode ohmic resistance, Relectrode ohm-cm2 0.060 0.013 0.022
Concentration, Limiting current, air, ilim mA/cm2 2075 1955 1840
non-electrode
Concentration, Slope of Ilim 10–100 mA mV/dec. 73.99 74.77 64.69
electrode plot, air, b‘ cm−2
(i>ib )
100–1200 mA 105.38 80.48 86.53
cm−2
>1200 mA 148.75 97.27 140.55
cm−2
Concentration, Breaking current density, air, ib mA/cm2 10 10 10
electrode
Activation, Tafel Kinetic Tafel slope, B (10–100 mA/cm2 mV/dec. 71.8 71.16 61.49
H2 /O2 curve)Journal of The Electrochemical Society, 165 (15) J3318-J3334 (2018) J3331
Table A4. Characteristic parameters of RSDT-derived MEA tested at ambient pressure with different I/C ratio using MWNT as supports. These
parameters are used to calculate all six sources of polarization sources.
Related
Overpotential Characteristics Unit Pt/MWNT I/C = 0.3 Pt/MWNT I/C = 0.5 Pt/MWNT I/C = 0.8
N/A Equilibrium cell voltage, air, Veq V 1.1537 1.1537 1.1537
ohmic, Nonelectrode ohm-cm2 0.06–0.072 0.06–0.07 0.065–0.075
nonelectrode
ohmic, electrode Electrode ohmic resistance, ohm-cm2 0.020 0.015 0.022
Relectrode
Concentration, Limiting current, air, ilim mA/cm2 1150 1450 1200
non-electrode
Concentration, Slope of Ilim 10–100 mA mV/dec. 79.1 72.31 71.6
electrode plot, air, cm−2
b‘(i>ib )
100–800 mA 90.8 76.72 91.2
cm−2
>800 mA cm−2 201.2 258.82 198.4
Concentration, Breaking current density, air, ib mA/cm2 10 10 10
electrode
Activation, Tafel Kinetic Tafel slope, B mV/dec. 68.64 62.4 61.99
(10–100 mA/cm2 H2 /O2 curve)
Table A5. Characteristic parameters of RSDT-derived MEA tested at 100 kPa back pressure with different I/C ratio using MWNT as supports.
These parameters are used to calculate all six sources of polarization sources.
Related
Overpotential Characteristics Unit Pt/MWNT I/C = 0.3 Pt/MWNT I/C = 0.5 Pt/MWNT I/C = 0.8
N/A Equilibrium cell voltage, air, Veq V 1.1724 1.1724 1.1724
ohmic, Nonelectrode ohm-cm2 0.06–0.07 0.055–0.065 0.07–0.075
nonelectrode
ohmic, electrode Electrode ohmic resistance, Relectrode ohm-cm2 0.025 0.021 0.02
Concentration, Limiting current, air, ilim mA/cm2 1560 1775 1625
non-electrode
Concentration, Slope of Ilim 10–100 mA mV/dec. 71.77 65.33 67.8
electrode plot, air, b‘ cm−2
(i>ib )
100–1000 mA 79.1 64.92 84.77
cm−2
>1000 mA 227.77 153.96 189.39
cm−2
Concentration, Breaking current density, air, ib mA/cm2 10 10 10
electrode
Activation, Tafel Kinetic Tafel slope, B mV/dec. 64.98 62.21 61.18
(10–100 mA/cm2 H2 /O2 curve)
Table A6. Characteristic parameters of RSDT-derived MEA tested at 180 kPa back pressure with different I/C ratio using MWNT as supports.
These parameters are used to calculate all six sources of polarization sources.
Related
Overpotential Characteristics Unit Pt/MWNT I/C = 0.3 Pt/MWNT I/C = 0.5 Pt/MWNT I/C = 0.8
N/A Equilibrium cell voltage, air, Veq V 1.1790 1.1790 1.1790
ohmic, Nonelectrode ohm-cm2 0.052–0.066 0.06–0.07 0.065–0.075
nonelectrode
ohmic, electrode Electrode ohmic resistance, Relectrode ohm-cm2 0.023 0.025 0.025
Concentration, Limiting current, air, ilim mA/cm2 1875 1925 1860
non-electrode
Concentration, Slope of Ilim 10–100 mA mV/dec. 68.86 64.52 65.21
electrode plot, air, b‘ cm−2
(i>ib )
100–1200 mA 80.66 70.47 79.04
cm−2
>1200 mA 260.34 118.64 183.95
cm−2
Concentration, Breaking current density, air, ib mA/cm2 10 10 10
electrode
Activation, Tafel Kinetic Tafel slope, B mV/dec. 64 60.28 59.18
(10–100 mA/cm2 H2 /O2 curve)J3332
Table A7. Contribution of different polarization sources for Pt/KB CCM at I/C ratio of 1.0.
Pt/KB Pt/KB Pt/KB
I/C = 1.0 ambient I/C = 1.0 100kPa I/C = 1.0 180kPa
Related
Overpotential Characteristics i = 500 Percent % i = 1000 Percent % i = 700 Percent % i = 1400 Percent % i = 700 Percent % i = 1400 Percent %
ηcorr1 Non-electrode ohmic 31.4 6.4 64.8 9.9 42.9 8.7 88.2 14.0 42.1 8.6 84.5 14.2
(mV)
ηcorr2 Electrode ohmic (mV) 7.5 1.5 15.0 2.3 10.5 2.1 21.0 3.3 9.1 1.9 18.2 3.1
ηcorr3 Non-electrode 39.2 8.0 128.0 19.6 14.2 2.9 61.3 9.8 19.3 3.9 48.4 8.1
Journal of The Electrochemical Society, 165 (15) J3318-J3334 (2018)
concentration (mV)
ηcorr4 electrode concentration 8.6 1.8 18.2 2.8 5.9 1.2 12.6 2.0 11.3 2.3 15.9 2.7
(mV)
ηcorr5 Tafel kinetics: 119.0 24.2 140.0 21.5 137.0 27.7 160.0 25.5 129.0 26.4 150.0 25.2
∗
b log(i/10)
ηcorr6 Activation at 10 mA 285.5 58.1 285.5 43.8 284.9 57.5 284.9 45.4 277.5 56.8 277.5 46.7
cm−2
ηTotal Total polarization loss 491.2 651.5 495.4 628.0 488.3 594.5
(mV)
Table A8. Contribution of different polarization sources for Pt/MWNT CCM at I/C ratio of 0.5.
Pt/MWNT Pt/MWNT Pt/MWNT
I/C = 0.5 ambient I/C = 0.5, 100kPa I/C = 0.5 180kPa
Related
Overpotential Characteristics i = 500 Percent % i = 1000 Percent % i = 700 Percent % i = 1400 Percent % i = 700 Percent % i = 1400 Percent %
ηcorr1 Non-electrode ohmic 34.6 7.1 72.7 11.2 48.0 9.9 98.5 15.6 35.9 7.6 74.6 12.6
(mV)
ηcorr2 Electrode ohmic (mV) 7.5 1.5 15.0 2.3 14.7 3.0 29.4 4.7 17.5 3.7 35.0 5.9
ηcorr3 Non-electrode 11.6 2.4 89.0 13.7 12.7 2.6 64.5 10.2 13.0 2.7 51.6 8.7
concentration (mV)
ηcorr4 electrode concentration 19.5 4.0 41.5 6.4 8.8 1.8 19.5 3.1 9.2 1.9 14.9 2.5
(mV)
ηcorr5 Tafel kinetics: 104.0 21.4 122.0 18.8 109.0 22.5 127.0 20.1 112.0 23.6 131.0 22.1
b∗ log(i/10)
ηcorr6 Activation at 10 mA 309.5 63.6 309.5 47.6 292.0 60.2 292.0 46.3 286.7 60.4 286.7 48.3
cm−2
ηTotal Total polarization loss 486.7 649.7 485.2 630.9 474.3 593.8
(mV)You can also read