Assessment of the applicability of a low cost sensor-based methane monitoring system for continuous multi channel sampling
←
→
Page content transcription
If your browser does not render page correctly, please read the page content below
Environ Monit Assess (2021) 193:509 https://doi.org/10.1007/s10661-021-09290-w Assessment of the applicability of a low‑cost sensor–based methane monitoring system for continuous multi‑channel sampling Isura Sumeda Priyadarshana Nagahage · Ekanayaka Achchillage Ayesha Dilrukshi Nagahage · Takeshi Fujino Received: 24 February 2021 / Accepted: 12 July 2021 © The Author(s) 2021 Abstract Systems that are made of several low-cost of 0.096, 0.145, 0.193, and 0.241% measured by the gas sensors with automatic gas sampling may have TGS 2611 sensor were 0.0641, 0.1749, 0.0157, and the potential to serve as reliable fast methane analyz- 0.1613, whereas those NRMSEs of the same concen- ers. However, there is a lack of reports about such trations measured by the MQ-4 sensor were 0.3143, types of systems evaluated under field conditions. 0.5766, 0.6301, and 0.6859, respectively. Labora- Here, we developed a continuous methane monitor- tory-scale anaerobic digesters were tested using the ing system with automated gas sampling unit using developed system. The anaerobic digesters were con- low-cost gas sensors, TGS 2611 and MQ-4, that use tinuously operated for 2 months, demonstrating the a simple cloud-based data acquisition platform. We potential use of sensors for detecting and monitoring verified the consistency, repeatability, and reproduc- methane in the field level application. This study uti- ibility of the data obtained by TGS 2611 and MQ-4 lized a unique way to combine the advantages of low- low-cost gas sensors by measuring high- and low- cost sensors and develop a reliable monitoring system concentration methane samples. The normalized by minimizing drawbacks of low-cost sensors. root-mean-square errors (NRMSEs) of the samples with high methane concentrations, [CH4] of 3, 4, 6, Keywords Air quality · Methane sensor · Methane and 7%, were 0.0788, 0.0696, 0.1198, and 0.0719 monitoring system · Multi-channel sampling for the TGS 2611 sensor, respectively, and were con- firmed using a gas chromatograph as a reference ana- lyzer. The NRMSEs of the samples with low [CH4] Introduction Air quality monitoring has become a critical require- Supplementary Information The online version contains supplementary material available at https://doi. ment due to the current rise in health issues associ- org/10.1007/s10661-021-09290-w. ated with air pollution, climate change, and impaired quality of life (Bentayeb et al., 2015; Manisalidis I. S. P. Nagahage (*) et al., 2020; Pascal et al., 2013; Raaschou-Nielsen Department of Plant Physiology, Umeå University, et al., 2016; Wu et al., 2016). Therefore, many 901 87 Umeå, Sweden e-mail: isura.nagahage@umu.se research works have been carried out in this research area to develop new technologies, evaluation of these I. S. P. Nagahage · E. A. A. D. Nagahage · T. Fujino techniques, and application (Benaissa et al., 2019; Graduate School of Science and Engineering, Eugster et al., 2020; Gibergans-Baguena et al., 2020; Saitama University, 255 Shimo‑Okubo, Sakura‑ku, Saitama 338‑8570, Japan Wu et al., 2019). Vol.:(0123456789) 13
509 Page 2 of 14 Environ Monit Assess (2021) 193:509 With the concern about the direct impact of methane 2019). In addition, it is known that these sensors’ ( CH4) on climate change and human health (Isaksen et al., accuracy depends on environmental parameters such 2014), it is important to continuously monitor atmos- as air temperature and humidity (Eugster & Kling, pheric methane spatially and temporally. 2012). Therefore, applications of these sensors are Gas fluxes from different sources can be measured limited to tasks where precise measurements are not using measurement approaches such as the point- required. scale chamber technique as well as micrometeoro- But, there could be a possibility to improve above logical techniques (National Academies of Sciences, limitations by combining several low-cost sensors, Engineering, and Medicine, 2018). Gas samples can and utilize same sensor system to measure different be detected using various analyzers, including gas samples automatically. However, there is a lack of chromatography-flame ionization detectors (GC- studies that examine low-cost methane monitoring FID), Fourier transform infrared (FTIR) spectro- systems which are made of several low-cost sensors scopic methods and optical gas imaging (Oliver, and having the ability to measure multiple samples by 2019). These measurement techniques require expen- using the same monitoring system. sive instruments and technical knowledge to operate The objective of the present study was to develop a them, and the measurements are carried out inter- low-cost continuous methane monitoring system and mittently owing to the cost of the analysis. Although minimize limitations of low-cost sensors by combin- many detection and measurement technologies exist, ing two low-cost methane sensors to measure mul- each method has its limitations and only a few avail- tiple samples from different sources. The developed able technologies have real-time, continuous monitor- system was consisted with TGS 2611 and MQ4 sen- ing capabilities (Hu et al., 2014). sors that have been evaluated for accuracy and reli- Thus, some researchers have investigated the ability under laboratory conditions independently potential use of low-cost gas sensors for atmospheric (Eugster & Kling, 2012; van den Bossche et al., 2016; methane monitoring in laboratory-level and field- Honeycutt et al., 2019). In addition, we combined scale implementations (van den Bossche et al., 2016; temperature and humidity sensor to study the effect Spinelle et al., 2017; Collier-Oxandale et al., 2018; of air temperature and the humidity of the sample on Yang et al., 2019). Also emerging advanced solid- methane measurement. We employed a high-dilution state sensing devices (artificial olfaction by e-noses) technique to facilitate methane detection by low-cost that employ sensors and algorithms based on artifi- sensors in their operating detection range. Then, cial neural networks have been developed (Hu et al., the developed system was coupled with the anaero- 2018). Moreover, low-cost sensors have attracted bic digesters to facilitate the continuous detection of the interest of researchers not only because of their low-concentration methane. Our study suggested that low cost but also because of other desirable features combination of MQ4 and TGS 2611 sensors have such as their smaller size, lower weight, and reduced improved range of detection, accuracy, and decreased power consumption as well as their same analytical sensor-to-sensor variability. principles as established reference instruments (Lewis et al., 2018). Interestingly, these low-cost sensors are capable of detecting and measuring atmospheric Materials and methods compositions, focusing on reactive air pollutants (CO, NOx, O3, and SO2), particulate matter (PM), and the Selected low‑cost sensors for methane monitoring greenhouse gases CO2 and CH4 (Lewis et al., 2018). system Thus, applicability of low-cost sensors provides an insight into different implementations and develop- A TGS 2611-metal–oxide–semiconductor (MOS)-type ments of sensor-based systems. gas sensor (Figaro Engineering Inc., Osaka, Japan) However, low-cost sensors have several limita- (TGS-2611 sensor technical data, 2019) was used as the tions when it comes to the application. The main low-cost gas sensor to detect the methane concentrations drawbacks of low-cost methane sensors are that their of the anaerobic digesters. The typical detection range of low accuracy, limited measurement range, sensor-to- the sensor is 500–10,000 ppm, the circuit voltage of the sensor variability, and durability (Honeycutt et al., sensor is 5 V, and the sensing material of the sensor is 13
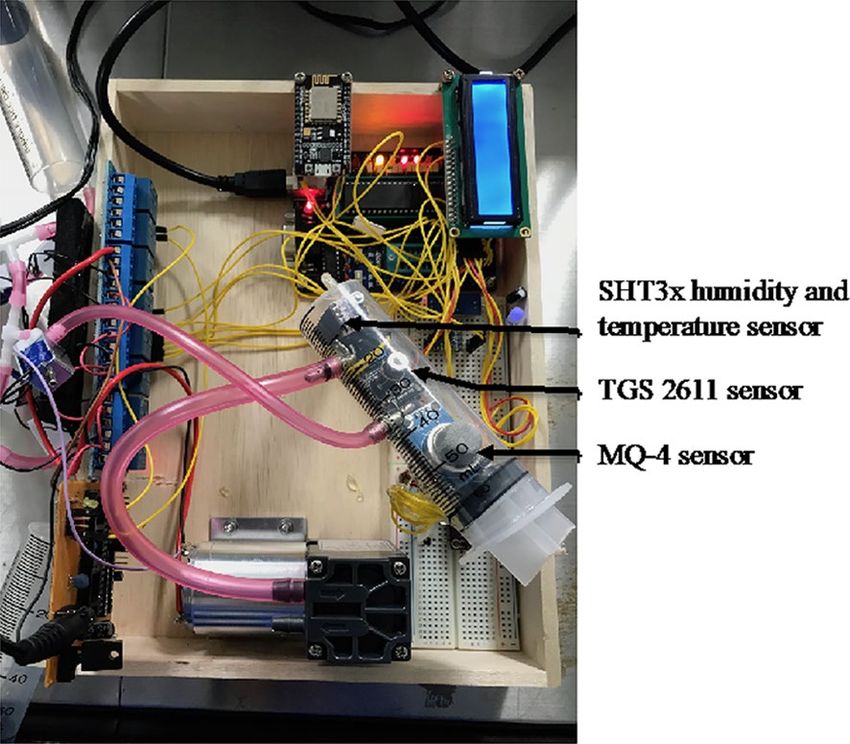
Environ Monit Assess (2021) 193:509 Page 3 of 14 509 SnO2. Suitability of sensor-based atmospheric methane Automated methane monitoring system for the monitoring was previously evaluated (Eugster & Kling, detection of methane concentration 2012; van den Bossche et al., 2016; Honeycutt et al., 2019). The automated methane monitoring system mainly MQ-4 is a semiconductor-type gas sensor (Han- performed the automated sampling, detection, and wei Electronics Group Corporation, Zhengzhou, monitoring of methane gas, followed by data acquisi- China), with a high sensitivity to methane and a cir- tion and storage (Figs. 1, 2). cuit voltage of 5 V. The sensor is capable of detect- ing methane gas in the concentration range of Sensor arrangement in vacuum chamber 200–10,000 ppm. This sensor is composed of a micro size Al2O3 ceramic tube, a S nO2 sensitive layer, a The TGS 2611 and MQ-4 sensors and an SHT3x measuring electrode, and a heater fixed in a layer con- humidity and temperature sensor were arranged in a sisting of a plastic and stainless steel net (MQ-4 sen- 50-mL syringe to obtain an air sample with a fixed sor technical data, 2019). MQ-4 sensor has been stud- volume for measurement (Fig. 3). The inlet and out- ied in low-cost application on biogas measurement by let of the 50-mL syringe (hereafter known as vacuum Yang et al. (2019). Moreover, MQ sensors are capable chamber) were connected via a one-way valve to of detecting different hydrocarbons, which have been secure the air sample. used in accordance with their specifications. During the measurement, seven readings per sam- The operating principle of semiconductor-type ple were obtained during one measuring cycle. The sensors is based on changes in resistance as a result of vacuum chamber was flushed with clean air for 3 min changes in adsorbed oxygen concentration (Lee et al., before the start of the next measuring cycle. The 2018). In clean air, donor electrons on a semiconduc- temperature and humidity of the air sample and the tor surface are attracted towards oxygen, reducing the atmosphere were obtained by the SHT3x humidity flow of electric current. In the presence of reducing and temperature sensor. gases, the amount of adsorbed oxygen is decreased through the release of electrons into the semicon- Instrumentation for gas sampling ductor material, allowing current to flow (Figaro Engineering Inc.). Furthermore, this type of sensor Anaerobic digesters (AD1–AD4) were connected requires a minimum conditioning period or preheat- with the vacuum chamber via three-way solenoid ing time. The preheating facilitates the heating ele- valves (SV1–SV5). The gas samples obtained from ment and allows the sensing element of the sensor to AD1 to AD4 passed through the SV1–SV4, respec- be consistently heated (TGS 2611: 7 days of condi- tively, using S V5 as the common entry to the vac- tioning before the start of the test and MQ-4 sensor: uum chamber (Fig. 4). The gas sampling from each preheating for 24 h). anaerobic digester was carried out separately and included a flushing cycle with clean air after each Fig. 1 Acquisition and visualization of real- time data by the methane monitoring system under clean-air conditions 13
509 Page 4 of 14 Environ Monit Assess (2021) 193:509 Fig. 2 Circuit diagram of the methane monitoring system measurement. The solenoid valves were operated owing to the vacuum generated by the vacuum by a relay board connected to the main microcon- pump (DC 12 V, 6 W mini vacuum pump). The troller (STC89C52RC). During each measure- common three-way solenoid SV5 was connected ment, the air sample entered the vacuum chamber to the vacuum chamber via a one-way valve. Simi- larly, the flushed air was removed from the vacuum chamber via another one-way valve to prevent the gas from mixing with other gas samples during the measurements. Instrumentation for data acquisition The data acquisition system was similar to that in our previous study (Nagahage et al., 2019). It consisted of two main components: a microcon- troller unit and a WiFi module. The main micro- controller (STC89C52RC) was operated at a speed of 11.0592 MHz. A software-implemented I2C bus was used to interface a 16 × 2 LCD module, an ADS1115 16-bit analog-to-digital converter (ADC), and a temperature and humidity sensor with the microcontroller. An ESP8266-12E low- Fig. 3 Sensor arrangement inside the vacuumed syringe chamber cost serial-to-WiFi module was interfaced through 13
Environ Monit Assess (2021) 193:509 Page 5 of 14 509 Fig. 4 Sensor and relay arrangement of multi-channel sampling unit STC89C52RC inbuilt UART. The analog data out- Implementation of anaerobic digesters for data put pins of the TGS 2611 and MQ-4 gas sensors acquisition were connected to the ADS1115 with a full-scale range of ± 4.096 V. ThingSpeak API, an open IoT Anaerobic digesters with four different conditions/ (Internet of Things) platform, was used to collect treatments were used for continuous methane moni- and analyze data with M ATLAB@ analytics. The toring. The digesters were operated for 2 months assembly program (supplemental material 1) for (hydraulic retention time, (HRT) of 60 days) with the the microcontroller was written using Keil µVision continuous monitoring of the methane production. 5 IDE, and AT commands were used to control Anaerobic digesters were constructed using 2-L the WiFi module (Figs. 1, 2). The total cost of the heavy-duty vacuum bottles filled with 400 mL of developed prototype was $84.31 (Table 1). palm oil mill effluent (POME) and 5.0 g of activated 13
509 Page 6 of 14 Environ Monit Assess (2021) 193:509
Table 1 Total cost of Component Units Unit cost ($) Subtotal ($) Total ($)
the developed methane
monitoring system (US$ in Methane monitoring and data acquisition
2019)
STC89C52RC 1 1.12 1.12
ADS1115 1 2.73 2.73
ESP8266-12E 1 1.79 1.79
TGS 2611 1 35.84 35.84
MQ-4 1 1.29 1.29
SHT30 1 3.98 3.98
LCD1602 1 2.12 2.12
Components for gas sampling
Three-way solenoid valves 5 2.55 12.75
Vacuum pump (DC 12 V 6 W) 1 15.70 15.70
Relay board 1 1.99 1.99
Other components 5.00
84.31
sludge to start the digestion (Hamzah et al., 2019). VC
The POME was obtained from a palm oil processing VRL = (1)
215
factory in Malaysia. The effluent was stored at 4 °C
in a refrigerator prior to the experiment. The anaer- (
VC
)
obic digesters were maintained under a mesophilic RS = RL −1 (2)
VRL
condition (37 °C) inside a PR-1 K temperature and
humidity chamber (Espec Tabai Corp. Japan). {[( ) ] }
logRS
−b ∕m
(3)
[ ]
CH4 = 10 R0
Conversion of raw data into methane concentration where VRL is the voltage at the load resistor (RL), VC
in ppm is the circuit voltage (5 V), RS is the sensor resistance,
R0 is the sensor resistance at a methane concentration
The methane concentrations of anaerobic digest- of 1000 ppm in clean air, and b and m are the inter-
ers were obtained using low-cost sensors. The raw cept and slope of the manufacturer’s calibration func-
data of the sensors were stored in the ThingSpeak tion, respectively. The predefined value of 215 is the
platform. We performed raw data conversion using value used for ADC conversion.
the manufacturer’s calibration graphs (see the cali-
bration graphs for clean air and methane in the
manufacturer’s data sheet for the TGS 2611 gas Validation of the sensor reading using a GC as a
sensor and MQ-4 gas sensor) to obtain the methane reference analyzer
concentration in ppm. The data conversion using
the accurately calibrated manufacturer’s function Preliminary studies were conducted to evaluate the
obtained from the graphs (TGS 2611 and MQ-4 repeatability and consistency of the measured data
technical data) was performed satisfactorily, and we obtained from the developed methane monitoring sys-
confirmed the data with a reference analysis using tem. Gas samples with methane concentrations of 3, 4,
a gas chromatograph (GC-2014, Shimadzu, Japan). 6, and 7% were prepared using 99.9% standard meth-
The methane concentration in ppm was calcu- ane gas. Automated gas sampling was performed using
lated using the following mathematical relation- 50 mL syringes that were connected to the tubes of
ships (TGS 2611 and MQ-4 technical data) and the the methane monitoring system. Seven measurements
general V = IR relationship as follows: were obtained for each concentration by the methane
13Environ Monit Assess (2021) 193:509 Page 7 of 14 509 monitoring system. The same experiment was performed where θ is the methane concentration measured by twice to confirm the measurements. The TGS 2611 sen- the gas chromatograph (m3 m−3) or the methane gas sor is capable of detecting of high-concentration methane concentration calculated by the high-dilution method, samples, which was confirmed using a gas chromato- θp is the methane concentration measured by the gas graph as a reference analyzer. However, the MQ-4 sensor sensors (m3 m−3), and n is the number of measure- was unable to detect high-concentration samples since ments in each measuring cycle. As a quantitative the concentrations exceeded their detection limit, and it measure of prediction performance, we calculated produced the same raw sensor response to all the concen- the normalized root mean square error (NRMSE) by trations. Thus, we used a high-dilution method to evalu- dividing the RMSE using the mean concentration of ate the response of the sensors in their detection ranges. observations of the respective sensor (Kuula et al., 2019; Smith et al., 2019). Preparation of gas samples using high‑dilution method Temperature and humidity dependence We diluted the methane gas in 2-L-heavy-duty bottles to The temperature and humidity of the air sample and obtain very low concentrations by the following proce- atmosphere were obtained by an SHT3x humidity and dure: We injected 2, 3, 4, and 5 mL of standard methane temperature sensor (Nagahage et al., 2019). The con- gas into the 2-L-heavy-duty bottles that were connected version of the temperature (result in °C) and humidity to the methane monitoring system via 150-cm long tubes. (result in %RH) signal output was performed using The prepared low-gas concentrations in the 2 L volumes the following equations (Humidity & Temperature were 0.096, 0.145, 0.193, and 0.241%, respectively. Sensor Datasheet SHT3x-DIS, 2016): Temperature conversion Evaluation of sensor repeatability and consistency ST (5) [ ] T ◦ C = −45 + 175 An experiment to evaluate repeatability and consist- 216 − 1 ency was conducted using the 2-L-heavy-duty bot- tles before the experiment on anaerobic digestion. In Relative humidity conversion this experiment, methane gas was injected into empty SRH D1–AD4) with vol- 2-L-heavy-duty bottles (labeled A RH = 100 16 . (6) 2 − 1 umes of 2, 3, 4, and 5 mL of 99.9% standard meth- ane gas. The expected methane concentrations of the where ST and SRH denote the raw sensor output for AD1–AD4 were 0.097, 0.145, 0.193, and 0.241%, humidity and temperature, respectively. respectively. The length of the gas tube from each The correlation coefficients of the parameters were 2-L-heavy-duty bottle to the vacuum chamber was evaluated using a simple linear regression model. The considered when calculating the concentration of the coefficient values were calculated to obtain the best fit methane gas inside the bottle. for the parameters. Statistical analysis Results and discussion To evaluate the repeatability and consistency, preliminary studies were carried out using known standard methane Automated gas sampling in vacuum chamber for concentrations. We calculated the root-mean-square error measurements (RMSE) as follows to evaluate the methane concentration measured by the gas sensors and gas chromatograph: A gas sample from an anaerobic digester was col- √ √ n lected in the vacuum chamber for each measurement. √1 ∑ A complete measurement cycle consisted of a 40-min RMSE = √ ( − p )2 , (4) n i=0 measuring cycle followed by 20 min of atmos- pheric air flushing with a rest period. The methane 13
509 Page 8 of 14 Environ Monit Assess (2021) 193:509 monitoring system monitored four anaerobic digest- Table 2 RMSE and NRMSE of TGS and MQ4 sensors at high ers in a complete measuring cycle. Thus, it took 1 h and low methane concentrations to complete the measurement of all four anaerobic TGS MQ-4 digesters in one round. The methane concentration of [CH4] % RMSE NRMSE RMSE NRMSE a gas sample from each anaerobic digester was repeat- edly measured seven times. The data acquisition sys- 3 0.2231 0.0788 - - tem recorded a measurement every minute; thus, it 4 0.2795 0.0696 - - took 7 min to take seven readings from one air sample 6 0.6380 0.1198 - - from an anaerobic digester. Intermittent air flushing 7 0.4973 0.0719 - - was performed between times when gas samples were 0.096 0.0062 0.0641 0.0302 0.3143 taken from different digesters (AD1–AD2, AD2–AD3, 0.145 0.0254 0.1749 0.0836 0.5766 and AD3–AD4, with complete air flushing and a rest 0.193 0.0030 0.0157 0.1216 0.6301 period at the end of the measurements). The intermit- 0.240 0.0389 0.1613 0.1653 0.6859 tent air flushing had a duration of 2–3 min. Automated data acquisition accuracy of the gas sample concentration measure- ment by the TGS 2611 sensor is acceptable for gas The raw data obtained from the gas sensors and the monitoring purposes. temperature and humidity sensor were stored in the However, the MQ-4 sensor was unable to provide ThingSpeak platform. The methane concentration of acceptable values owing to its detection limitation the atmospheric air, and the temperature and humid- and showed a limited raw response to subsequent ity of the air were recorded repeatedly every minute. methane concentrations. Even though the maximum Also, the changes in methane concentration, tem- detection limit of both sensors is 10,000 ppm, the perature, and humidity in each complete measuring TGS 2611 sensor was able to perform satisfactorily cycle for all anaerobic digesters were recorded once by changing its raw response to the selected meth- per day. In other words, each anaerobic digester was ane gas concentration. Alternative setup could be measured once a day, and one gas sample taken from used to improve measurement range of MQ-4 sen- a bottle was repeatedly measured seven times. sors, as injection of gas into a partially closed cap- sule facilitated the measurement of high methane Data validation using GC as a reference analyzer concentration (Fakra et al., 2020). This result suggested that both the TGS 2611 and Automated gas sampling was performed to inject MQ-4 sensors may perform satisfactorily within the a gas sample into the vacuumed chamber. Thus, we given detection range. On the basis of this result, were able to maintain the same experimental condi- the repeatability and consistency experiment was tions for all the sensors used in the methane moni- performed using the gas samples prepared within toring system. NRMSE was calculated for the meth- the detection range of the gas sensors. ane concentration ([CH4]) in % measured from the gas chromatograph and TGS 2611 gas sensor. The NRMSEs for the samples with 3, 4, 6, and 7% meth- Table 3 ANOVA table to validate the TGS 2611 sensor data ane concentrations were 0.0788, 0.0696, 0.1198, and with GC. The results indicate no significant difference between the TGS 2611 measurements and GC measurement at 5% sig- 0.0719, respectively (Table 2). nificant level In addition, ANOVA was conducted to determine Df Mean sum of F value P value statistical significance between TGS sensor and GC squares measurements (Table 3). The results showed that there was no statistical significance between TGS GC to TGS 1 0.0780 0.0321 0.8589 2611 and GC measurements, suggesting that the residual error 29 2.4284 13
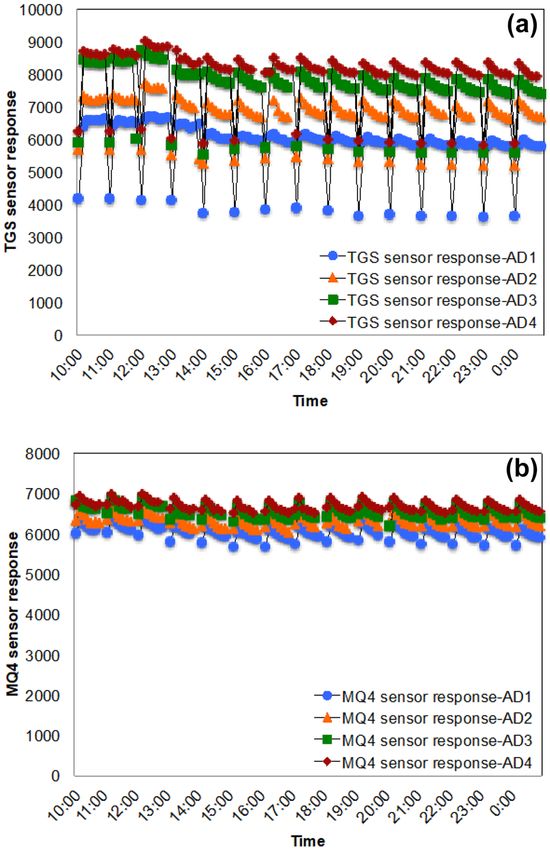
Environ Monit Assess (2021) 193:509 Page 9 of 14 509 Sensor repeatability and consistency response of ~ 4000) during each intermittent air flush- ing. However, the MQ-4 sensor was not capable of The sensor repeatability and consistency were evalu- detecting atmospheric methane concentration during ated for both sensors using low methane concentra- each intermittent air flushing and started to respond tions. The different concentrations of methane in to the next gas sample. Honeycutt et al. (2019) also the 2-L heavy-duty bottles were measured repeat- observed higher settling time of MQ-4 sensor than edly for 15 h. The methane monitoring system con- TGS 2611 sensor. nected to the data acquisition system recorded all the The results suggest that the MQ-4 sensor requires measurements of the 2-L heavy-duty bottles labeled a longer response time to perform satisfactorily. AD1–AD4 (Fig. 5a, b). The response time of the TGS In addition, the accuracy of both sensors at low 2611 gas sensor was faster than that of the MQ-4 methane concentrations was studied by calculating gas sensor as it responded to atmospheric [CH4] (a NRMSEs (Table 2). The calculated NRMSEs of the [CH4] of 0.096, 0.145, 0.193, and 0.241% measured by the TGS 2611 sensor were 0.0641, 0.1749, 0.0157, and 0.1613, whereas those NRMSEs of the same concentrations measured by the MQ-4 sensor were 0.3143, 0.5766, 0.6301, and 0.6859, respectively. The experimental results demonstrate satisfactory performance of both sensors while better accuracy of TGS 2611 sensor over MQ-4 sensor in low methane concentrations. Temperature and humidity dependence As mentioned by manufacturers of TGS 2611 and MQ-4 sensors and earlier studies (Eugster & Kling, 2012), these sensors are sensitive to relative humid- ity and temperature. The temperature and humid- ity data obtained for fixed amount of [CH4] in A D3 before anaerobic digestion experiment (Fig. 6a) and the measurement of [CH4] in AD4 during the anaero- bic digestion experiment were selected to determine the temperature and humidity dependence of the sen- sor response (Fig. 6b). We considered the data after an HRT of 15 days to avoid the initial fluctuation of the data during the establishment of the anaerobic digesters (see Fig. 7). The change in methane concen- tration for the anaerobic digesters gradually increased after the establishment of the system. Thus, we used this stage to evaluate the temperature and humidity dependence of the sensor reading. The variations in temperature and the humidity Fig. 5 Change in gas sensor response with time during the were very limited owing to the controlled environ- repeatability and consistency experiment: (a) TGS 2611 sensor response for AD1–AD4, (b) MQ-4 sensor response for A D1– mental conditions inside the vacuum chamber before AD4 (Note that during the 1 h complete measurement cycle, anaerobic digestion (temperature 29 to 36 °C, humid- the measurements from AD1 to AD4 were configured/recorded ity 29 to 36%) and during anaerobic digestion (tem- as consecutive measurements.) In the figure, the readings of perature 28 to 34 °C, humidity 28 to 46%) experi- the four bottles are shown within the same time period (not as consecutive measurements for this time period) to increase the ments (Fig. 6a, b). The vacuum chamber was fixed readability on the top of the PR-1 K temperature and humidity 13
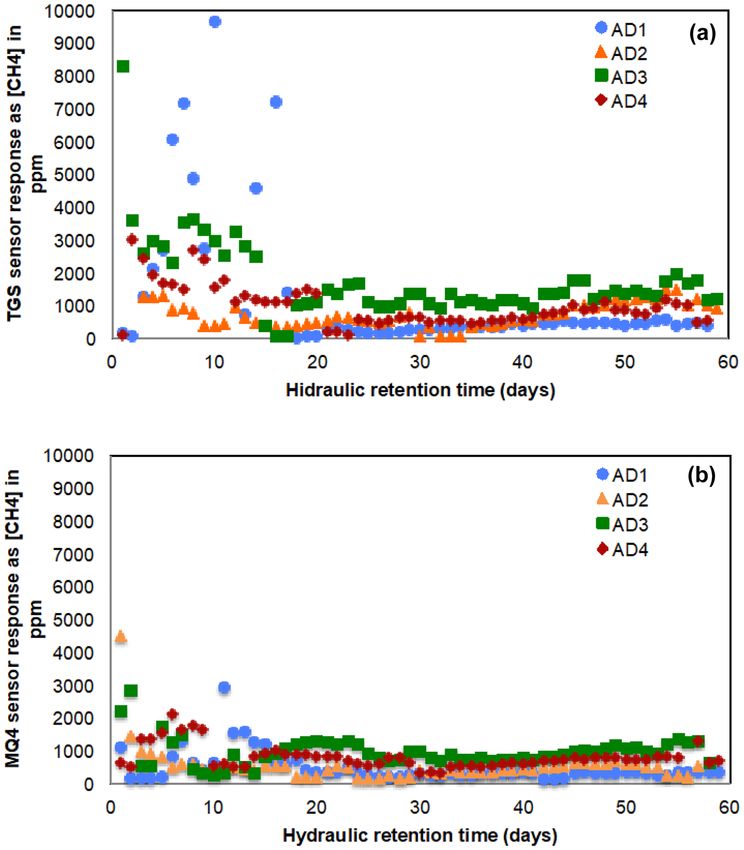
509 Page 10 of 14 Environ Monit Assess (2021) 193:509 Fig. 6 Changes in tempera- ture and relative humidity (a) during the gas space meas- urement: (a) using a known concentration of CH4 in AD3 before the experiment, (b) CH4 in AD4 during the experiment (b) chamber. The temperature of the air sample slightly of the methane monitoring system. The anaerobic changed during the sampling of air space gases digesters were operated for an HRT of 60 days with from the anaerobic digesters. Furthermore, the rela- different treatments. The change in methane concen- tive humidity of the air sample was low owing to the tration was monitored using the methane gas monitor- larger gas space inside the anaerobic digester and may ing system then recorded (Fig. 7a, b). The data fluc- be due to the low evaporation rate of POME. tuation was higher in the TGS 2611 sensor response The dependence of the response on the tempera- than in the MQ-4 sensor response during the initial ture and humidity during anaerobic digestion was 15 days. According to Fig. 7a, b, the TGS 2611 sen- evaluated by regression analysis. The sensor response sor recorded more outliers than the MQ-4 sensor did not depend on the temperature or humidity of response, which was more stable during our experi- the air sample in our study (R2 = 0.02 and 0.16, ment. After HRT of 15 days, both sensor responses respectively). were stable for the remainder of the experiment, showing the potential use of these low-cost sensors Sensor measurements for laboratory‑scale anaerobic for atmospheric monitoring systems. Izumoto et al. digesters (2018) demonstrated the importance of evaluation of methane emission at a time scale in landfill sites. Four anaerobic digesters were operated as the labo- However, methane emission varies between different ratory implementation to evaluate the performance layers of the landfill site (Pehme et al., 2020). Since 13
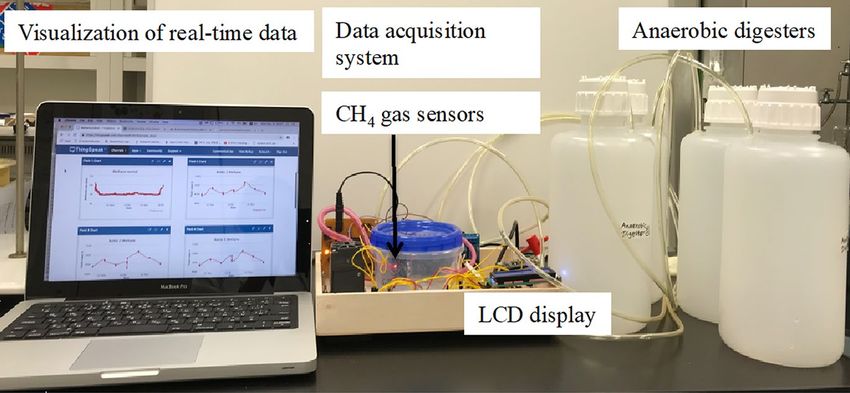
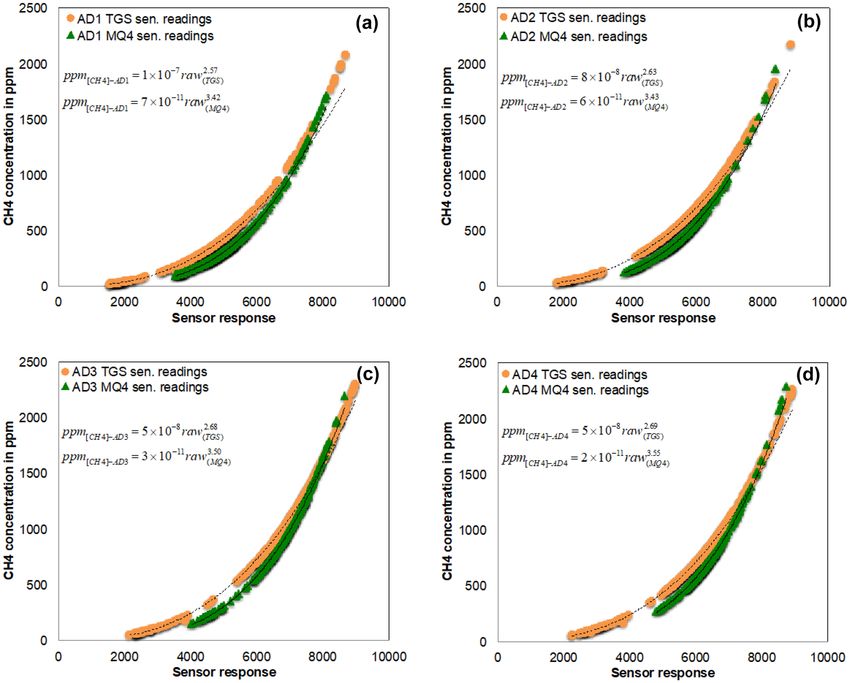
Environ Monit Assess (2021) 193:509 Page 11 of 14 509 Fig. 7 Changes in sensor response as [CH4] in ppm during HRT of 60 days for four anaerobic digesters: (a) TGS 2611 sensor response as [CH4] in ppm, (b) MQ-4 sensor response as [CH4] in ppm for HRT of 60 days our system can be utilized to measure methane emis- results of the ANOVA test showed statistically signif- sion through multiple channels, it will be worthwhile icant differences between the values in ppm measured to investigate the applicability of the system in land- by both sensors (P < 0.05). fill sites to study methane emission more accurately. Even though their responses are significantly differ- ent, the trend of the mathematical relationship (power Relationship between measured methane function) is similar for the two sensors (Fig. 8). Thus, concentration and sensor response we performed Spearman’s correlation analyses between TGS 2611 sensor and MQ-4 sensor by using methane Mathematical relationships between the measured concentration and sensor raw values. According to methane concentrations and the responses of the the analysis, there was a significant positive correla- TGS 2611 and MQ-4 gas sensors were derived for tion in methane concentration values (rho = 0.9520 at the anaerobic digesters (Fig. 8). The outliers of the P = 2 × 10⁻¹⁶) and sensor raw values (rho = 0.9542 at methane concentrations measured by the sensors P = 2 × 10⁻¹⁶). The inaccuracy of sensors can be mini- were removed, and only the stabilized data were used. mized by the development of statistical methods to cor- To test the hypothesis that the TGS 2611 and MQ-4 rect measurements from low-cost sensors (Considine sensor readings for the anaerobic digester [CH4] in et al., 2021). Therefore, the following regression mod- ppm was equal, an ANOVA test was performed. The els were developed to explain the relationship between 13
509 Page 12 of 14 Environ Monit Assess (2021) 193:509 Fig. 8 Relationship between the measured [CH4] and responses of TGS 2611 and MQ-4 gas sensors: (a–d) anaerobic digesters A D1 to AD4 Table 4 Summary of the regression models. All regression the two sensors (Table 4). These linear regression mod- models are statistically significant els will be utilized in future studies for sensor correc- Estimated coefficients P value Adjusted R2 tion algorithms, cross-validation, and predicting sensor values when one sensor is failed. General linear model coefficients for [CH4] in ppm Intercept − 6.5902 × 10² 2 × 10⁻¹⁶ 0.3399 MQ-4 2.7550 2 × 10⁻¹⁶ Conclusions Intercept 4.685 × 10² 2 × 10⁻¹⁶ 0.3399 TGS 1.235 × 10⁻¹ 2 × 10⁻¹⁶ We developed a low-cost gas sensor system for moni- General linear model coefficients for methane sensor raw toring methane concentration that uses a simple cloud- values based data acquisition platform. We tested the perfor- Intercept − 6.2591 × 10³ 2 × 10⁻¹⁶ 0.7965 mance of the low-cost methane monitoring system MQ-4 2.0893 2 × 10⁻¹⁶ by combining it with anaerobic digesters. The TGS Intercept 3.584 × 10³ 2 × 10⁻¹⁶ 0.7965 −1 −16 2611 sensor showed a higher response to changes TGS 3.813 × 10 2 × 10 in methane gas concentration. Moreover, the MQ-4 13
Environ Monit Assess (2021) 193:509 Page 13 of 14 509 sensor was capable of detecting methane gas within its otherwise in a credit line to the material. If material is not detection range. However, the TGS 2611 sensor was included in the article’s Creative Commons licence and your intended use is not permitted by statutory regulation or exceeds capable of accurately detecting methane gas above its the permitted use, you will need to obtain permission directly detection range. In this study we employed the high- from the copyright holder. To view a copy of this licence, visit dilution method to prevent incorrect gas detection http://creativecommons.org/licenses/by/4.0/. when the concentration exceeded the detection limit. Importantly, we performed a gas sampling procedure References involving automated gas sampling in the vacuum chamber for measurements. The strategies we used for Benaissa, F., Bendahmane, I., Bourfis, N., Aoulaiche, O., & gas sampling may be useful for enhancing the dura- Alkama, R. (2019). Bioindication of urban air polycyclic bility of sensors and the accuracy of measurements. aromatic hydrocarbons using Petunia hybrida. Civil Engi- However, further studies are required to evaluate the neering Journal, 4 (2), 1305–1313. https://doi.org/10. 28991/cej-2019-03091333 sensitivity of both sensors on temperature and humid- Bentayeb, M., Wagner, V., Stempfelet, M., Zins, M., Goldberg, ity. Additional investigations should be performed to M., Pascal, M., Larrieu, S., Beaudeau, P., Cassadou, S., check how stable the calibration functions over the Eilstein, D., Filleul, L., Tertre, A., Medina, S., Pascal, L., time and accuracy of the function in mixed air. This Prouvost, H., Quénel, P., Zeghnoun, A., & Lefranc, A. (2015). Association between long-term exposure to air study utilized a unique way to combine the advantages pollution and mortality in France: A 25-year follow-up of sensors, circuit control, and data analysis so as to study. Environmental International, 85, 5–14. https://doi. realize a low-cost but reliable monitoring system by org/10.1016/j.envint.2015.08.006 minimizing drawbacks of low-cost sensors. Collier-Oxandale, A., Casey, J. G., Piedrahita, R., Ortega, J., Halliday, H., Johnston, J., & Hannigan, M. P. (2018). Assessing a low-cost methane sensor quantification sys- tem for use in complex rural and urban environments. Author contribution Conceptualization and production of Atmospheric Measurement Techniques, 11(6), 3569–3594. the final manuscript, I.S.P.N. and E.A.A.D.N.; conceptualiza- https://doi.org/10.5194/amt-11-3569-2018 tion of methane monitoring system, microcontroller program, Considine, E. M., Reid, C. E., Ogletree, M. R., & Dye, T. and prototype development, I.S.P.N.; experiments for sensor (2021). Improving accuracy of air pollution exposure validation, experimental design to test the sensor performances, measurements: Statistical correction of a municipal low- E.A.A.D.N.; funding, supervision, revision and editing, T.F. cost airborne particulate matter sensor network. Envi- ronmental Pollution, 268(B), 115833. https://doi.org/10. Funding Open access funding provided by Umea University. 1016/j.envpol.2020.115833 This work was supported by the Saitama University president’s Eugster, W., Laundre, J., Eugster, J., & Kling, G. W. (2020). Long- discretion program. term reliability of the Figaro TGS 2600 solid-state methane sensor under low-Arctic conditions at Toolik Lake, Alaska. Data availability Some or all data, models that support the Atmospheric Measurement Techniques, 13(5), 2681–2695, findings of this study are available from the corresponding 2020. https://doi.org/10.5194/amt-13-2681-2020 author upon reasonable request. Eugster, W., & Kling, G. W. (2012). Performance of a low- cost methane sensor for ambient concentration measure- ments in preliminary studies. Atmospheric Measurement Code availability The codes of the automated data acquisi- Techniques, 5(8), 1925–1934. https://doi.org/10.5194/ tion system are available from the corresponding author upon amt-5-1925-2012 reasonable request. Fakra, D. A. H., Andriatoavina, D. A. S., Razafindralambo, N. A. M. N., Amarillis, K. A., & Andriamampianina, J. M. M. Declarations (2020). A simple and low-cost integrative sensor system for methane and hydrogen measurement. Sensors International, Conflict of interest The authors declare no competing inter- 1, 10032. https://doi.org/10.1016/j.sintl.2020.100032 ests. Gibergans-Baguena, J., Hervada-Sala, C., & Jarauta-Bragulat, E. (2020). The quality of urban air in Barcelona: A new Open Access This article is licensed under a Creative Com- approach applying compositional data analysis methods. mons Attribution 4.0 International License, which permits Emerging Science Journal, 4(2), 113–121. https://doi.org/ use, sharing, adaptation, distribution and reproduction in any 10.28991/esj-2020-01215 medium or format, as long as you give appropriate credit to the Hamzah, M. A. F., Jahim, J. M., Abdul, P. M., & Asis, A. J. original author(s) and the source, provide a link to the Crea- (2019). Investigation of temperature effect on start-up tive Commons licence, and indicate if changes were made. The operation from anaerobic digestion of acidified palm oil images or other third party material in this article are included mill effluent. Energies, 12, 2473. https://doi.org/10.3390/ in the article’s Creative Commons licence, unless indicated en12132473 13
509 Page 14 of 14 Environ Monit Assess (2021) 193:509 Honeycutt, W. T., Ley, M. T., & Materer, N. F. (2019). Precision Oliver, D. W. (2019). Implications of sampling methods on and limits of detection for selected commercially available, geospatial mapping of methane sources. Dissertations. low-cost carbon dioxide and methane gas sensors. Sensors, West Virginia University. https://researchrepository.wvu. 19(14), 3157. https://doi.org/10.3390/s19143157 edu/etd/4038 Hu, E. B., Babcock, E. L., Bialkowski, S. E., Jones, S. B., & Pascal, M., Corso, M., Chanel, O., Declercq, C., Badaloni, C., Tuller, M. (2014). Methods and techniques for measuring Cesaroni, G., Henschel, S., Meister, K., Haluza, D., Martin- gas emissions from agricultural and animal feeding opera- Olmedo, P., & Medina, S. (2013). Assessing the public health tions. Critical Reviews in Analytical Chemistry, 44(3), impacts of urban air pollution in 25 European cities: Results 200–219. https://doi.org/10.1080/10408347.2013.843055 of the Aphekom project. Science of the Total Environment, Hu, W., Wan, L., Jian, Y., Ren, C., Jin, K., Su, X., Bai, X., 449, 390–400. https://doi.org/10.1016/j.scitotenv.2013.01.077 Haick, H., Yao, M., & Wu, W. (2018). Electronic noses: Pehme, K. M., Orupõld, K., Kuusemets, V., Tamm, O., Jani, Y., From advanced materials to sensors aided with data pro- Tamm, T., & Kriipsalu, M. (2020). Field study on the effi- cessing. Advanced Materials Technologies, 4(2), 1800488. ciency of a methane degradation layer composed of fine https://doi.org/10.1002/admt.201800488 fraction soil from landfill mining. Sustainability, 12, 6209. Humidity and temperature sensor datasheet SHT3x-DIS. https://doi.org/10.3390/su12156209 (2016). Retrieved July 17, 2019, from https://www.mouser. Raaschou-Nielsen, O., Beelen, R., Wang, M., et al. (2016). Par- com/ d atas h eet/2/ 6 82/ S ensi r ion_ H umid i ty_ S enso r s_ ticulate matter air pollution components and risk for lung SHT3x_Datasheet_digital-971521.pdf cancer. Environmental International, 87, 66–73. https:// Isaksen, I. S. A., Terje, K., Berntsen, T. K., Dalsøren, S. B., doi.org/10.1016/j.envint.2015.11.007 Eleftheratos, K., Orsolini, Y., Rognerud, B., Stordal, F., Smith, K. R., Edwards, P. M., Ivatt, P. D., Lee, J. D., Squires, Søvde, O. A., Zerefos, C., & Holmes, C. D. (2014). Atmos- F., Dai, C., Peltier, R. E., Evans, M. J., Sun, Y., & Lewis, pheric ozone and methane in a changing climate. Atmos- A. C. (2019). An improved low-power measurement of phere, 5(3), 518–535. https://doi.org/10.3390/atmos5030518 ambient NO2 and O 3 combining electrochemical sensor Izumoto, S., Hamamoto, S., Kawamoto, K., Nagamori, M., & clusters and machine learning. Atmospheric Measurement Nishimura, T. (2018). Monitoring of methane emission from Techniques, 12(2), 1325–1336. https://doi.org/10.5194/ a landfill site in daily and hourly time scales using an auto- amt-12-1325-2019 mated gas sampling system. Environmental Science and Pol- Spinelle, L., Gerboles, M., Kok, G., Persijn, S., & Sauerwald, lution Research, 25, 24500–24506. https://doi.org/10.1007/ T. (2017). Review of portable and low-cost sensors for s11356-018-2671-1 the ambient air monitoring of benzene and other volatile Kuula, J., Kuuluvainen, H., Rönkkö, T., Niemi, J. V., Saukko, E., organic compounds. Sensors, 17(7), 1520. https://doi.org/ Portin, H., Aurela, M., Saarikoski, S., Rostedt, A., Hillamo, 10.3390/s17071520 R., & Timonen, H. (2019). Applicability of optical and dif- TGS 2611 gas sensor technical data. (2019). TGS 2611 fusion charging-based particulate matter sensors to urban air for the detection of methane. Retrieved July 17, 2019, quality measurements. Aerosol and Air Quality Research, from http://www.figarosensor.com/product/docs/TGS% 19(5), 1024–1039. https://doi.org/10.4209/aaqr.2018.04.0143 202611C00(1013).pdf Lee, Y., Yang, P., Chang, C., & Fang, W. (2018). Design and fab- van den Bossche, M., Rose, N. T., & De Wekker, S. F. J. rication of MOS type gas sensor with vertically integrated (2016). Potential of a low-cost gas sensor for atmospheric heater using CMOSMEMS technology. Proceedings, 2(13), methane monitoring. Sensors and Actuators b: Chemical, 772. https://doi.org/10.3390/proceedings2130772 238, 501–509. https://doi.org/10.1016/j.snb.2016.07.092 Lewis, A., Peltier, W. R., & von Schneidemesser, E. (2018). Wu, F., Lu, Y., Wang, M., Zhang, X., & Yang, C. (2019). Cata- Low-cost sensors for the measurement of atmospheric lytic removal of ozone by Pd/ACFs and optimal design of composition: Overview of topic and future applications. ozone converter for air purification in aircraft cabin. Civil Research Report. World Meteorological Organization Engineering Journal,5 (8), 1656–1671. https://doi.org/10. (WMO), Geneva, Switzerland. 28991/cej-2019-03091361 MQ-4 sensor technical data. (2019). Retrieved July 17, 2019, from Wu, S., Ni, Y., Li, H., Pan, L., Yang, D., Baccarelli, A., Deng, http://image.dfrobot.com/image/data/SEN0129/MQ-4.pdf F., Chen, Y., Shima, M., & Guo, X. (2016). Short-term National Academies of Sciences, Engineering, and Medicine. exposure to high ambient air pollution increases air- (2018). Improving characterization of anthropogenic way inflammation and respiratory symptoms in chronic methane emissions in the United States. Chapter 3: Meth- obstructive pulmonary disease patients in Beijing, China. ane emission measurement and monitoring methods. Environment International, 94, 76–82. https://doi.org/10. Washington, DC: The National Academies Press. https:// 1016/j.envint.2016.05.004 doi.org/10.17226/24987 Yang, S., Liu, Y., Wu, N., Zhang, Y., Svoronos, S., & Nagahage, E. A. A. D., Nagahage, I. S. P., & Fujino, T. (2019). Pullammanappallil, P. (2019). Low-cost, Arduino-based, Calibration and validation of a low-cost capacitive mois- portable device for measurement of methane composition in ture sensor to integrate the automated soil moisture moni- biogas. Renewable Energy, 138, 224–229. https://doi.org/10. toring system. Agriculture, 9(7), 141. https://doi.org/10. 1016/j.renene.2019.01.083 3390/agriculture9070141 Manisalidis, I., Stavropoulou, E., Stavropoulos, A., & Bezirtzoglou, Publisher’s Note Springer Nature remains neutral with regard E. (2020). Environmental and health impacts of air pollution: to jurisdictional claims in published maps and institutional A review. Frontiers in Public Health, 8, 14. https://doi.org/10. affiliations. 3389/fpubh.2020.00014 13
You can also read