Detection of wakes in the inflow of turbines using nacelle lidars - WES
←
→
Page content transcription
If your browser does not render page correctly, please read the page content below
Wind Energ. Sci., 4, 407–420, 2019
https://doi.org/10.5194/wes-4-407-2019
© Author(s) 2019. This work is distributed under
the Creative Commons Attribution 4.0 License.

              Detection of wakes in the inflow of turbines using
                               nacelle lidars
                                          Dominique P. Held1,2 and Jakob Mann1
               1 Department of Wind Energy, Technical University of Denmark (DTU), Frederiksborgvej 399,
                                                4000 Roskilde, Denmark
                          2 Windar Photonics A/S, Helgeshøj Alle 16–18, 2630 Taastrup, Denmark

                                  Correspondence: Dominique P. Held (domhel@dtu.dk)

                                Received: 21 December 2018 – Discussion started: 16 January 2019
                              Revised: 4 June 2019 – Accepted: 5 June 2019 – Published: 11 July 2019

       Abstract. Nacelle-mounted lidar systems offer the possibility of remotely sensing the inflow of wind turbines.
       Due to the limitation of line-of-sight measurements and the limited number of focus positions, assumptions are
       necessary to derive useful inflow characteristics. Typically, horizontally homogeneous inflow is assumed which
       is well satisfied in flat, homogeneous terrain and over sufficiently large time averages. However, it is violated
       if a wake impinges the field of view of one of the beams. In such situations, the turbine yaw misalignment
       measurements show large biases which require the detection and correction of these observations. Here, a detec-
       tion algorithm is proposed based on the spectral broadening of the Doppler spectrum due to turbulence within
       the probe volume. The small-scale turbulence generated within wake flows will typically lead to a significantly
       larger broadening than in the ambient flow. Thus, by comparing the spectral widths at several measurement loca-
       tions, situations where a wake is impinging one or more measurement locations can be identified. The correction
       method is based on an empirical relationship between the difference in turbulence levels at distinct beams and
       the difference in wind direction derived from the lidar and the real wind direction. The performance of the al-
       gorithm is evaluated in a field experiment identifying all wake situations and, thus, correcting the lidar derived
       wind direction.

1   Introduction                                                   tion sensors, for example mast-mounted sonic anemometers
                                                                   and wind vanes or vertically profiling lidars. However, dif-
Modern wind turbines usually follow an upwind turbine de-          ferences in inflow and site conditions between the calibration
sign in which the rotor is installed upstream of the tower.        site and the actual installation site of the turbine are not re-
This design requires an active yaw angle control which tra-        flected in this calibration and might introduce biases in the
ditionally uses a nacelle-mounted sonic anemometer or wind         measurements. A method to detect and correct the degrada-
vane misalignment measurements to align the turbine with           tion of the sensors over time is presented in Mittelmeier and
the wind. The yaw motor actuation is slow to avoid excessive       Kühn (2018). Additionally, field experiments showed that
wear on its components, and temporary yaw misalignment is          wakes from neighbouring turbines can lead to yaw offsets
unavoidable (Burton et al., 2011). On the other hand, a sys-       from the dominant wind direction for downstream turbines
tematic error in yaw tracking leads to production losses and       (Schepers, 2009; McKay et al., 2013).
should be prevented.                                                  Several alternative sensors have been proposed to sense
   One source of yaw tracking error stems from the misalign-       yaw misalignment. In Pedersen et al. (2015) the use of spin-
ment measurements made by the nacelle sonic anemome-               ner anemometry is suggested to overcome the flow distor-
ter or wind vane, which are heavily disturbed by the flow          tions from blades and the nacelle. Three one-dimensional
around the rotor blades and the nacelle. These yaw sensors         sonic anemometers were mounted at the spinner to measure
can be calibrated against undisturbed reference wind direc-        horizontal wind speed, yaw misalignment and flow inclina-

Published by Copernicus Publications on behalf of the European Academy of Wind Energy e.V.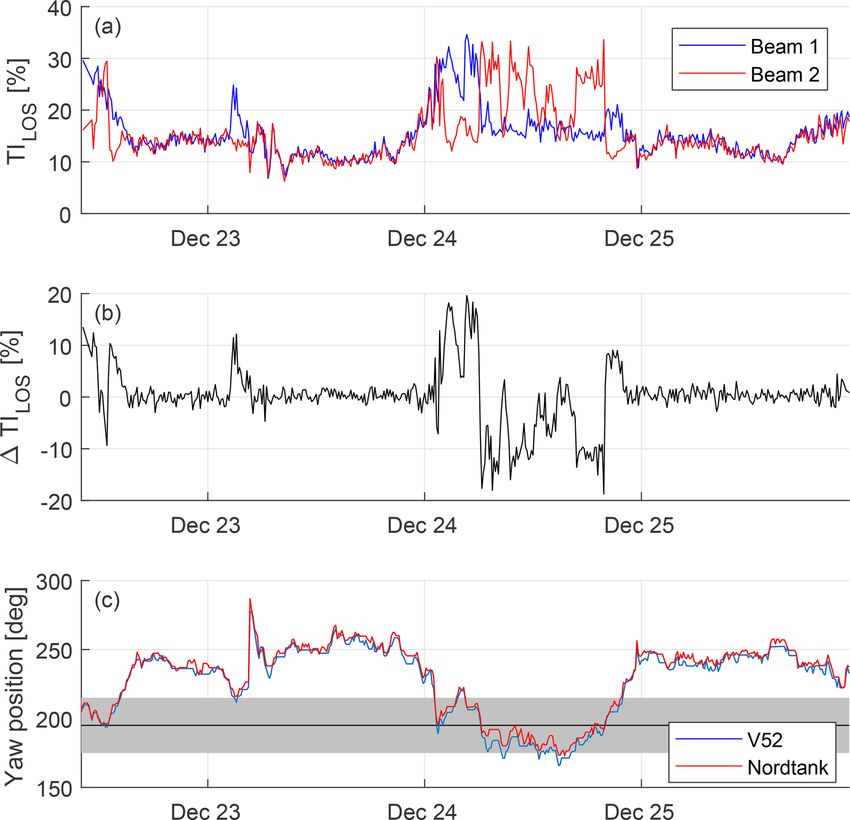
408 D. P. Held and J. Mann: Wake detection
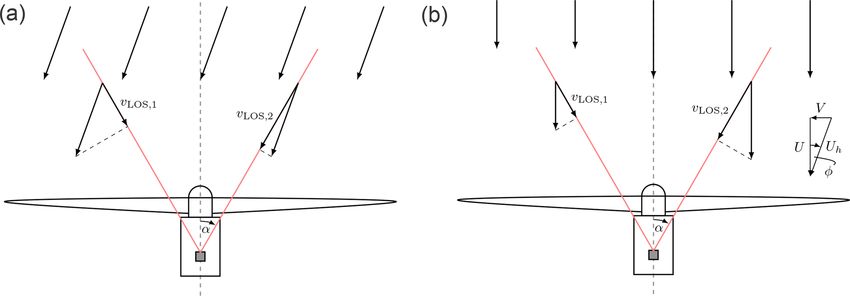
Figure 1. Illustration of a two-beam nacelle lidar mounted on a wind turbine to measure yaw misalignment. Misaligned horizontally homo-
geneous flow will affect the LOS measurements at the two focus positions (a). A wake in the field of view on one of the beams will affect
the LOS measurement in a similar way as a misaligned flow (b). From lidar measurements these two situations cannot be distinguished. The
variables are introduced in Sect. 2.1.
tion. Calibration of the sensor is necessary to remove mea- 1. no vertical wind vector component
surement biases (Demurtas and Janssen, 2016).
A wind state observer for vertical and horizontal shear, 2. horizontally homogeneous flow.
yaw misalignment and flow inclination based on flap- and In the case of a horizontally scanning lidar, the measured
edgewise blade bending moment measurements was formu- vertical component will always be very small since only
lated and tested through simulations in Bertelè et al. (2017) the LOS can be measured. Further, the horizontally homo-
and validated on a scaled experimental turbine in Bertelè geneous flow assumption is well satisfied if the terrain is
et al. (2018). In Bottasso et al. (2018) a similar observer using flat and homogeneous and if appropriate averages over time
flapwise blade bending moments was developed to estimate (commonly 1 to 10 min averages) are taken. Note that by
the average wind speed over four azimuthal sectors of the ro- changing the second assumption to a perfect yaw alignment,
tor plane. By comparing upper with lower and left with right the measurement of the lidar system can be interpreted as
sector, vertical shear and impinging wakes from upstream horizontal shear. This can pose a problem if the lidar is used
turbines could be detected. For the detection of wakes, the for yaw alignment and cyclic pitch control (Schlipf, 2015).
derived sector-wise mean wind speed and turbulence inten- The assumption of horizontal homogeneity is violated if a
sity were used. wake from an upstream turbine is impinging the field of view
Nacelle-mounted light detection and ranging (lidar) de- of one of the beams. Such a situation is illustrated in the right
vices have also been suggested to estimate yaw misalignment panel of Fig. 1. The left half of the rotor is exposed to a lower
(Scholbrock et al., 2015; Fleming et al., 2014). Due to their wind speed due to the wake, and thus the measurement at the
remote sensing capabilities, it is possible to measure the in- left LOS, vLOS1 , is reduced. This is similar to a reduction of
flow in front of the turbine. Measurements at a close distance one of the LOS speeds due to misaligned flow and cannot be
from the rotor are affected by the induction of the turbine, but distinguish from lidar measurements; see left illustration in
the severe influences of blades and nacelle behind the rotor Fig. 1. Thus, an impinging wake in the field of view of one
can be avoided. However, measuring only the line-of-sight of the beams will lead to a yaw misalignment measurement
(LOS) component along the laser beam requires the lidar sys- even though the flow is aligned. If the lidar should supply
tems to probe the wind field at several position over the rotor yaw misalignment measurements to the yaw controller, these
plane and to make assumptions of the incoming flow field to situations need to be identified and, if possible, the influence
derive the yaw misalignment of the turbine, leading to lim- of the wake needs to be corrected for.
itations. Thus, nacelle lidars are designed to steer the laser In general, scanning lidar systems, where the laser follows
light towards several focus positions. The most simple setup a trajectory rather than probes’ discrete points, are able to
is a two-beam system which scans two horizontal positions measure large-scale flow phenomena due to their high spatial
at the hub height of the turbine; see Fig. 1. and temporal resolution. The first field experiment of mea-
To derive the yaw misalignment from nacelle lidar mea- suring wakes behind turbines by a scanning continuous-wave
surements two common assumptions are made: (cw) lidar was conducted by Bingöl et al. (2010) and Trujillo
et al. (2011). A cw lidar was mounted on the nacelle of a tur-
bine looking downstream, and the derived flow information
Wind Energ. Sci., 4, 407–420, 2019 www.wind-energ-sci.net/4/407/2019/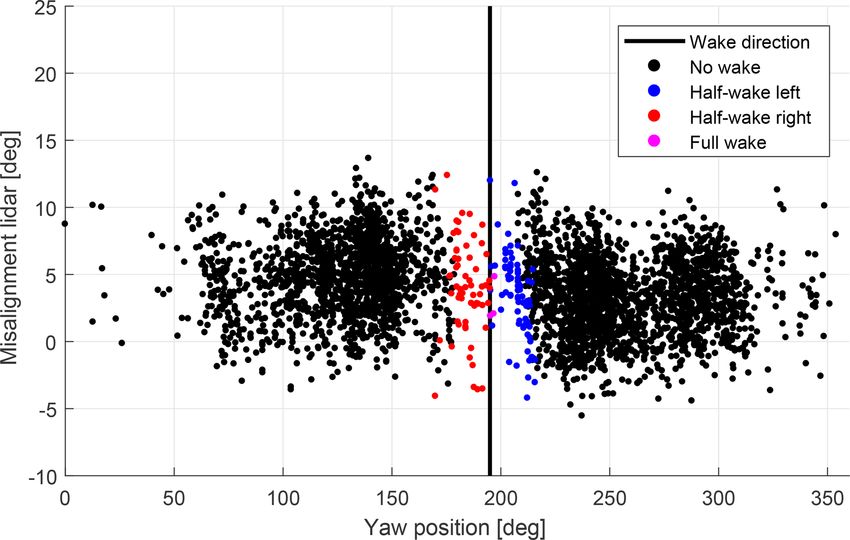
D. P. Held and J. Mann: Wake detection                                                                                       409

was sufficient to identify and characterize the meandering of      wake steering. Wake-steering wind farm control is also pos-
the wake. More recently, a nacelle-mounted cw lidar with a         sible without the use of lidars, but Quick et al. (2017) showed
fast scanning head was used to provide a detailed image of         that if uncertainty in the estimation of wind direction is con-
wake behind a turbine and track its movement under differ-         sidered, the benefits of wind farm control vanish compared
ent atmospheric conditions (Herges et al., 2017). Long-range       to single turbine optimization. Nacelle lidars offer the possi-
pulsed lidars positioned on the ground (Iungo et al., 2013;        bility to reduce the uncertainty of the yaw misalignment un-
Smalikho et al., 2013; Bodini et al., 2017) or in offshore         certainty and help improve the performance of a wake steer-
wind farms (Krishnamurthy et al., 2017) have also been used        ing wind farm controller. In Raach et al. (2017) backwards-
to measure wakes. The advantage of pulsed systems is their         facing nacelle lidars were used to track the wake behind a
increased range (of several kilometres) compared to cw sys-        turbine, which was subsequently used as input for a wake-
tems which allow the visualization of the wakes of multiple        steering wind farm controller. A similar approach is possible
turbines in a wind farm.                                           with forward-facing nacelle lidars considered here. The lidar
   However, the limited amount of information gathered by          can provide information on whether a downstream turbine is
commercially available nacelle lidars makes the detection          affected by a wake and if an upstream turbine needs to be
and characterization of wakes challenging. Currently, com-         misaligned to deflect the wake.
mercially available systems include Windar Photonics’ two-
and four-beam cw lidars with fixed focus distance, Leo-
                                                                   2     Methodology
sphere’s four-beam pulsed lidar with multiple focus distances
and ZX Lidars’ cw lidar with 50 focus points distributed on
                                                                   2.1    Measurement principles of nacelle lidars
a cone at variable focus distances1 .
   In this study Windar Photonics’ two-beam nacelle lidar          The fluctuating part of a three-dimensional (3-D) wind field
will be used to investigate the effect of wakes on the tur-        can be described by the vector field u(x, t) = (u1 , u2 , u3 ),
bine yaw misalignment measurements. The aim is to detect           where x and t refer to positions in space and time, respec-
half-wake situations that lead to biased misalignment mea-         tively. Lidar systems can sense wind speed by measuring the
surements and to correct the measurements so that they can         Doppler frequency shift of the backscattered laser light from
be used to perform turbine yaw alignment. First, we will pro-      aerosols suspended in the atmosphere. Cw systems emit light
pose an algorithm that utilizes the spectral broadening of         focused on a point in space continuously, while pulsed sys-
Doppler peaks from small-scale turbulence to detect wakes          tems transmit parcels of light and measure the backscatter as
in the turbine inflow (Sect. 2). We will then present the re-      the light progresses in space. In this study we will focus on
sults of the algorithm (Sect. 4) gathered during a field exper-    cw lidars.
iment described in Sect. 3. Finally, an empirical relationship        The measurement process of a cw lidar can be repre-
between the spectral width measurements and the difference         sented mathematically as the convolution between the pro-
in wind direction between lidar and a mast-mounted sonic           jected LOS component n · u and a weighting function ϕ(s)
anemometer is used to correct the erroneous misalignment           based on the laser intensity:
measurements.
   Results of proposed wake detection algorithm have al-                      Z+∞
ready been presented in Held et al. (2018). In this study mea-     vLOS (r) =    ϕ(s)n · u(sn + r)ds,                         (1)
surements from a commercial wind farm have been used and                       −∞
the detection performance of one lidar mounted on a tur-
bine with wakes originating from several surrounding tur-          where n is the laser beam unit directional vector, r is the fo-
bines was assessed. The turbine spacing ranged from three to       cus position and s is distance from the focus position along
seven rotor diameters. It was shown that the algorithm was         the laser line (Mann et al., 2010). The weighting function of
able to detect the wakes from all surrounding turbines. Note       a cw lidar can be approximated by (Sonnenschein and Horri-
that the correction method presented in this study was not         gan, 1971)
applied, because a reference wind direction sensor was not
available.                                                                  1 zR
                                                                   ϕ(s) =               ,                                     (2)
   The results of the wake detection algorithm not only can                 π zR2 + s 2
be applied to detect erroneous yaw misalignment measure-
ments but can also be applied to wind farm control, e.g. for       where zR is the Rayleigh length that characterizes the probe
                                                                   volume of the lidar. It depends on the focus distance squared,
   1 More information can be found on the company websites: Win-   i.e. zR ∝ |r|2 , and can vary between a few centimetres to tens
dar Photonics A/S (http://www.windarphotonics.com/, last access:   of metres. The probe volume has an attenuating effect on
29 June 2019), Leosphere (https://www.leosphere.com/products/,     the turbulent fluctuations in u, and variances (and thus tur-
last access: 29 June 2019) and ZX Lidars (https://www.zxlidars.    bulence intensities) will be underestimated. The attenuated
com/wind-lidars/zx-tm/, last access: 29 June 2019).                turbulent fluctuations will cause a broadening of the Doppler

www.wind-energ-sci.net/4/407/2019/                                                          Wind Energ. Sci., 4, 407–420, 2019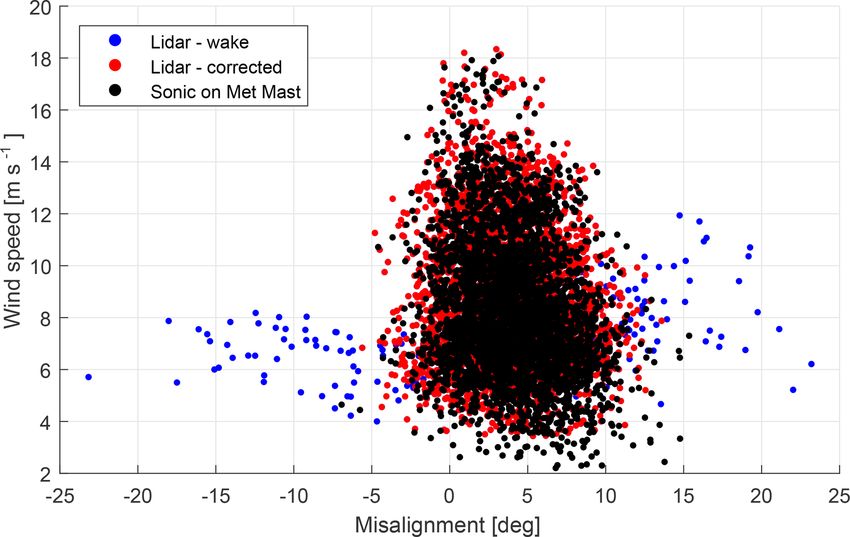
410                                                                                    D. P. Held and J. Mann: Wake detection

spectrum. The Doppler spectrum S(v, r) as function of LOS             It can be seen that an increasing wake deficit imposes a
component wind speed can be defined by                             positive bias onto φ
                                                                                      b since vLOS1 is reduced. The kinks that
                                                                   appear for the positive turbine misalignments occur once
             Z∞                                                    the wake deficit reduces the LOS 1 component to negative
S(v, r) =         ϕ(s)δ(v − n · u(sn + r))ds,               (3)    values. However, since the lidar uses a homodyne detec-
         −∞                                                        tion method, only the magnitude, not the sign, of LOS 1
                                                                   component can be sensed, and the measured misalignment
where δ(.) is the Dirac delta function. The delta function im-
                                                                   ranges between −60 and 60◦ . The effect of uw on U   bh leads
plies that the Doppler spectrum is an integration (or summa-
                                                                   to an over- and underestimation of the horizontal wind speed.
tion) of the values of ϕ(s), where n · u(sn + r) = v. The LOS
                                                                   Again, the negative turbine misalignments are effected more
speed vLOS , as defined by Eq. (1), is the first statistical mo-
                                                                   severely than positive misalignments.
ment of S(v, r):
             Z∞                                                    2.2   Wake detection algorithm
vLOS (r) =         vS(v, r)dv,                              (4)
                                                                   The wake detection algorithm is based on the following two
            −∞
                                                                   principles:
        R∞
where −∞ S(v, r)dv = 1 is assumed. The second central sta-          1. Within wind turbine wakes turbulence with a smaller
tistical moment of S(v, r) is the variance and a measure of the        length scale than the ambient flow is generated.
width of S(v, r):
                                                                    2. The small-scale turbulence will lead to a broadening of
             Z∞
 2                                                                     the Doppler spectrum due to the large probe volume of
σLOS (r) =        (v − vLOS (r))2 S(v, r)dv.                (5)        the lidar system.
             −∞
                                                                   The generation of small-scale turbulence has been investi-
   Based on the inflow assumption mentioned in Sect. 1, the        gated through simulations, scaled wind tunnel experiments
LOS speed measurements at the two positions of a two-beam          and field tests. The primary aim was to validate mean wake
lidar can be used to derive the yaw misalignment of the tur-       deficit profiles, but some studies also investigated turbulence
bine (see also Fig. 1). The following set of equations is used,    profiles and applied spectral analysis.
where the hat notation ( b . ) is used to indicate estimations        For example, in Troldborg et al. (2007) large eddy flow
from the lidar:                                                    simulations were conducted with an actuator line model rep-
                                                                   resenting the wind turbine. Enhanced levels of small-scale
vLOS1 = U cos α − V sin α                                   (6)    turbulence inside the wake were found. It was also found that
vLOS2 = U cos α + V sin α                                   (7)    the turbulence inside a wake is more isotropic than the ambi-
b = vLOS2 + vLOS1
U                                                           (8)
                                                                   ent flow. Similar results were found in a scaled wind tunnel
         2 cos α                                                   test. Singh et al. (2014) showed that wind turbines extract
     vLOS2 − vLOS1                                                 energy from mean and large-scale structures while increas-
V =
b                                                           (9)
                                                                   ing small-scale turbulence. In the near wake, a clear influ-
      p 2 sin α
        b2 + Vb2                                                   ence of the rotor is visible (e.g spikes at tower and blade fre-
Uh = U
b                                                          (10)
               !                                                   quencies in the turbulence spectra), but in the far-wake these
       −1 V                                                        effects merged into a range of amplified small-scale turbu-
             b
φ = tan
b                ,                                         (11)
             U
             b                                                     lences (Chamorro et al., 2012).
                                                                      Field experiments using mast anemometry also com-
where U and V are longitudinal and lateral wind speed, re-         pared power spectra between wake and ambient flow. In
spectively, and α is the angle between the shaft axis and the      Højstrup (1999) input of energy to high frequencies was ob-
laser beam. In the case of the two-beam lidar by Windar Pho-       served, which was detectable up to 14.5 rotor diameters be-
tonics, α = 30◦ . Yaw misalignment is defined as the angle the     hind the turbine. Similar result were obtained in Högström
turbine needs to yaw in the clockwise direction (seen from         et al. (1988) in which the high-frequency components of the
above) to align itself with the flow (see Fig. 1).                 streamwise component increased 4-fold in the wake three ro-
   An impinging wake in the field of view of one of the beams      tor diameters behind the turbine. Iungo et al. (2013) analysed
will lead to a bias in the lidar-estimated quantities (Eqs. 8–     wake observations gathered with a pulsed lidar system and
11). Here, we will analyse the case, where LOS 1 is affected       also found increased turbulence, but more turbulence was
by a reduction in the streamwise wind speed component due          created at the top of the rotor compared to the bottom part.
to an upstream wake deficit uw , i.e. vLOS1 = (U −uw ) cos α −        The effect of spectral broadening of the Doppler spec-
V sin α. The influence of uw on φ b and U
                                        bh for different turbine   trum due to turbulence and Doppler spectrum width mea-
misalignments φ is presented in Fig. 2.                            surements has been considered in several studies; for an

Wind Energ. Sci., 4, 407–420, 2019                                                        www.wind-energ-sci.net/4/407/2019/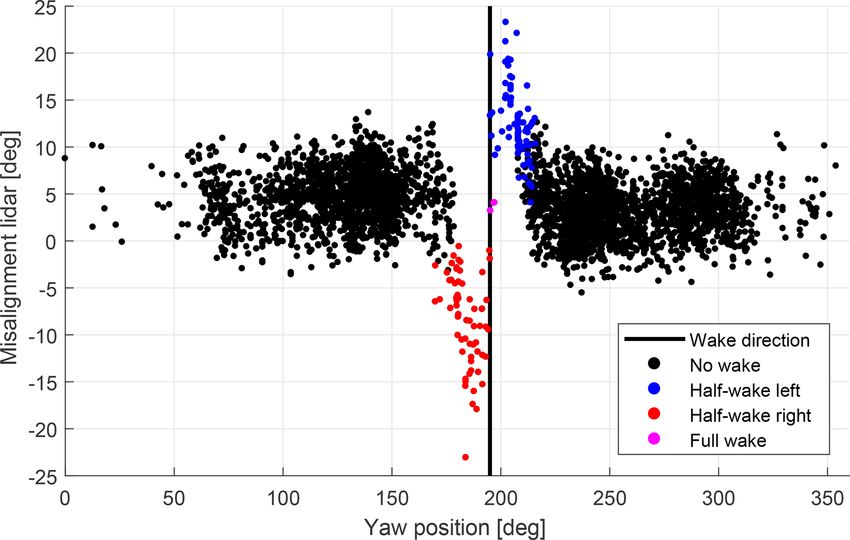
D. P. Held and J. Mann: Wake detection                                                                                            411

Figure 2. Influence of a streamwise flow speed reduction due to a wake uw at LOS 1 on the lidar estimates of turbine yaw misalignment φ
                                                                                                                                      b
and horizontal wind speed Ubh . The differently coloured lines represent different turbine misalignments φ.

overview see Sathe and Mann (2013). For example, Sma-                 tions, and situations in which a wake has been identified will
likho (1995) described the broadening process theoretically           not contribute to the running averages.
and proposed a method to measure the dissipation rate of tur-            Based on threshold values of the detection parameters, the
bulent kinetic energy. Branlard et al. (2013) showed that long        algorithm will then decide whether one or both beams are
time averages of the Doppler spectrum (in this case 10 and            affected by a wake. For example, if beam 1 is affected by a
30 min) approach the probability density function of a sonic          wake, vLOS1 will be reduced compared to vLOS2 even though
anemometer and can be used to improve variance measure-               the misalignment of the turbine will not change. Simultane-
ments. The same method to derive unfiltered variance was              ously, the turbulence intensity on beam 1 will increase due to
used for vertical-profiling lidars (Mann et al., 2010) and na-        the small-scale turbulence within the probe volume, and a de-
celle lidars (Peña et al., 2017).                                     tection signal will be visible on 1TILOS . The influence of the
   For both properties mentioned in the numbered list at              wake can also be seen on the yaw misalignment estimation
the beginning of this subsection, we will define the LOS-             b which will deviate from its mean value in ambient flow. A
                                                                      φ
equivalent turbulence intensity, TILOS , to characterize the          reversed situation appears when a wake is affecting beam 2.
small-scale turbulence contained in the probe volume of the           A change in wind direction could coincide with a wake im-
lidar:                                                                pingement on one of the measurement locations. In such a
                                                                      case, the algorithm cannot distinguish between the two. The
              σLOS (r)
TILOS (r) =            ,                                    (12)      current threshold values have been found manually by try-
              vLOS (r)                                                ing different thresholds and investigating the wake detection
including the difference in TILOS between LOS 1 and LOS 2             algorithm performance.
                                                                         At the initialization the algorithm requires some wake-free
1TILOS = TILOS (r LOS1 ) − TILOS (r LOS2 ),                 (13)      observations to establish correct values of the running aver-
                                                                      ages. The observations are used to calculate running averages
where the r LOS1 and r LOS2 refer to the focus positions of           of φ,
                                                                         b TILOS2 and TILOS1 . From our experience a few hours of
beam 1 and beam 2. The turbulence intensities and their               wake-free data are sufficient. Note that the wind conditions
differences will be calculated from 1 min average spectra.            during operation need to be similar to the conditions during
Shorted averaging times have also been tried, but the best            initialization.
performance was achieved with 1 min averages. If a beam
is exposed to a wake inflow we expect an increased TILOS              3   Experimental setup
compared to a beam exposed to the ambient flow. Consider-
ing turbulence intensities allows the comparison of different         In this study, two field experiments executed at DTU’s test
wind speed regimes.                                                   site at the Risø Campus were analysed. The site consists of
   The wake detection algorithm is designed to treat the 1 min        a row of turbines, of which two have been operative dur-
spectra consecutively and will compare the values of the de-          ing the experiment: a Vestas V52 turbine with 850 kW rated
tection parameters TILOS (r LOS1 ), TILOS (r LOS2 ), 1TILOS and       power, a hub height of 44 m and a diameter of 50 m, and a
b to their values from ambient, wake-free conditions. A run-
φ                                                                     smaller Nordtank turbine with 500 kW rated power, a hub
ning average of these values is calculated from previous mea-         height of 36 m and a diameter of 41 m. Further, data from
surements. The running averages aim to represent the values           a meteorological mast at a distance of 120 m = 2.3DV from
of the detection parameters under ambient, wake-free condi-           the Vestas V52 turbine, where DV = 52 m, have been used.

www.wind-energ-sci.net/4/407/2019/                                                            Wind Energ. Sci., 4, 407–420, 2019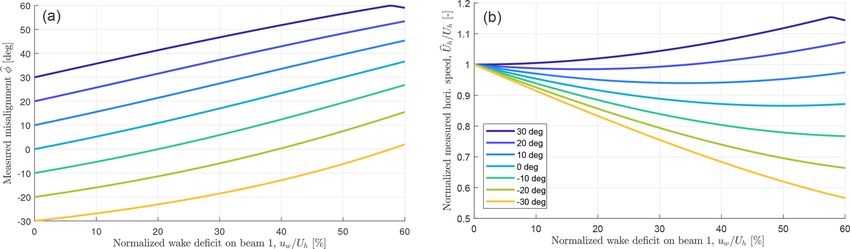
412                                                                                         D. P. Held and J. Mann: Wake detection

Figure 3. (a) Digital terrain model (DTM) of the Technical University of Denmark’s (DTU) test site at Risø where the two turbines and the
lidar are also shown. The black line indicates the wake direction of 195◦ . Zone 32 UTM coordinates centred at the Vestas V52 turbine were
used. The DTM data were obtained from the Danish Map Supply (Agency for Data Supply and Efficiency, 2018). (b) Wind rose derived
from sonic anemometer measurements on the meteorological mast during the experiment. The dashed black line indicates the direction of
the Nordtank turbine.

The distance between the Vestas and the Nordtank turbine is            et al. (2010). It can be seen that during the experiment the
215 m (5.2DN or 4.1DV ) at an angle of 195◦ (clockwise from            stability of the atmosphere was mainly neutral with a moder-
north), where DN = 41 m. A picture of the site can be found            ate number of stable and few unstable conditions.
in Fig. 3.
   The Vestas V52 turbine was equipped with a two-beam na-             4   Results
celle lidar by Windar Photonics during two distinct periods.
Initially, one system was mounted between 5 December 2015              In this study, data are compared during normal power pro-
and 12 January 2016, and a second system was mounted be-               duction of the turbines. To achieve this, lower thresholds
tween 29 March and 4 May 2016. The systems have iden-                  on the minimum power production (i.e. > 0 kW), minimum
tical properties. The opening angle between shaft axis and             rotor speed (i.e. > 16 rpm) and maximum pitch angle (i.e.
beam was 30◦ , and the focus distance was 37 m (implying               < 23◦ ) in each 10 min period were applied for the Vestas V52
that zR = 2.1 m). The objective of the experiment was to ob-           turbine. Since the Nordtank turbine is stall regulated a lower
tain yaw misalignment measurements from the lidars with                threshold on minimum power production (i.e. > 0 kW) and
special focus on the influence of the wake from the Nord-              minimum rotor speed (i.e. > 27 rpm) have been applied. The
tank turbine onto the Vestas V52. The data acquisition sys-            filtering removed 53.3 % of the data for both experiments.
tem of the turbine was logged turbine, mast and lidar data at          Additionally a filter was applied on the lidar data. Instances
a sampling rate of 35 Hz. For the analysis the data have been          where the LOS speed could not be determined from the
downsampled to 1 Hz.                                                   Doppler spectra have been summed within a 10 min period.
   The wind rose during the two experimental periods derived           If more than 10 % of the data (or 60 measurements) were
from a sonic anemometer mounted at the Vestas V52 hub                  missing, the 10 min period was rejected. Instances where four
height on the meteorological mast is shown in Fig. 3. The              or more consecutive unavailable measurements occurred on
direction of wakes from Nordtank onto V52 is indicated as a            any of the two beams were also discarded. Whether a mea-
dashed black line. Two dominant directions can be identified;          surement is available or not was decided internally by the
the waked wind direction only represents a small share of the          lidar system and depended on carrier-to-noise ratio and the
data.                                                                  Doppler peak shape and area. This led to a discard of an ad-
   The turbulence intensity and a count of the stability classes       ditional 1.8 % of the data.
that occurred during the experiment can be found in Fig. 4.                Next, the influence on yaw misalignment estimates of a
The turbulence intensity has been determined by the hub-               wake emitted by the Nordtank turbine onto the Vestas V52
height sonic anemometer based on 10 min averages. The                  is investigated. The derived 10 min mean misalignment φ    b as
atmospheric stability has been calculated using the lowest             function of yaw angle of the turbine can be seen in Fig. 5.
sonic anemometer positioned at a height of 18 m based on
30 min averages. The calculation of the Obukhov length and
the definition of the stability classes was taken from Peña

Wind Energ. Sci., 4, 407–420, 2019                                                              www.wind-energ-sci.net/4/407/2019/
D. P. Held and J. Mann: Wake detection                                                                                                 413

Figure 4. Hub height turbulence intensity versus wind speed (a) and count of the stability classes (b).

Figure 5. Lidar-estimated 10 min mean yaw misalignment φ
                                                       b as function of turbine yaw position. The vertical black line indicates the position
of the upstream Nordtank turbine. A clear influence of the wake on the misalignment estimates around the wake sector can be seen.

   The vertical black line indicates the position of the Nord-           wind speed and a slender peak compared to the blue spec-
tank turbine. It can be seen that outside the wake sector the            trum which is affected by a wake. The reduced wind speed
misalignment ranges around a mean misalignment of 5◦ . In-               and increased turbulence inside the wake leads to a lower
side the wake sector large deviations from the mean mis-                 LOS speed and a larger width of the Doppler spectrum com-
alignment can be observed. In situations where the right half            pared to the red spectrum. Both spectra were gathered during
of the rotor (at yaw position < 195◦ ) experiences a wake,               the same 1 min interval. Thus, the same ambient turbulence
LOS 2 will be affected by a reduced wind speed. Thus, a                  conditions can be assumed for the two measurement loca-
negative influence on the misalignment estimates by the li-              tions.
dar can be observed. Deviations of up to 30◦ can be seen.                   A time series result of the detection parameters over 3 days
Similar behaviour can be recognized when the wake affects                can be found in Fig. 7. The top two panels show TILOS
the left part of the rotor (at yaw position > 195◦ ). Here, the          and 1TILOS , while the bottom panel shows the yaw posi-
deviation is smaller, but a clear influence is still visible.            tion of the two turbines. The horizontal black line and the
   An example of the two spectra are shown in Fig. 6. The red            grey shading indicate the wake sector. In general, it can be
spectrum was measured in the free flow and shows a higher                seen that if both turbines are positioned outside the wake

www.wind-energ-sci.net/4/407/2019/                                                                 Wind Energ. Sci., 4, 407–420, 2019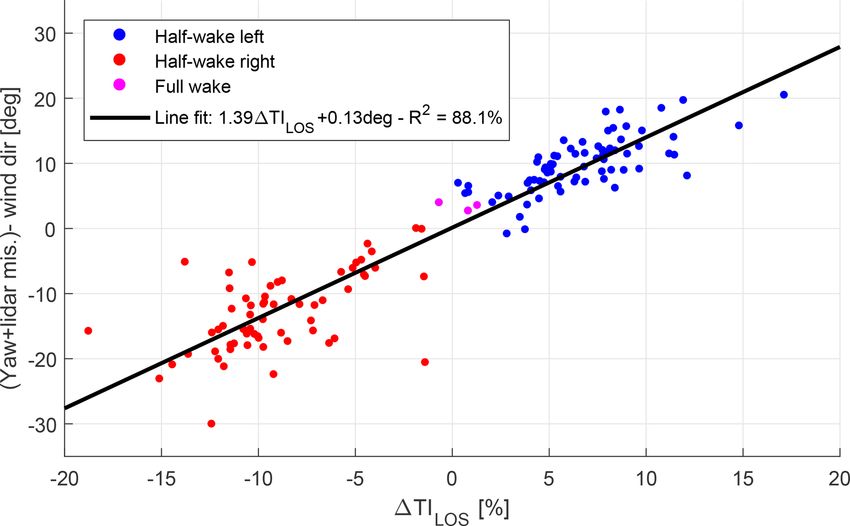
414 D. P. Held and J. Mann: Wake detection
Figure 6. Example of two lidar Doppler spectra gathered during the same 1 min interval. The red spectrum is measured in the free flow,
while the blue spectrum is affected by a wake. For the blue spectrum, the reduced wind speed and increased spectral width can clearly be
seen. The spectra are averaged over 1 min.
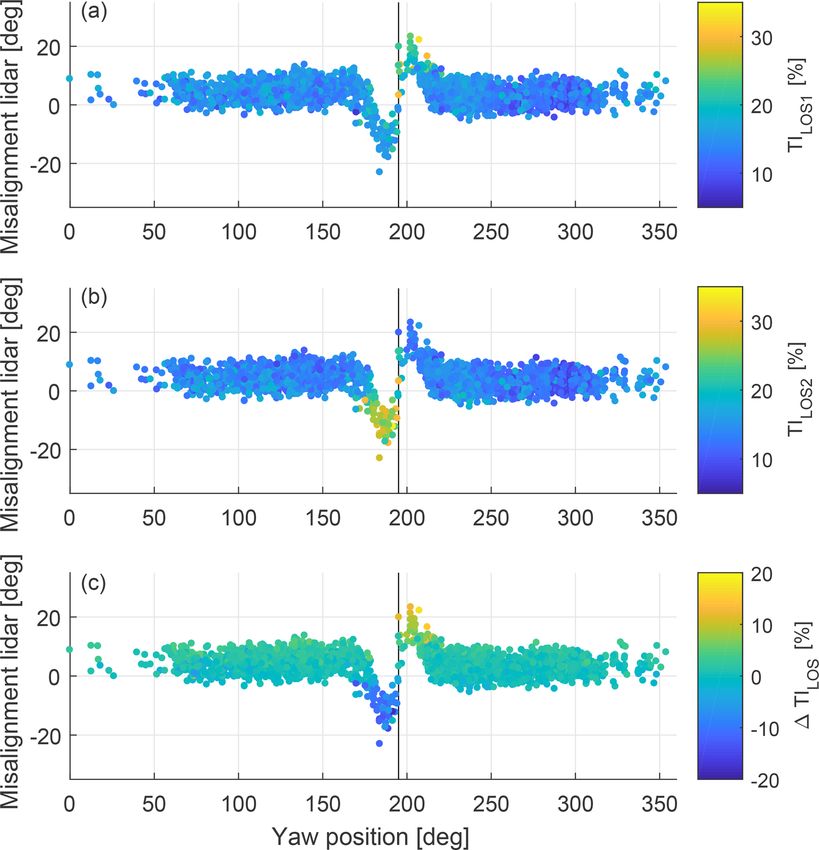
Figure 7. Example time series of TILOS (a), 1TILOS (b) and the
yaw positions of the two turbines (c). The black horizontal line and
Figure 8. Lidar-estimated 10 min mean yaw misalignment φ b as
the grey shading in the bottom plot indicate the wake position (i.e.
function of turbine yaw position. (a) TILOS1 , (b) TILOS1 and
195◦ ) and a band of 195◦ ± 20◦ , respectively.
(c) 1TILOS . The vertical black line indicates the position of the
upstream Nordtank turbine (at 195◦ ).
sector, TILOS on both beams is approximately equal, i.e.
1TILOS ≈ 0. Thus, no significant difference of the turbu-
lence levels within the lidar probe volumes is detected. As not present on beam 2. Hence, a positive increase in 1TILOS
soon as both turbines yaw into a wake situation deviations can be observed. Similarly, the half-wake situations on the
of TILOS between beam 1 and beam 2 can be detected. For right half of the rotor on 24 December lead to higher TILOS2
example, on 23 December the wind direction changes such than TILOS1 .
that the Vestas V52 is in a half-wake situation, in which the An overview of the measured TILOS and 1TILOS against
left half of the rotor is affected based on their yaw positions. the yaw position of the Vestas V52 turbine can be seen in
In this case a spike in TILOS1 can be identified. This corre- Fig. 8. Here, parallel observations to the previous figure can
sponds to increased small-scale turbulence originating from be made. If the turbine is yawing at angles corresponding
the wake flow within the probe volume of beam 1 which is to half-wake conditions on the right half of the rotor (i.e
Wind Energ. Sci., 4, 407–420, 2019 www.wind-energ-sci.net/4/407/2019/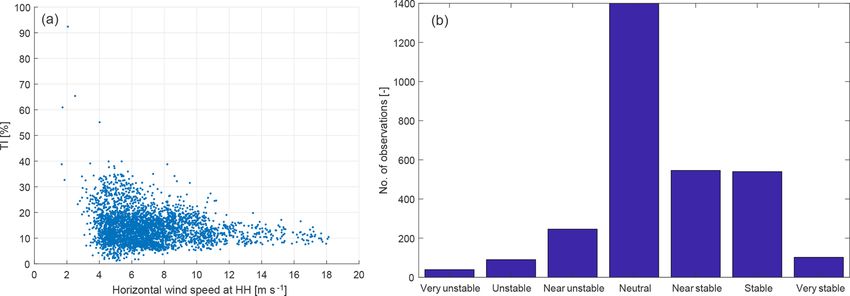
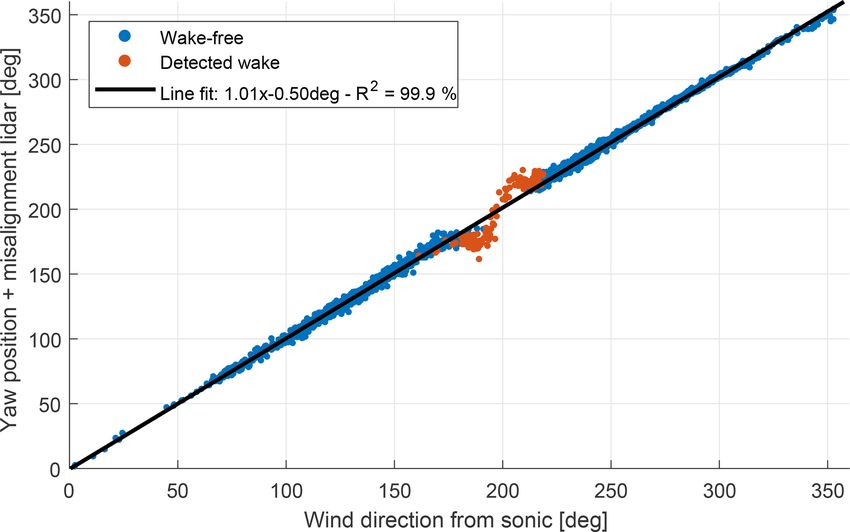
D. P. Held and J. Mann: Wake detection                                                                                                   415

Figure 9. Lidar-estimated 10 min mean yaw misalignment φ b as function of turbine yaw position. The vertical black line indicates the position
of the upstream Nordtank turbine. Detected waked situations are shown as coloured dots.

< 195◦ ), high values for TILOS2 and negative 1TILOS can be              affected by the wake have been detected correctly. Towards
observed. This case reverses for half-wake situations on the             the edge of the wake sector possible false or missed detec-
left half of the rotor where high TILOS1 and positive 1TILOS             tions could have occurred. However, this cannot be verified
can be noticed. For the full-wake case, increased TILOS on               since no alternative method to measure the location of the
both beams appears and 1TILOS shows values that are com-                 wake was available during the experiment.
parable to non-wake, ambient flow conditions. It can also                   Next, the detected results will be analysed in detail and the
be seen that for non-wake cases 1TILOS is slightly positive.             misalignment will be corrected with the help of the undis-
This is due to the mean misalignment which reduces the LOS               turbed wind direction measurement from a sonic anemome-
speed on beam 1; see left illustration in Fig. 1. Thus, the ratio        ter mounted on the close by meteorological mast at the hub
TILOS1 is slightly increased compared to TILOS2 .                        height of the Vestas V52 turbine; see Fig. 3. First, the corre-
   The next figure presents the results of the detection algo-           lation between the wind direction estimation from the lidar
rithm; see Fig. 9. Again, the misalignment derived from the              and the measurement from the sonic will be compared. The
lidar measurements is plotted against the yaw position of the            absolute wind direction can be obtained by adding the lidar
Vestas turbine. Periods where a wake is detected in the in-              misalignment measurement to the yaw position of the tur-
flow are shown as coloured dots and distinguished as left                bine. Both the turbine and the sonic anemometer have been
half-wakes (beam 1 is affected by a wake), right half-wakes              carefully aligned to north. The resulting correlation can be
(beam 2 is affected) and full wakes where both beams mea-                seen in Fig. 10.
sure a wake influence. It can be seen that all detection results            It should be noted that outside the wake sector the two sig-
are clustered around the position of the upstream Nordtank               nals show a high degree of similarity. The fitted line, which
turbine where a wake is expected. Also, all negative devi-               has been fit using the wake-free observations only, shows a
ations from the mean misalignment are identified as right                unity slope with a very small offset of 0.5◦ . The root mean
half-wakes and all positive deviations as left half-wakes. The           squared error is 2.53◦ . However, the measurements which
recognized full wakes lie very close to the vertical black line          are affected by a wake show the characteristic deviations that
and show no significant discrepancy from the mean misalign-              could also be seen in Fig. 5. This suggests that the flow as-
ment. However, only three full-wake situations were identi-              sumptions that are used to derive the lidar misalignment are
fied. This can be explained by the different rotor sizes and             valid if no wakes are impinging the field of view, but a correc-
the position of the focus points of the lidar, which are located         tion is necessary for wake situations. If the correlation, which
towards the edges of the Vestas V52 rotor.                               is observed for non-wake observations, also holds for wake
   It can be observed that all detected wake situations are cen-         cases, the difference between the wind direction from sonic
tred around the wake sector. This means that no free-flow                anemometer and lidar can only originate from the influence
conditions have been falsely detected as wake situations by              of the wake.
the algorithm. In addition, all situations in which the lidar is

www.wind-energ-sci.net/4/407/2019/                                                                 Wind Energ. Sci., 4, 407–420, 2019
416                                                                                            D. P. Held and J. Mann: Wake detection

Figure 10. 10 min mean wind direction correlation between the meteorological mast sonic anemometer and the wind direction estimate
from the lidar, i.e. lidar misalignment + yaw position of the turbine. Outside the wake sector a high degree of similarity can be observed. The
identified wake situations lead to a bias. The line fit is performed on wake-free data only.

Figure 11. Difference between absolute wind direction estimated from the lidar (i.e. lidar misalignment + turbine yaw position) and sonic
anemometer versus the detection parameter 1TILOS . Only the observations in which a wake has been identified are shown. The line fit
indicates that the data fit well to a linear regression model.

   Thus, we suggest the use of the wind direction measure-                vice versa. The identified full wakes both have a wind direc-
ments from the sonic anemometer to obtain an empirical re-                tion error and 1TILOS close to zero.
lationship between the detection parameter 1TILOS and the                    A linear line has been fitted to the data, which shows that
bias in the wind direction measurements from the lidar and                the data follow approximately a linear relationship. The de-
the sonic anemometer. This relationship is shown in Fig. 11.              rived equation is as follows: 1.391TILOS +0.13◦ . This equa-
It can be observed that detected half-wake situations on the              tion can now be used to correct the misalignment measure-
right side of the rotor show persistent negative 1TILOS and               ments by the lidar that are affected by a wake. Wake-free
                                                                          observations remain unchanged. The result of the correction

Wind Energ. Sci., 4, 407–420, 2019                                                                 www.wind-energ-sci.net/4/407/2019/
D. P. Held and J. Mann: Wake detection 417
Figure 12. Lidar-estimated 10 min mean yaw misalignment φ b as function of turbine yaw position. The vertical black line indicates the
position of the upstream Nordtank turbine. Detected wake situations have been corrected according to the relationship found in Fig. 10.
can be seen in Fig. 12, and by comparing this figure with 5 Conclusions
Fig. 9 the performance of the correction method can be eval-
uated. After the correction it is seen that the misalignment es- In this study we investigate how nacelle-mounted cw li-
timates, which are affected by wakes and previously showed dar systems can be used to estimate wind turbine misalign-
large deviations from the mean misalignment, are now within ment even in inflow with a wake. Lidars offer the possi-
the range of the wake-free observations. It was possible to bility of remotely sensing the inflow of turbines and avoid
adjust both the positive and negative spikes stemming from the flow disturbance caused by the blades and the nacelle
half-wakes on the left and right side of the rotor. The full- which are usually encountered by nacelle wind vanes or sonic
wake situations are only affected slightly because their differ- anemometers. Correct alignment of turbines is important be-
ence in TILOS is small. The root mean squared error (RMSE) cause power production losses can be mitigated.
of the difference between the wind direction estimate from Nevertheless, due to the limitation of measuring only the
the sonic anemometer and the lidar (compare Fig. 10) is LOS component of the approaching wind, a lidar system
4.47◦ for the wake-free data and 7.68◦ for the wake-affected needs to measure at several positions in front of the wind
data. After the correction has been applied to the identified turbine and assumptions about the flow field need to be made
wake situations, the RMSE of the wake-affected data has to derive quantities of interest. A common assumption is that
dropped to 4.22◦ , which is similar to the RMSE of the wake- of horizontal homogeneity of the inflow which states that at
free data. positions of the same height the wind vector is equal. This
Finally, an overview of the misalignment measurement assumption is usually satisfied if the terrain is flat and homo-
is compared to the misalignment measured by the sonic geneous and if appropriate averages over time, commonly 1
anemometer at the meteorological mast. The misalignment to 10 min averages, are taken. It can, however, be violated if
versus wind speed is shown in Fig. 13. It can be seen that both a wake from a neighbouring turbine is impinging the inflow,
the lidar and sonic measurements follow a similar trend. At and the reduced wind speed inside a wake leads to a bias on
low wind speeds the misalignment is centred around 5◦ , and the horizontal wind speed and wind direction.
as the wind speed increases the misalignment reduces. The Here, this influence is evaluated experimentally from two
influence of wakes on the lidar measurements has been iden- measurement campaigns, where a two-beam cw nacelle lidar
tified and corrected as previously described. Slightly lower was mounted on a Vestas V52 turbine which is exposed to
wind speed measurements from the sonic anemometer can a wake from a slightly smaller neighbouring turbine. It was
be observed, which are caused by the wake of the Vestas V52 shown that within the wake sector the influence of wakes in-
turbine on the meteorological mast (at yaw angles of 289◦ ). duces biases on the misalignment measurement as large as
30◦ from the mean misalignment outside the wake sector.
Half-wake situations on the right side of the rotor lead to
negative deviations, while half-wakes on the left side result
www.wind-energ-sci.net/4/407/2019/ Wind Energ. Sci., 4, 407–420, 2019418 D. P. Held and J. Mann: Wake detection
Figure 13. Comparison between the 10 min mean yaw misalignment estimated from the lidar and the sonic on the meteorological mast (Met
Mast). The observations affected by wakes are shown in blue and the corrected measurements in red.
in positive bias. This implies that if lidars were to be used for affected by wakes yielded a correction of the large misalign-
turbine yaw alignment, the observations that are affected by ment deviations experienced during half-wake situations.
wake interaction must be identified and corrected. Thus, we have shown how the detrimental effect of wake
The wake detection algorithm presented here is based on on nacelle lidar measurements can be mitigated. However,
the spectral-broadening effect of the lidar Doppler spectrum for the correction it was necessary to utilize the undisturbed
because of small-scale turbulence within the probe volume. wind direction measurements from a mast-mounted sonic
Since lidar systems perform measurements over a rather anemometer. The turbines that have been used in this exper-
large measurement volume, high-frequency turbulent fluctu- iment are smaller than current utility-scale turbines. Hence,
ations are attenuated and are not visible in the LOS speed it was possible to use short lidar focus distances which result
signal but lead to a widening of the Doppler spectrum. The in a narrow probe volume, and the spectral widening is due
small-scale turbulence generated inside wake flows will lead to turbulence of a very small length scale. In this experiment
to more broadening than in the ambient flow. Thus, by com- average spectra of 1 min were sufficient to detect the wake-
paring the spectral width of the Doppler spectrum at differ- induced turbulence. If the lidar is installed on larger turbines,
ent focus locations, wakes that affect the field of view of where larger focus distances are required, the probe volume
one or both beams can be detected. The detection parameter will increase, and shorter averaging times might be necessary
used in this study is the LOS-equivalent turbulence intensity to only detect turbulence generated within the wake. Shorter
TILOS = σvLOS
LOS
. averaging times lead to increased signal noise and can have
The performance of the algorithm is presented in Fig. 9 an effect on the estimation of the Doppler spectrum variance.
and shows that all lidar observations that measure the wind The ambient turbulence intensity during the experiment
direction wrongly can be identified. Only very few full-wake was moderate, while the stability of the atmosphere was
situations were observed due to the size difference of the tur- mainly neutral. Thus, the increased turbulence within the
bines. To correct the wind direction measurements affected wake flows could be distinguished from ambient flow. On
by wakes an empirical relationship between lidar turbulence a site with higher ambient turbulence conditions, this dis-
measurements and the deviation of the lidar wind direction tinction could be more difficult. One approach would be
from the true direction measured by a sonic on a nearby mast to decrease the averaging time of the lidar Doppler spec-
was established. It was shown that the absolute wind direc- trum, which would only allow small-scale fluctuations to
tion measurements from both sensors have a high degree of contribute to the width of the Doppler spectrum. These small-
correlation for non-wake cases. A linear relationship between scale fluctuations occur mainly in wake flows, while the am-
the difference in TILOS between the two beams and the dif- bient turbulence generated by the terrain or obstacles are of
ference in wind direction between the lidar and the sonic larger scale.
was found. Applying this relationship to the measurements The proposed correction method relies on the availabil-
ity of a reference instrument, which is not always present.
Wind Energ. Sci., 4, 407–420, 2019 www.wind-energ-sci.net/4/407/2019/D. P. Held and J. Mann: Wake detection 419
The linear relationship between error in wind direction and part I: one-dimensional scanning, Wind Energ., 13, 51–61,
1TILOS is supported by experimental data for the test site https://doi.org/10.1002/we.352, 2010.
considered here. So far no experience has been gathered on Bodini, N., Zardi, D., and Lundquist, J. K.: Three-
how this relationship changes when the lidar is used at a dimensional structure of wind turbine wakes as measured
different site. More experimental data are need to build an by scanning lidar, Atmos. Meas. Tech., 10, 2881–2896,
https://doi.org/10.5194/amt-10-2881-2017, 2017.
understanding of how site-specific parameters, like turbine
Bottasso, C. L., Cacciola, S., and Schreiber, J.: Local
spacing, rotor diameter or ambient turbulence levels, influ- wind speed estimation, with application to wake im-
ence the relationship. Ideally, a universal relationship that is pingement detection, Renew. Energy, 116, 155–168,
valid for different turbines and sites could avoid the usage of https://doi.org/10.1016/j.renene.2017.09.044, 2018.
a reference instrument. Branlard, E., Pedersen, A. T., Mann, J., Angelou, N., Fis-
cher, A., Mikkelsen, T., Harris, M., Slinger, C., and Montes,
B. F.: Retrieving wind statistics from average spectrum of
Data availability. The data are not publicly available since they continuous-wave lidar, Atmos. Meas. Tech., 6, 1673–1683,
contain confidential information owned by Windar Photonics A/S. https://doi.org/10.5194/amt-6-1673-2013, 2013.
Burton, T., Jenkins, N., Sharpe, D., and Bossanyi, E. A.: Wind En-
ergy Handbook, 2nd edn., Wiley, 2011.
Author contributions. DPH performed the research work and Chamorro, L. P., Guala, M., Arndt, R. E., and Sotiropou-
prepared the paper. JM conceived the research plan and supervised los, F.: On the evolution of turbulent scales in the
the research work and paper preparation. wake of a wind turbine model, J. Turbul., 13, 1–13,
https://doi.org/10.1080/14685248.2012.697169, 2012.
Demurtas, G. and Cornelis Janssen, N. G.: An innovative
Competing interests. The authors declare that they have no con- method to calibrate a spinner anemometer without the use
flict of interest. of yaw position sensor, Wind Energ. Sci., 1, 143–152,
https://doi.org/10.5194/wes-1-143-2016, 2016.
Fleming, P. A., Scholbrock, A. K., Jehu, A., Davoust, S., Osler,
E., Wright, A. D., and Clifton, A.: Field-test results using a
Acknowledgements. The authors wish to thank Nikolaos Kouris
nacelle-mounted lidar for improving wind turbine power capture
and Antoine Larvol for their contributions to the wake detection
by reducing yaw misalignment, J. Phys. Conf. Ser., 524, 012002,
algorithm. Further, the authors want to acknowledge the EUDP
https://doi.org/10.1088/1742-6596/524/1/012002, 2014.
project: Lidar Detection of Wakes for Wind Turbine Optimization
Held, D. P., Kouris, N., and Larvol, A.: Wake detection in
(project number: 64016-0020).
the turbine inflow using nacelle lidars, IOP Conf. Ser. J.
Phys. Conf. Ser., 1102, 012005, https://doi.org/10.1088/1742-
6596/1102/1/012005, 2018.
Financial support. This research was partly funded by the Inno- Herges, T. G., Maniaci, D. C., Naughton, B. T., Mikkelsen, T.,
vationsfonden Denmark (grant no. 5016-00182) and Windar Pho- and Sjöholm, M.: High resolution wind turbine wake measure-
tonics A/S. ments with a scanning lidar, J. Phys. Conf. Ser., 854, 012021,
https://doi.org/10.1088/1742-6596/854/1/012021, 2017.
Högström, U., Asimakopoulos, D. N., Kambezidis, H., Helmis,
Review statement. This paper was edited by Sandrine Aubrun C. G., and Smedman, A.: A field study of the wake be-
and reviewed by two anonymous referees. hind a 2 MW wind turbine, Atmos. Environ., 22, 803–820,
https://doi.org/10.1016/0004-6981(88)90020-0, 1988.
Højstrup, J.: Spectral coherence in wind turbine wakes, J. Wind
Eng. Ind. Aerodyn., 80, 137–146, https://doi.org/10.1016/S0167-
References 6105(98)00198-6, 1999.
Iungo, G. V., Wu, Y.-T., and Porté-Agel, F.: Field Measurements of
Agency for Data Supply and Efficiency: DHM/Terræn (0,4 m Wind Turbine Wakes with Lidars, J. Atmos. Ocean. Tech., 30,
grid), available at: https://download.kortforsyningen.dk/ 274–287, https://doi.org/10.1175/JTECH-D-12-00051.1, 2013.
content/dhmterr\T1\textbackslash%C3\T1\textbackslash% Krishnamurthy, R., Reuder, J., Svardal, B., Fernando, H. J., and
A6n-04-m-grid, last access: 6 December 2018. Jakobsen, J. B.: Offshore Wind Turbine Wake characteristics
Bertelè, M., Bottasso, C. L., Cacciola, S., Daher Adegas, F., and using Scanning Doppler Lidar, Enrgy. Proced., 137, 428–442,
Delport, S.: Wind inflow observation from load harmonics, https://doi.org/10.1016/j.egypro.2017.10.367, 2017.
Wind Energ. Sci., 2, 615–640, https://doi.org/10.5194/wes-2- Mann, J., Peña, A., Bingöl, F., Wagner, R., and Courtney, M. S.:
615-2017, 2017. Lidar Scanning of Momentum Flux in and above the Atmo-
Bertelè, M., Bottasso, C. L., and Cacciola, S.: Brief communication: spheric Surface Layer, J. Atmos. Ocean. Tech., 27, 959–976,
Wind inflow observation from load harmonics – wind tunnel val- https://doi.org/10.1175/2010JTECHA1389.1, 2010.
idation of the rotationally symmetric formulation, Wind Energ. McKay, P., Carriveau, R., and Ting, D. S.-K.: Wake impacts on
Sci., 4, 89–97, https://doi.org/10.5194/wes-4-89-2019, 2019. downstream wind turbine performance and yaw alignment, Wind
Bingöl, F. , Mann, J. and Larsen, G. C. (2010), Light Energ., 16, 221–234, 2013.
detection and ranging measurements of wake dynamics
www.wind-energ-sci.net/4/407/2019/ Wind Energ. Sci., 4, 407–420, 2019420 D. P. Held and J. Mann: Wake detection Mittelmeier, N. and Kühn, M.: Determination of optimal wind Scholbrock, A. K., Fleming, P. A., Wright, A. D., Slinger, C., Med- turbine alignment into the wind and detection of alignment ley, J., and Harris, M.: Field test results from lidar measured yaw changes with SCADA data, Wind Energ. Sci., 3, 395–408, control for improved yaw alignment with the NREL Controls https://doi.org/10.5194/wes-3-395-2018, 2018. Advanced Research Turbine, AIAA SciTech, 2015. Pedersen, T. F., Demurtas, G., and Zahle, F.: Calibration of a spinner Singh, A., Howard, K. B., and Guala, M.: On the homogenization anemometer for yaw misalignment measurements, Wind Energ., of turbulent flow structures in the wake of a model wind turbine, 18, 1933–1952, https://doi.org/10.1002/we.1798, 2015. Phys. Fluids, 26, https://doi.org/10.1063/1.4863983, 2014. Peña, A., Gryning, S.-E., and Mann, J.: On the length-scale of Smalikho, I. N.: On measurement of dissipation rate of the turbulent the wind profile, Q. J. Roy. Meteor. Soc., 136, 2119–2131, energy with a CW Doppler lidar, Atmos. Ocean. Opt., 10, 788– https://doi.org/10.1002/qj.714, 2010. 793, 1995. Peña, A., Mann, J., and Dimitrov, N.: Turbulence characterization Smalikho, I. N., Banakh, V. A., Pichugina, Y. L., Brewer, W. A., from a forward-looking nacelle lidar, Wind Energ. Sci., 2, 133– Banta, R. M., Lundquist, J. K., and Kelley, N. D.: Lidar investi- 152, https://doi.org/10.5194/wes-2-133-2017, 2017. gation of atmosphere effect on a wind turbine wake, J. Atmos. Quick, J., Annoni, J., King, R., Dykes, K., Fleming, P. A., Ocean. Tech., 30, 2554–2570, https://doi.org/10.1175/JTECH- and Ning, A.: Optimization Under Uncertainty for Wake D-12-00108.1, 2013. Steering Strategies, J. Phys. Conf. Ser., 854, 012036, Sonnenschein, C. M. and Horrigan, F. A.: Signal-to-Noise Re- https://doi.org/10.1088/1742-6596/854/1/012036, 2017. lationships for Coaxial Systems that Heterodyne Backscat- Raach, S., Schlipf, D., and Cheng, P. W.: Lidar-based wake track- ter from the Atmosphere., Appl. Opt., 10, 1600–1604, ing for closed-loop wind farm control, J. Phys. Conf. Ser., 753, https://doi.org/10.1364/AO.10.001600, 1971. 052009, https://doi.org/10.1088/1742-6596/753/5/052009, 2017. Troldborg, N., Sørensen, J. N., and Mikkelsen, R.: Actuator line Sathe, A. and Mann, J.: A review of turbulence measurements using simulation of wake of wind turbine operating in turbulent inflow, ground-based wind lidars, Atmos. Meas. Tech., 6, 3147–3167, J. Phys. Conf.Ser., 75, 012063, https://doi.org/10.1088/1742- https://doi.org/10.5194/amt-6-3147-2013, 2013. 6596/75/1/012063, 2007. Schepers, J. G.: Analysis of 4.5 years of EWTW wake measure- Trujillo, J. , Bingöl, F. , Larsen, G. C., Mann, J., and Kühn, M.: ments, Tech. rep., Energy Centre of the Netherlands, 2009. Light detection and ranging measurements of wake dynamics. Schlipf, D.: Lidar-Assisted Control Concepts for Wind Turbines, Part II: two-dimensional scanning, Wind Energ., 14, 61–75, PhD thesis, University of Stuttgart, 2015. https://doi.org/10.1002/we.402, 2011. Wind Energ. Sci., 4, 407–420, 2019 www.wind-energ-sci.net/4/407/2019/
You can also read