Predictors and geographic analysis of road traffic accidents in Leon, Nicaragua - SciELO
←
→
Page content transcription
If your browser does not render page correctly, please read the page content below
https://doi.org/10.1590/1980-549720210003

  ORIGINAL ARTICLE / ARTIGO ORIGINAL

Predictors and geographic analysis of road
traffic accidents in Leon, Nicaragua
Preditores e análise geográfica de acidentes de trânsito em León, Nicarágua
Christian Toval-RuizI            , Carlos Rojas-RoqueI               , Akram Hernández-VásquezII

     ABSTRACT: Objective: To identify environmental factors present in areas with high density of road traffic
     accidents (RTA) in Leon, Nicaragua. Methods: The analysis included all accidents recorded by the Police
     Department in León City, from January to June 2017. All crashes were georeferenced, and data were collected
     from the environment elements within a perimeter of 20 meters from the site in which accidents occurred
     with a pre-tested data collection instrument. We specified a Poisson regression model to estimate incidence
     rate ratios (IRR) and 95% confidence intervals (CI) to determine environmental factors associated with the
     event incidence. For the identification areas with high, medium, and low occurrences of crashes, kernel density
     around points in which RTA occurred were estimated. Results: Out of 667 recorded crashes, 90% involved
     men aged 15–40, and motorcycle accidents represented 60% of injuries or deaths. Environmental factors that
     were positively associated with RTA included good road conditions (adjusted IRR = 1.36, 95%CI 1.13 – 1.63)
     and the existence of bicycle lanes (adjusted IRR = 1.64, 95%CI 1.29 – 2.10). Environmental characteristics
     associated with higher speeds and heavier accidents can increase their incidence. Conclusion: We found that
     high-foot-traffic commercial or touristic centers are three areas with high density of crashes. Local authorities
     can use these findings to promote road safety measures in high-incidence areas in León City.
     Keywords: Accidents, traffic. Epidemiology. Geographic Information Systems. Nicaragua.

I
 Centro de Investigación en Demografía y Salud, Facultad de Ciencias Médicas, Universidad Nacional Autónoma de Nicaragua –
León, Nicaragua.
II
   Universidad San Ignacio de Loyola, Vicerrectorado de Investigación, Centro de Excelencia en Investigaciones Económicas y
Sociales en Salud – Lima, Peru.
Corresponding author: Christian Toval-Ruiz. Centro de Investigación en Demografía y Salud, Facultad de Ciencias Médicas, Universidad
Nacional Autónoma de Nicaragua. La Merced Church ½ block West, 21000, León, Nicaragua. E-mail: chris0412toval@gmail.com
Conflict of interests: nothing to declare – Financial support: none.

                                                              1
                                            REV BRAS EPIDEMIOL 2021; 24: E210003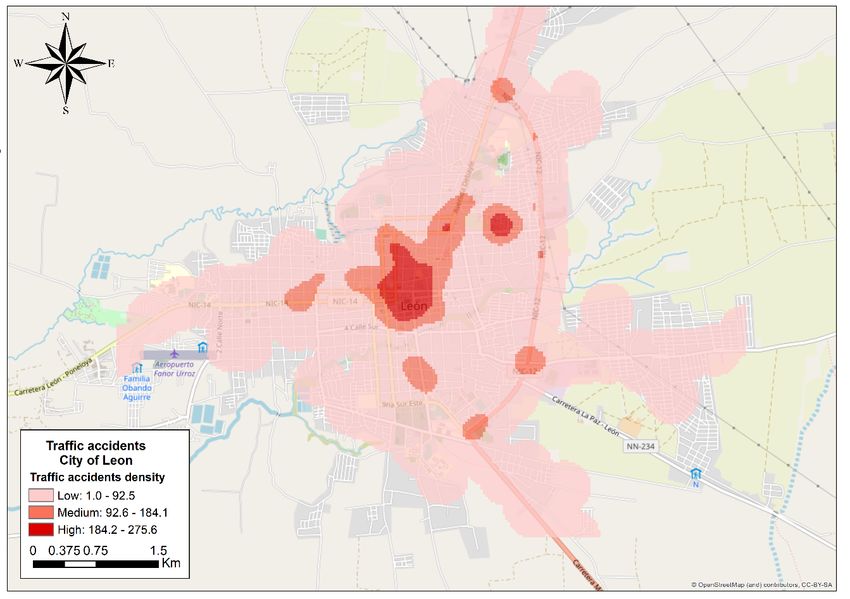
TOVAL-RUIZ, C. ET AL.

RESUMO: Objetivo: Identificar os fatores ambientais presentes em áreas com alta densidade de acidentes de trânsito
rodoviário (ATR) em León, Nicarágua. Métodos: Foram incluídos na análise todos os acidentes registrados pelo
Departamento de Polícia da cidade de León de janeiro a junho de 2017. Georreferenciamos todos os acidentes e
coletamos dados dos elementos ambientais em um perímetro de 20 metros do local até os acidentes ocorridos
por meio de um instrumento de coleta de dados pré-testado. Foi especificado um modelo de regressão de Poisson
para estimar as razões das taxas de incidência (TI) e intervalos de confiança de 95% (IC95%) para determinar os
fatores ambientais associados à incidência do evento. Para identificar áreas com alta, média e baixa ocorrência de
acidentes, estimamos a densidade do núcleo em torno dos pontos onde o ATR ocorreu. Resultados: Dos 667 acidentes
registrados, 90% envolveram homens com idades entre 15 e 40 anos, e os acidentes de motocicleta representaram
60% dos ferimentos ou mortes. Os fatores ambientais que foram associados positivamente aos ATR incluíram
boas condições da estrada (TI ajustada = 1,36; IC95% 1,13 – 1,63) e a existência de ciclovias (TI ajustada = 1,64;
IC95% 1,29 – 2,10). Características ambientais associadas a velocidades mais altas e acidentes mais pesados podem
aumentar a incidência deles. Conclusão: Constatamos que os centros comerciais ou turísticos com tráfego intenso
são três áreas com alta densidade de acidentes. As autoridades locais podem usar essas descobertas para promover
medidas de segurança no trânsito em áreas de alta incidência na cidade de León.
Palavras-chave: Acidentes de trânsito. Epidemiologia. Sistemas de Informação Geográfica. Nicarágua.

INTRODUCTION
    Road traffic accidents (RTA) are a major public health problem, projected to severely
increase in the coming decades.1,2 In 2015, it caused 1.2 million deaths globally, and by 2030,
projections say that as many as 2.2 million deaths will be attributed to this health problem.3
Furthermore, between 20 and 50 million people suffer some type of permanent physical dis-
ability due to accidents injuries.4 According to the World Health Organization (WHO), 90%
of years of life lost due to death or disability in low- and middle-income countries (LMIC)
are attributable to traffic accidents, which becomes a major burden to their health systems.3,5
    In LMIC, the incidence and importance of road traffic injuries has increased over the
last decade. An article about traffic accidents and alcohol studied the number of injuries
associated with accidents in some hospitals of Latin America and the Caribbean. Four coun-
tries of Central America were included in the study, and Nicaragua registered the highest
number of injuries caused in RTA after Guatemala.6 Otherwise, the National Police Office
alone reported annually the behavior of accidents in Nicaragua. For the last years, reports
said RTA increased 31.6% between 2010 and 2017 (23,797 to 43,912 accidents respectively),
placing crashed as the leading cause of violent death (638 reports) in the country, over
killings (114 reports) and murders (282 reports), quantifying its material damage at more
than a half million dollars in 2017. A long time ago, some articles about injuries of acci-
dents reported in a hospital of León Nicaragua were published. However, we cannot find
new studies that explain what are happening with road traffic injuries in the last 10 years.7,8
One in every four deaths and two in every ten injuries caused by RTA happen to pedestrians,
                                                            2
                                          REV BRAS EPIDEMIOL 2021; 24: E210003
Predictors and geographic analysis of road traffic accidents in Leon, Nicaragua
occurring primarily in cities with high population density.8 When some elements like good
conditions of weather traffics signs and others are not present in streets, the likelihood of
crashes occurring increases, even more in places with foot traffic.9 This suggests the need
to study environmental characteristics that promote the occurrence of RTA, particularly in
high-population areas like León, Nicaragua (2017 population: 208,792; density: 252/km2).8
Due to economic, touristic, and academic activity, the department of León is considered one
of the most economically important departments in Nicaragua.10 National Police records
indicate that next to Managua (capital city of the country, with 24% of deaths due to acci-
dents) and Matagalpa (9.9% of deaths due to accidents), León has registered a high num-
ber of death from crashes (7.8%, ranking third in mortality by RTA in the country), mak-
ing it one of the most important cities to understand the patterns and predictors of RTA.8
Geographical information systems (GIS) allow the visualization of elements that are
present in roads that may increase the likelihood of road traffic injuries.11-13 For example,
areas of high commercial or touristic activity in which there is heavy foot traffic tend to have
higher incidence of accidents.14-16 Likewise, studies show that areas near bus stops, colleges
and universities, commercial centers, and hospitals increment the likelihood of crashes.17,18
The use of GIS to describe the environments in which RTA have occurred can facilitate the
proper management of economic resources to mitigate its effects on health.19-22 The incor-
poration of GIS in studies based on hospital and police data have identified geographic areas
at increased risk of negative health and safety outcomes, and can help local authorities to
identify priority areas for preventive interventions.11
In Nicaragua, few studies have incorporated GIS to understand and effectively intervene
on health issues in communities. The objective of this study was to identify environmental
factors present in areas with high density of RTA in León City, Nicaragua, facilitating the
understanding of the factors that contribute to accidents and permitting future interven-
tions to reduce morbidity and mortality due to it.
METHODS
DATA COLLECTION
A cross-sectional study and spatial analysis in the city of León were conducted to exam-
ine the environmental conditions in the areas in which RTA occurred. Between January and
June 2017, 738 records of accidents from National Police files were identified, in which 1,281
people were involved. Of these, 59 records (8.0%) were missing basic data related to the
people involved in the RTA, and 12 records (1.6%) sites could not be located due to lack of
documentation on the address of accident occurrence. We found complete information in
667 records (90.4%), which were included in the study. Data were collected in two phases.
In the first phase, the official records of each accident from the National Police Office of
León were assessed to extract data about RTA, such as address and place of occurrence,
3
REV BRAS EPIDEMIOL 2021; 24: E210003TOVAL-RUIZ, C. ET AL.
time, date, cause of crashes, and characteristics of the people involved in them. The second
phase consisted of georeferencing the sites where the traffic accident occurred and collect-
ing environmental information of the site. We visited every site where an RTA occurred,
and captured the latitude and longitude of the site using location sensors of mobile devices.
Then, using an ad hoc questionnaire, we collected environmental data related to sites infra-
structure, presence of trees in the street, among other information.
We employed a data collection instrument designed a priori to abstract data from each
record found in police documents, including sociodemographic aspects of people involved in
the RTA; cause of crashes as determined by the National Police Office; resulting health con-
dition of the people involved (uninjured; injured if any people of official health service trans-
ferred anyone involved in the RTA to a hospital or clinic); type of vehicle involved; and the
roles of the individuals involved in the RTA. We also used the instrument to collect environ-
mental data at the site of crashes, including road conditions (“good” if no damage to the infra-
structure was observed; “under repair/bad” if the road was under construction by the local
government, or if the road was damaged and not under construction); place of occurrence
(“highway” the Pan American Highway that crosses the periphery of the city; “street”; and
“avenue”); trajectory of the road (straight, curved, on a hill); road material (“paved”, includ-
ing asphalt, cobblestone, hydraulic and concrete, and “dirt”) presence of a bicycle lane on the
street (yes/no); presence of trees obstructing road view (yes/no); presence of a stoplight (yes/
no); presence of street signs indicating traffic laws or potential hazards (yes/no); and presence
of informal businesses in public walkways that obstruct foot traffic (yes/no). These envi-
ronmental elements were then measured within a circumference of 20 meters from the site
where the RTA occurred and were recorded in the data collection instruments at the time of
site visit. The instrument was piloted with 30 records from December 2016. We identified and
corrected weaknesses in the instrument that prevented high-quality abstraction of data from
Police records, and recorded environmental data from traffic accident sites.
We created an electronic version of the data collection instrument with the Epicollect5
platform (Imperial College of London, United Kingdom: https://five.epicollect.net), and
collected georeferenced data and environmental data of the RTA using a phone mobile
device. The precision of coordinates from the mobile device was tested by comparing them
to those obtained from the high-precision Garmin® Global Positioning System GPSMAP
64S. We found a difference of less than five meters when we observed the values between
the devices.
DATA ANALYSES
We used frequencies and proportions to describe the characteristics of the people involved
in RTA and their health condition following the accidents, as well as the environmental fac-
tors that were present at the time of crashes. For the identification of factors associated with
the occurrence of accidents, we first created the dependent variable, by clustering all traffic
4
REV BRAS EPIDEMIOL 2021; 24: E210003Predictors and geographic analysis of road traffic accidents in Leon, Nicaragua
accidents located within a 20 meters circumference. As a result, 285 geographical spaces where
at least one accident occurred were identified, and we defined the geographical spaces as
the unit of analysis for the regression model. Independent variables were the environmen-
tal factors collected during RTA site visits. Then, we specified a generalized linear model
with a Poisson distribution and log link function. This model is used when the data come
from counts of events that occur by chance with a certain frequency and can be modeled
in terms of incidence rates that depend on certain explanatory variables. The model allows
us to control various independent variables simultaneously. The adequacy and convergence
of the model was assessed using the Akaike information criteria, the residual versus fitted
plot, the q-q plot of the residuals, the linearity plot (square root of the residual deviance
versus predicted values), and residuals versus predictor variables. We obtained the statistics
associated with the model to assess the existence of influential values.
In bivariate analyses, we estimated the incidence rate ratio (IRR) and 95% confidence
interval (95%CI) between the dependent variable and each independent variable. The envi-
ronmental variables that were associated with accidents with p < 0.2 were included in a
multivariable model to estimate adjusted IRRs. All analyses were conducted using Stata 12
(StataCorp: College Station, Texas, USA).
We used ArcGIS v.10.2 (Esri: Redlands, CA, USA) software to complete the spatial anal-
ysis. All geographic coordinates of the traffic accident sites obtained by mobile devices
were re-coded in Universal Transverse Mercator projection (UTM projection) with the
GeoConverter 1.0 software (Center for Demographic and Health Research, National
Autonomous University of Nicaragua, León), and then exported to ArcGIS to create a shape-
file (.shp) with all the geographic coordinates. We used the World Geodetic System 1984
(WGS 84) projected coordinate system, in which Nicaragua is in the 16th zone North based
on its geographic coordinates. We used the kernel density estimator (KDE) to analyze places
with a high density of health events like RTA. The KDE calculated the distribution of points
in a city or country to know the behavior of health problems, and it helps us identify the
areas with high, moderate, and low density of crashes.23,24 Using a base map layer for León
City from OpenStreetMap (openstreetmap.org), which provides weekly updates of map
layers reflecting new roads and developments, we loaded the geographic locations of each
accident as points on a map. The size of the search radius representing areas of high, mod-
erate, and low density of RTA was automatically calculated by ArcGIS based on the median
distance of all geographic points from the mean center of all entered points.
ETHICAL CONSIDERATIONS
The protocol for this study was approved by the Ethics Committee for Biomedical
Research of the School of Medical Sciences at the National Autonomous University of
Nicaragua, León. We also received the approval from the Chief of the delegation of the
National Police to access the database of RTA during the study period.
5
REV BRAS EPIDEMIOL 2021; 24: E210003TOVAL-RUIZ, C. ET AL.
RESULTS
CHARACTERISTICS OF PEOPLE INVOLVED IN TRAFFIC ACCIDENTS
Of the people involved in RTA, 90% were men and half were adults aged between 25
and 40. All deaths occurred among men, including three men younger than 40, who were
traveling on motorcycles. One death occurred to a 65-year-old foreigner man (Table 1).
The main causes of RTA in which injuries or dead occurred, as established by the National
Police, were: overtaking (20.9%), disregard for traffic signals (14.9%), and improper turning
(13.4%), which together represent 49.2% of causes of all crashes (Table 1). Other registered
causes (38.8%) included driving in reverse, mechanical failure, failure to respect pedestrians
and stop on crosswalks, and failure to maintain a safe distance between vehicles.
ENVIRONMENTAL FACTORS
RTAs were distributed in 285 distinct geographic spaces within 20 meters of the locations of
them. The bivariate regression analysis showed that crashes occurred twice as frequently on the high-
way as compared to street (IRR = 1.72, 95%CI 1.30 – 2.27). Paved roads were associated two times
more with the incidence of RTA compared to dirt roads (IRR = 2.11, 95%CI 1.09 – 4.08), and roads
in good conditions were associated with a 50% increase in the incidence of accidents compared to
roads under repair/bad (IRR – 1.49, 95%CI 1.26 – 1.78). Roads with a bicycle lane increase the inci-
dence of RTA compared to roads without bicycle lanes (IRR = 1.89, 95%CI 1.52 – 2.34) (Table 2).
In multivariable analysis, main road or highway compared to a street road remained sig-
nificantly associated with and increased incidence of RTA (IRR = 1.40, 95%CI 1.02 – 1.92),
and roads in good conditions have more crashes compared to those under repair/bad (IRR =
1.36, 95%CI 1.13 – 1.63) as did the presence of a bicycle lane (IRR = 1.64, 95%CI 1.29 – 2.10)
(Table 2). In these variables, the association was attenuated for other factors.
SPATIAL ANALYSIS
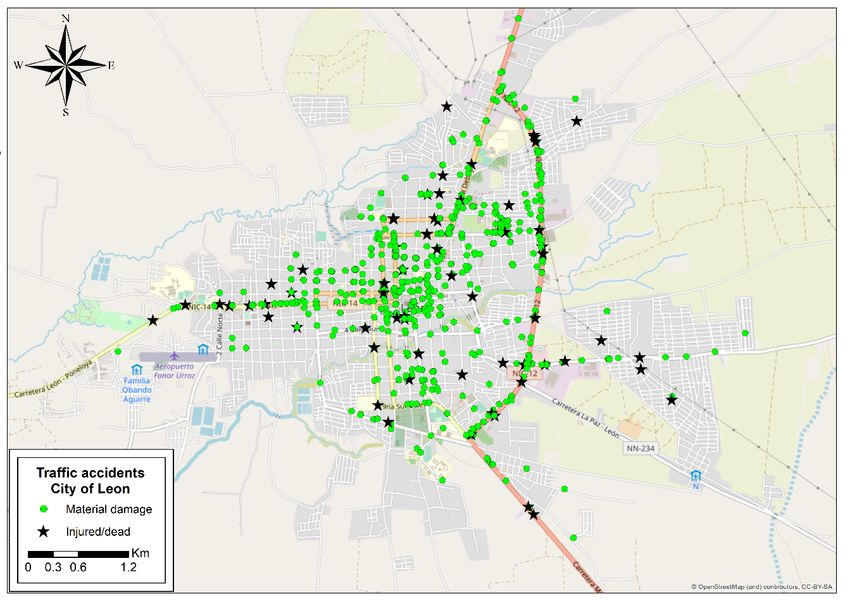
The city main roads were the locations with the highest number of RTA. The distribu-
tion of accidents that resulted in injury or death occurred on the main roads connecting the
center of León City to the main interurbans roads of the city. More crashes were registered
in the Northern part of the city, at the city exits, and in the stretch of the Pan-American
Highway that crosses the city (Figure 1).
We mapped areas of high, moderate, and low density of RTA in Figure 2. One big area
of low-density, seven areas of medium density, and three areas of high-density were found.
According to the density map, crashes were most highly concentrated in the city center,
stretching towards the North of the city and towards the highway (Figure 2).
6
REV BRAS EPIDEMIOL 2021; 24: E210003Predictors and geographic analysis of road traffic accidents in Leon, Nicaragua
Table 1. Characteristics of people involved in road traffic accidents and their resulting health
status, January–June 2017, León, Nicaragua (n = 1,281).
Health Status
Uninjured Injured Dead Total
Variable
(n = 1,196) (n = 81) (n = 4) n (%)
n (%) n (%) n (%)
Sex
Male 1,076 (89.9) 65 (80.2) 4 (100.0) 1145 (89.4)
Female 120 (10.1) 16 (19.8) - 136 (10.6)
Age (years old)
0–18 8 (0.7) 10 (12.3) 1 (25.0) 19 (1.5)
19–24 177 (14.8) 17 (21.0) 1 (25.0) 195 (15.2)
25–40 574 (48.0) 43 (53.1) 1 (25.0) 618 (48.2)
41–64 398 (33.3) 10 (12.3) - 408 (31.9)
65 or more 39 (3.3) 1 (1.2) 1 (25.0) 41 (3.2)
Nationality
Nicaraguan 1,179 (98.9) 81 (100.0) 3 (75.0) 1,263 (98.6)
Foreigner 17 (1.1) - 1 (25.0) 18 (1.4)
Role in the RTA
Driver 1,192 (99.7) 59 (71.6) 2 (50.0) 1,253 (97.8)
Passenger 3 (0.2) 14 (17.4) 1 (25.0) 18 (1.4)
Pedestrian 1 (0.1) 8 (9.9) 1 (25.0) 10 (0.8)
Type of vehiclea
Cars 610 (51.0) 37 (31.3) 1 (25.0) 648 (49.6)
Motorcycles 293 (24.4) 59 (50.0) 3 (75.0) 348 (26.5)
Public transportation 139 (11.6) 13 (11.0) - 152 (11.6)
Heavy transportation 114 (9.5) 4 (3.3) - 118 (9.0)
Other 32 (2.6) 5 (4.2) - 37 (2.8)
Causes of RTAb
Overtakingc 91 (15.1) 14 (20.9) 105 (15.7)
Disregard for traffic signals 84 (13.9) 10 (14.9) 94 (14.1)
Wrong-way driving 79 (13.1) - 79 (11.8)
Unsafe distance 207 (34.4) 8 (11.9) 215 (32.12)
Improper turn 60 (9.9) 9 (13.4) 69 (10.3)
Others d
80 (13.3) 26 (38.8) 106 (15.8)
RTA: road traffic accident; the total number of vehicles involved in road traffic accidents exceeds the number of
a
crashes, as multiple vehicles may have been involved in a single accident: uninjured (n = 1,188), injured (n = 118),
dead (n = 4), Total (N = 1,310); bcause of road traffic accidents registered for accidents in which a material damage
(uninjured) or human damage (injured or death) occurred; cwhen a vehicle invades the lane due to a fixed or moving
obstacle in front of it; dother causes of crashes include driving in reverse, mechanical failure, failure to yield right-
of-way to pedestrians.
7
REV BRAS EPIDEMIOL 2021; 24: E210003TOVAL-RUIZ, C. ET AL.
Table 2. Environmental factors of geographic spaces and associations with number of road traffic
accidents, January–June 2017, León, Nicaragua (N = 285).
Crude IRR Adjusted IRR*
Variable n p-value p-value
(95%CI) (95%CI)
Place of occurrence
Street 143 Ref. Ref.
Avenue 127 1.01 (0.86 – 1.18) 0.866 1.02 (0.87 – 1.20) 0.770
Highway 15 1.72 (1.30 – 2.27) < 0.001 1.40 (1.02 – 1.92) 0.034
Road material
Paved 277 2.11 (1.09 - 4.08) 1.49 (0.76 – 2.95)
0.026 0.241
Dirt 8 Ref. Ref.
Condition of the road
Under repair/bad 100 Ref. Ref.
< 0.001 0.001
Good 185 1.49 (1.26 – 1.78) 1.36 (1.13 – 1.63)
Presence of bicycle lane
Yes 24 1.89 (1.52 – 2.34) 1.64 (1.29 – 2.10)
< 0.001 < 0.001
No 261 Ref. Ref.
IRR: incidence rate ratio; 95%CI: 95% confidence interval; Ref.: reference; *each variable adjusted for all other variables
in the table.
Figure 1. Distribution of road traffic accidents by severity of crash, January–June 2017, León,
Nicaragua. The green points indicate crashes that did not result in injuries but resulted in material
damage. The black stars indicate accidents that resulted in injury or death.
8
REV BRAS EPIDEMIOL 2021; 24: E210003Predictors and geographic analysis of road traffic accidents in Leon, Nicaragua
Figure 2. Kernel density of road traffic accidents in León, Nicaragua, January–June 2017. Three areas
of high density (between 184 to 275 crashes) were identified in León City, near the entrance of the
highway, and the bus station with high commercial, touristic and educational activities.
DISCUSSION
In an analysis of environmental and spatial correlates of RTA in León, Nicaragua, the
location of the accidents on high-traffic roads, the presence of bicycle lanes, good conditions
of the road, paved roads, and bicycle lanes were associated with an increased incidence of
crashes. We identified three zones with high density of RTA, which were in areas with the
heaviest commercial, touristic, and educational activities in the city. Such data can be used
to assess needs for road safety interventions to prevent injury and death due to accidents.
It has been documented that human error influenced by environmental factors and
deficiencies in road maintenance are associated with involvement in a RTA.14 The pres-
ence of intersections, trees that obstruct vision while driving or walking, and pedestrian
space occupied by informal businesses can increase the risk of crashes.15,16,25 In this study, a
greater number of accidents occurred on asphalt roads that were in good conditions and on
roads that contained bicycle lanes. This is in line with previous studies that showed associ-
ation of adverse infrastructure conditions, such as road surface conditions, street type and
road width, lighting as well as location type with higher odds to RTA.26 This finding can be
explained because geometry limits the driver’s vision and makes it difficult to control the
vehicle at crash time with subsequent increase in fatal crashes risk.27
9
REV BRAS EPIDEMIOL 2021; 24: E210003TOVAL-RUIZ, C. ET AL.
Good road conditions and pavement are conducive to a higher density of vehicular
traffic26 and exceeding speed limits,27 which put others at risk of being injured due to
an RTA.28 These conditions were present in the zones we identified having the high-
est density of accidents. Implementing regulatory measures to control traffic in essen-
tial, including adequate traffic signaling in streets with greater presence of vehicles
and pedestrians, particularly young and elderly pedestrians who are most vulnerable
to injury or death due to RTA.9 Some variables like road use, traffic density in streets
and the foot traffic frequency on a daily basis are fundamental to control the effect of
this study in the results about distribution and severity of crashes in León City. Those
data are not found in Nicaragua.
With respect to the zones with high density of road accidents, we identified the largest
zone in the city’s historic center. The frequency of people conducting commercial activities
and the proximity of intersections are key factors that can increase the risk of accidents.12,17
The historic center and the bus terminal comprise the city’s financial district, in which com-
mercial activity and foot traffic are present daily. This sector comprehends five of the primary
markets in the city, and the main private schools and university campuses which accom-
modate thousands of students every day. These locations, in agreement with studies from
other countries, lead to high concentrations of people and pedestrian traffic during large
parts of the day and other factors that are present in these areas, which can lead to RTA.29-32
In this study, we found a high increase of crashes in places with bicycle lanes. This behavior
is similar to that found in a study in Australia, in which road accidents were 5.3 times more
frequent in streets with bicycles lanes.33 Besides that, the result indicated that bicycles lanes
were more beneficial where traffic lanes are narrower. However, our study cannot establish
an analysis controlled between risk to bicycle lanes and other variables like the size of the
lane, the speed limit of cars in the street, and exclusive bicycle lanes.
Considering the high density of RTA that we observed in the stretch of the Pan-American
Highway crossing the city, the high volume of vehicular traffic, including cargo vehicles like
trucks and vans, can influence the rates of crashes.34 The Sustainable Development Goals
want to mobilize financing and support to the governments with specific actions to reduce mortality
and injuries to RTA and implementation of measures to guarantee road safety before 2030 leaving
no one behind.35 In countries where these strategies are being implemented, despite using
different strategies depending on the particular characteristics of each country, the rates of
accidents are decreasing.19 Our spatial analysis using GIS allowed us to visualize the occur-
rence of road accidents in a simple yet impactful way, serving as a useful tool to aid in devel-
oping urban and health policies.15,36-39 The occurrence of crashes in areas of high density
could be prevented by implementing improved road signaling, traffic management, and
repair of damaged roads.19 Despite limited resources, LMIC like Nicaragua’s should con-
sider including effective administration of urban population growth and public transporta-
tion in public policies, prioritizing use of alternate routes during periods of heavy vehicu-
lar and pedestrian traffic.
One of the limitations of this study concerns the temporality of events, given that the
measurement of environmental variables occurred sometime after the RTA. However,
10
REV BRAS EPIDEMIOL 2021; 24: E210003Predictors and geographic analysis of road traffic accidents in Leon, Nicaragua
data allowed us to identify potential environmental hazards on which the local govern-
ment can intervene to prevent crashes in the future. Nine percent of the records of acci-
dents were incomplete and could not be geo-referenced, which precluded spatial analy-
sis of all then. This could induce bias if these road accidents with missing geographical
data tended to be concentrated in a location. We were unable to consider the density of
crashes with respect to the number of vehicles on the road or people living in the sur-
rounding neighborhoods due to lack of municipal data of this type. Furthermore, the
quality of information collected from police records must be considered, as the data is
based on subjective observations made by officers who were present at the time of the
RTA, and in the records of health conditions of people involved in accidents. However,
the National Police maintains the records of all accidents reported by the population, and
officers are trained in traffic law and appropriate documentation of the circumstances.
Finally, the National Police Office should be generating constant reports about the status
of all road accidents and integrating other key actors like the Ministry of Health and city
halls to have complete information about it.
In conclusion, we found that good road conditions and the use of highways or main roads
were associated with higher incidence of RTA. We identified three zones with a high density
of crashes where commercial, touristic, and educational activities are present. These results
should be considered by institutions involved in the administration of road conditions and
road safety to build strategies that promote the development of safe urban spaces with low
occurrence of injury or death due to RTA.
ACKNOWLEDGMENTS
We thank the police of León for their collaboration in allowing us to access the records
of traffic accidents. We also thank William Ugarte, Braulio Espinoza, Andrés Herrera, and
the staff of the CIDS for their ideas and contributions to this work. We thank Katherine
Saldaña, Carolina Flores, Modesto Herrera, and José Levi Salinas for their work in data col-
lection. Finally, we thank Nadja Vielot for translating this manuscript. Thanks to all.
REFERENCES
1. Global Burden of Disease Study 2017. Global, regional, 2. Foreman KJ, Marquez N, Dolgert A, Fukutaki K,
and national incidence, prevalence, and years lived with Fullman N, McGaughey M, et al. Forecasting life
disability for 354 Diseases and Injuries for 195 countries expectancy, years of life lost, and all-cause and cause-
and territories, 1990-2017: A systematic analysis for specific mortality for 250 causes of death: reference and
the Global Burden of Disease Study 2017. Lancet alternative scenarios for 2016–40 for 195 countries and
2018; 392(10159): 1789-858. https://doi.org/10.1016/ territories. Lancet 2018; 392(10159): 2052-90. https://
S0140-6736(18)32279-7 doi.org/10.1016/S0140-6736(18)31694-5
11
REV BRAS EPIDEMIOL 2021; 24: E210003TOVAL-RUIZ, C. ET AL.
3. World Health Organization (WHO). Global status 13. Kang Y, Cho N, Son S. Spatiotemporal characteristics
report on road safety 2018 [Internet]. WHO; 2019 [cited of elderly population’s traffic accidents in Seoul
2019 Oct 8]. Available from: https://www.who.int/ using space-time cube and space-time kernel density
violence_injury_prevention/road_safety_status/2018/en/ estimation. PLoS One 2018; 13(5): e0196845. https://
4. World Health Organization (WHO). Global status doi.org/10.1371/journal.pone.0196845
report on road safety 2015 [Internet]. WHO; 2018 14. Najar FGDQ, Pérez MGG, Lara YA. Determinación
[cited 2019 Oct 3]. Available from: https://apps.who. de los componentes entrópicos de la accidentalidad:
int/iris/bitstream/handle/10665/277370/WHO- el trinomio vehículo/usuario/camino en la metrópoli
NMH-NVI-18.20-eng.pdf ?ua=1 de Guadalajara, México. Rev Tecnura 2018; 22(55):
5. Nantulya V, Reich MR. The neglected epidemic: road 51-65. http://doi.org/10.14483/22487638.13245
traffic injuries in developing countries The Harvard 15. Hernández-Vásquez A, Azañedo D, Bendezú-Quispe
community has made this article openly available. The G, Pacheco-Mendoza J, Chaparro RM. Sistemas de
neglected epidemic: road traffic injuries in developing información geográfica: aplicación práctica para el
countries. BMJ [Internet] 2012 [cited 2019 Oct 8]; estudio de atropellos en el Cercado de Lima, Perú.
324(7346): 1139-41. Available from: https://www.ncbi. Rev Peru Med Exp Salud Publica 2016; 33(4): 725-31.
nlm.nih.gov/pmc/articles/PMC1123095/https://doi. http://doi.org/10.17843/rpmesp.2016.334.2558
org/10.1136%2Fbmj.324.7346.1139 16. Yalcin G, Duzgun HS. Spatial analysis of two-wheeled vehicles
6. Borges G, Monteiro M, Cherpitel CJ, Orozco R, Ye Y, traffic crashes: Osmaniye in Turkey. KSCE J Civ Eng 2015;
Poznyak V, et al. Alcohol and Road Traffic Injuries in 19(7): 2225-32. https://doi.org/10.1007/s12205-015-0661-0
Latin America and the Caribbean: A Case-Crossover 17. Hernández-Hernández V, León LDH-D. La Relación entre
Study. Alcohol Clin Exp Res 2017; 41(10): 1731-7. la centralidad urbana y los atropellamientos en la ciudad
https://doi.org/10.1111/acer.13467 de Juárez, México. Hacia Promoc Salud 2014; 19(2): 81-94.
7. Instituto Nacional de Información de Desarrollo 18. Bonfim CV do, Silva AGS da, Araújo WM de, Alencar
(INIDE). Anuario Estadístico 2010 [Internet]. Instituto C, Furtado, Alencar BM. Análisis de la distribución
Nacional de Información de Desarrollo; 2010 [cited espacial de los accidentes de transporte terrestre
2019 Oct 7]. Available from: https://www.inide. atendidos por el Servicio Móvil de Urgencia (SAMU-
gob.ni/docs/bibliovirtual/Anuarios/ANUARIO10/ 192), en un municipio de la región nordeste de Brasil.
Anuario2010.pdf Salud Colect [Internet]. 2018 [cited on 2019 Sept 11];
8. Instituto Nacional de Información de Desarrollo 14(1): 65-75. Available from: http://revistas.unla.edu.
(INIDE). Anuario Estadístico 2017 [Internet]. Nicaragua: ar/saludcolectiva/article/view/1211/pdf. https://
Instituto Nacional de Información de Desarrollo; 2019. doi.org/10.18294/sc.2018.1211
Available from: http://www.inide.gob.ni/Anuarios/ 19. Ma F, Li X, Sun Q, Liu F, Wang W, Bai L. Regional
Anuario2017.pdf differences and spatial aggregation of sustainable
9. Malin F, Norros I, Innamaa S. Accident risk of road and transport efficiency: A case study of China. Sustain
weather conditions on different road types. Accid Anal Prev 2018; 10(7): 2399. https://doi.org/10.3390/su10072399
2019; 122: 181-8. https://doi.org/10.1016/j.aap.2018.10.014 20. Erdogan S. Explorative spatial analysis of traffic accident
10. Instituto Nacional de Desarrollo (INIDE). Censo statistics and road mortality among the provinces
Económico Urbano CEU 2010 León, resultados of Turkey. J Safety Res [Internet]. 2009 [cited 2019
departamento de León [Internet]. Nicaragua: Instituto Oct 3]; 40(5): 341-51. Available from: http://www.
Nacional de Información de Desarrollo; 2012 [cited ncbi.nlm.nih.gov/pubmed/19932314. https://doi.
on 2020 Oct 21]. 71 p. Available from: https://www. org/10.1016/j.jsr.2009.07.006
inide.gob.ni/docs/CensoEconomico/InformesDept/ 21. Soltani A, Askari S. Exploring spatial autocorrelation
ceu2010Leon/informeLeon.pdf of traffic crashes based on severity. Injury 2017; 48(3):
11. Ahmadi M, Valinejadi A, Goodarzi A, Safari A, Hemmat 637-47. https://doi.org/10.1016/j.injury.2017.01.032
M, Askari Majdabadi H, et al. Geographic Information 22. Gundogdu IB. Applying linear analysis methods
System (GIS) capabilities in traffic accident information to GIS-supported procedures for preventing traffic
management: a qualitative approach. Electron Physician accidents: Case study of Konya. Saf Sci 2010; 48(6):
2017; 9(6): 4533-40. https://doi.org/10.19082/4533 763-9. https://doi.org/10.1016/j.ssci.2010.02.016
12. Huang Y, Wang X, Patton D. Examining spatial 23. Kang Y, Cho N, Son S. Spatiotemporal characteristics
relationships between crashes and the built of elderly population´s traffic accidents in Seoul
environment: A geographically weighted regression using space-time cube and space-time kernel density
approach. J Transp Geogr 2018; 69: 221-33. https:// estimation. PLoS One 2018; 13(5): e0196845. https://
doi.org/10.1016/j.jtrangeo.2018.04.027 doi.org/10.1371/journal.pone.0196845
12
REV BRAS EPIDEMIOL 2021; 24: E210003Predictors and geographic analysis of road traffic accidents in Leon, Nicaragua
24. Fotheringham AS, Brunsdon C, Charlton M. 33. Herrero-Fernández D. Desarrollo de un cuestionario
Quantitative geography: perspectives on spatial data breve para la medición del comportamiento arriesgado
analysis. Londres: Sage, 2000. en peatones adolescentes. Rev Colomb Psicol [Internet]
25. Prieto Curiel R, González Ramírez H, Bishop SR. A 2015 [cited on 2019 Sept 30]; 24(2): 271-84. Available from:
novel rare event approach to measure the randomness http://www.scielo.org.co/pdf/rcps/v24n2/v24n2a03.
and concentration of road accidents. PLoS One pdf. http://doi.org/10.15446/rcp.v24n2.43567
[Internet] 2018 [cited 2019 Aug 23]; 13(8): e0201890. 34. Koh PP, Wong YD, Chandrasekar P. Safety evaluation
Available from: https://doi.org/10.1371/journal. of pedestrian behaviour and violations at signalised
pone.0201890.g001. https://doi.org/10.1371/journal. pedestrian crossings. Saf Sci 2014; 70: 143-52. https://
pone.0201890 doi.org/10.1016/j.ssci.2014.05.010
26. Kashani AT, Shariat-Mohaymany A, Ranjbari A. Analysis 35. Morrison CN, Thompson J, Kondo MC, Beck B.
of factors associated with traffic injury severity on On-road bicycle lane types, roadway characteristics,
rural roads in Iran. J Inj Violence Res 2012; 4(1): 36-41. and risks for bicycle crashes. Accid Anal Prev 2019;
https://doi.org/10.5249%2Fjivr.v4i1.67 123: 123-31. https://doi.org/10.1016/j.aap.2018.11.017
27. Lankarani KB, Heydari ST, Aghabeigi MR, Moafian 36. Blazquez CA, Picarte B, Calderón JF, Losada F. Spatial
G, Hoseinzadeh A, Vossoughi M. The impact of autocorrelation analysis of cargo trucks on highway
environmental factors on traffic accidents in Iran. J Inj crashes in Chile. Accid Anal Prev 2018; 120: 195-210.
Violence Res 2014; 6(2): 64-71. https://doi.org/10.5249/ https://doi.org/10.1016/j.aap.2018.08.022
jivr.v6i2.318 37. Naciones Unidas. Infraestructura - Desarrollo
28. Moreira JS, León CC, Zambrano GR, Joel Julio CM. Sostenible [Internet]. Naciones Unidas [cited on
Parámetros que influyen en el congestionamiento 2019 Sep 11]. Available from: https://www.un.org/
vehicular. Int J Innov Appl Stud 2018; 24(4): 1440-55. sustainabledevelopment/es/infrastructure/
29. Carro-Pérez EH, Ampudia-Rueda A. Conductas de 38. Jia R, Khadka A, Kim I. Traffic crash analysis with
riesgo al conducir un automóvil en zonas urbanas point-of-interest spatial clustering [Internet]. Accid Anal
del sur de Tamaulipas y la Ciudad de México. Cienc Prev 2018 [cited 2019 Aug 23]; 121: 223-30. Available
UAT 2019; 13(2): 100-12. https://doi.org/10.29059/ from: https://doi.org/10.1016/j.aap.2018.09.018
cienciauat.v13i2.988 39. Loyola E, Castillo-Salgado C, Nájera-Aguilar P, Vidaurre
30. Vanerio P, Trostchansky J, Machado F, Barrios G. M, Mujica O, Martínez-Piedra R. Los sistemas de
Impacto de la ley uruguaya de seguridad vial en la información geográfica como herramienta para
mortalidad por siniestros de tránsito. Rev Medica del monitorear las desigualdades de salud. Rev Panam
Uruguay 2018; 34(3): 45-61. http://doi.org/10.29193/ Salud Publica 2002; 12(6): 415-28.
rmu.34.3.4
31. Narváez YV, Parra Sierra V, Peña Cárdenas F, Ruíz Received on: 02/05/2020
Ramos L, Zamorano González B, Vargas Martínez Revised on: 08/01/2020
JI, et al. Road risk behaviors: Pedestrian experiences. Accepted on: 08/04/2020
Traffic Inj Prev 2019; 20(3): 303-7. https://doi.org/1
0.1080/15389588.2019.1573318 Authors’ contributions: Christian Toval-Ruiz:
32. G a l l a rd o VA , M u ñ ó z M P. E l p e a t ó n e n l a conceptualization, data curation, formal analysis,
vía pública [Social Communication Deg ree] methodology, writing — original draft, writing —
[Internet]. Santiago, Chile: Universidad Finis review & editing. Carlos Rojas-Roque: methodology,
Ter r ae; 2019 [cited on 2020 June 21]. 47 p. formal analysis, writing — review & editing. Akram
Available from: http://repositorio.uft.cl/xmlui/ Hernádez-Vásquez: conceptualization, methodology,
handle/20.500.12254/1507?show=full supervision, writing — review & editing.
© 2020 Associação Brasileira de Saúde Coletiva
This is an open access article distributed under the terms of the Creative Commons license.
13
REV BRAS EPIDEMIOL 2021; 24: E210003You can also read


