A new facility for UAV testing in climate-controlled environments
←
→
Page content transcription
If your browser does not render page correctly, please read the page content below
A new facility for UAV testing in climate-controlled environments∗
                                 Matteo Scanavino1 , Andrea Vilardi2 and Giorgio Guglieri1

   Abstract— Environmental conditions have a great influence               rate than aeronautical products as they are not created equally
on aircraft performance. Thrust reduction with altitude and                and following a set of standards. The analysis of one hundred
temperature increase is a well known problem in the avia-                  and fifty two drone events [6] showed that UAVs are more
tion industry. For commercial multirotor (UAVs) a systematic
approach on performance varying environmental conditions is                likely to experience: i) in flight loss of control, ii) events
still an open research field. Many of the existing applications            during takeoff and cruise, and iii) equipment problems.
designed for UAVs (e.g. precision agriculture, delivery of in-             To improve UAV controllability, stability and safety in wind
struments or medical supplies) have not been fully exploited               conditions, a lot of researches have been performed in
by the market so far. This is due to the lack of existing                  the past years. As an example, a wind tunnel propeller
knowledge about flight under variable weather conditions. A
bias in the existing tests has been the non-reproducibility                characterization is reported in [7], providing a complete
of the same climatic conditions. In this paper a dedicated                 database of propeller performance usually installed on small
test facility for a systematic study on UAV performance in a               UAVs and model aircraft. Another cornerstone is the work
climate-controlled laboratory is presented: use cases as well as           performed at Nasa Ames Research Centre [8]: wind tunnel
technical challenges related to the particular environment are             tests were made to measure force and moments as well as
discussed. Preliminary tests on thrust performance at different
temperatures are reported to provide insight and highlight                 electrical power consumption as a function of wind speed
measurement complexities involved in harsh environmental                   and UAV attitude. Autopilot control laws and UAV stability
conditions. Ultimately, this work will facilitate the development          are definitely affected by wind but other weather conditions
of UAV design and safety accounting for weather influence to               could lead to an in flight loss of control. For this reason,
improve flight stability and controllability.                              the impact of environmental parameters on drone flights is
                    I. INTRODUCTION                                        a major topic in UAV science and will be the focus of
   Since last decade Unmanned Aerial Vehicles (UAVs),                      DronEx project [9] by Eurac Research. Many of the existing
known also as drones, have become popular for commercial                   applications designed for UAVs have not been fully exploited
operations thanks to their flexibility and technology improve-             by the market so far. This is due to the lack of existing
ments. New advanced autopilot flight modes have allowed                    knowledge about flight under variable weather conditions. A
thousand of applications and extended market opportunities.                bias in the existing tests has been the non-reproducibility of
Environmental monitoring [1], surveillance [2], cinematog-                 the same climatic conditions.
raphy [3], search and rescue [4], urban monitoring [5] as                     This paper presents a new test facility to study UAV
well as emergency missions are just few examples in which                  performance in a dedicated climate-controlled laboratory,
UAVs are involved: the list of practical applications is wide,             improving vehicle design and safety. This paper is structured
well beyond the boundaries of conventional remote sensing                  as follows. Section II provides an overview of the world cli-
scenarios.                                                                 matic facilities for industrial tests, presenting characteristics
   To set-up and perform an automatic or full autonomous                   and main limitations for UAV testing. The new terraXcube
flight mission, a smart-phone, working as ground station and               facility is presented in section III, discussing use cases for
receiver, and the UAV itself are the only hardware required.               UAV testing, the experimental set-up as well as the atmo-
Commercial Off The Shelf (COTS) components are heavily                     sphere considered. Preliminary temperature test at constant
used by drone industry for the on-board avionics. As a                     pressure are presented in section IV while brief conclusions
consequence of price reduction, people having access to UAV                and future works are summarized in section V.
technology is rapidly increasing and potential air accidents or                      II. ENVIRONMENTAL FACILITIES
incidents are more frequent. As reported in [6], technology
issues are the key contributor in UAV events, contrary to                    Environmental tests on industrial components allow man-
commercial air transportation industry, where human factors                ufacturers to make sure their products will endure the coldest
are more relevant. COTS parts usually have higher failure                  winter and harshest sun. The automotive industry is a leading
                                                                           sector for environmental testing as many resources are spent
  *This work is supported by Eurac Research                                to perform detailed thermal analysis. Table I summarises
  1 M.  Scanavino is with the Department of Mechanical and Aerospace       word-wide environmental laboratories and points out re-
Engineering, Politecnico di Torino, C.so Duca degli Abruzzi 24, 10129
Torino, Italy, Corresponding author (e-mail: matteo.scanavino@polito.it)   search applications: automotive and aerospace sectors as
  2 A. Vilardi is with terraXcube, Eurac Research, Via Ipazia 2, 39100
                                                                           well as medical testing are the main reasons that justify the
Bolzano, Italy                                                             construction of such facilities.
  1 G. Guglieri is with the Department of Mechanical and Aerospace
Engineering, Politecnico di Torino, C.so Duca degli Abruzzi 24, 10129        The UAV industry has recently started to perform envi-
Torino, Italy                                                              ronmental test and provide information to the end users. As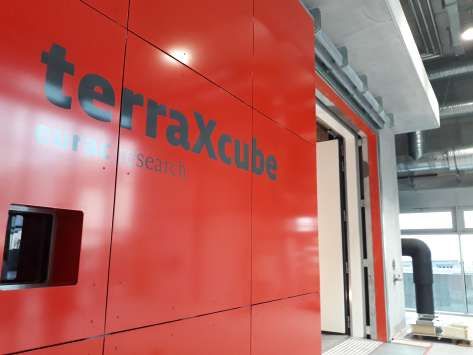
Test Facility             Country       Applications
  FCA climatic                            Road vehicle design
                                                                        allows the manipulation of inflow and boundary conditions
                              Italy                                     to reproduce wind dynamics.
  wind tunnel                             and development
  Mars Simulation
                                          Martian atmospheric and          In April 2015 WindEEE Dome was involved to test UAV
                            Denmark       UV condition simulations.
  Laboratory
                                          Sand transport studies
                                                                        flights in severe wind conditions, even tough a systematic
  Indoor Climate and                      Influence of indoor climate   study was not launched by the research institute. The effects
                            Denmark
  Building Physics                        on public health              of vortexes on flight stability were considered in the context
  TNO Climatic                            Road vehicle design           of cities, as complex environments for drones in windy days.
                          Netherlands
  Altitude Chamber                        and deveolpment
  MIRA Climatic             United                                      During the tests UAVs were manually controlled in hover
                                          Road vehicle design
  Wind Tunnels              Kingdom                                     conditions (pilot-in-the-loop tests). Up to 6 fans allowed to
                                          Large components,             create a destabilizing flow and a safety cable prevent the
  Lindoe Component
                            Denmark       structures and functional
  and Structure Testing
                                          systems test                  multi-copter loss of control to damage the chamber.
  Artificial Climate                      Environmental transfert          WindEEE Dome facility meets the need to perform UAV
                             Japan
  Experimental Facility                   simulation and modelling      tests in controlled wind conditions; the inability to consider
                                          Wind engineering,
  WindEEE                   Canada
                                          energy and environment
                                                                        pressure, temperature and other environmental parameters is
  ACE Climatic                                                          the main limitation of this laboratory.
                            Canada        Industrial climatic test
  Wind Tunnel
  General Motors                          Road vehicle design           B. ACE Climatic Wind Tunnel
                          United States
  Wind Tunnel                             and development                  The Automotive Centre of Excellence (ACE) by Uni-
  Boeing Icing                            Airplane design
  Wind Tunnel
                          United States
                                          and development
                                                                        versity of Ontario Institute of Technology (UOIT) is a
  Modine                                  Climatic wind tunnel          research centre for automotive industrial tests in Canada.
                          United States
  Wind Tunnel                             large trucks and automotive   ACE Research Centre consists of four test chambers:
                                                                           • a climatic wind tunnel, for large vehicles;
            TABLE I: Environmental test facilities
                                                                           • a climatic chamber, for small vehicles;
                                                                           • a climatic four-poster shaker, to simulate drive surfaces

an example, in the Alta 8 flight manual [10], by Freefly                      and validate suspension and body durability;
                                                                           • a multi-axis shaker table, for structural durability, de-
System, a table reporting the maximum take-off weight as
a function of temperature and altitude is given. Data are                     tection of noise and vibration tests.
based on predictions, simple real test and successful user                 Table II summarizes the characteristics of ACE Climatic
operation feedback beyond conventional weather conditions.              Wind Tunnel: this laboratory is suitable for automotive tests
In 2016 PrecisionHawk performed climate-controlled flight               in extreme environment, with particular regard to alternative
test to analyse fixed wing performance for design purposes              fuel, hybrid and electric vehicles.
[11]. These first steps reveal interest in a more systematic
approach to quantify performance according to weather con-
ditions. Flight tests in a climate-controlled facility would give
potential to improve UAV operations.
   In the past automotive facilities were exploited giving
potential to perform flight test inside a wide-temperature-
controlled area. No standards for UAV testing were de-
fined and activities were limited to the effect of wind and
temperature. Pressure influence on rotor and overall UAV
performance still remain unexplored due to lacks of ded-
icated hypobaric infrastructures. Automotive climatic wind
tunnels are not suitable for these purposes as not designed
for low pressure conditions; hypobaric medical facilities do
not provide a wide area for flight tests. In the next few years,                   Fig. 1: PrecisionHawk test inside ACE
dedicated environmental facilities will play a key role for
UAV industry development.                                                  In 2016, UAV tests (figure 1) were performed by Preci-
                                                                        sionHawk at low temperature (i.e. icing of quadcopters), in
A. WindEEE Research Institute                                           snow conditions and with multi-axis shaker table. Free flight
  The Wind Engineering, Energy and Evironment Research                  tests were made inside the climatic chamber using a fixed
Institute (Ontario, Canada) was establish in 2011 and offers a          wing tethered plane with a safety cable and manual control
unique testing chamber for wind studies and innovation. Re-             by a pilot engineer.
search topics are related to the impact of wind system (such               ACE Research Centre is an interesting reference facility
as tornadoes and downbursts) on buildings and structures;               that takes into account wind tunnel, temperature and shaker
optimisation of wind turbines and air quality studies (outdoor          tests; the effect of low pressure (flight at high altitude) still
and indoor) are other research fields. The WindEEE Dome is              remains an open question, not covered by this industrial
an hexagonal wind tunnel (25 m is the inner diameter) that              laboratory.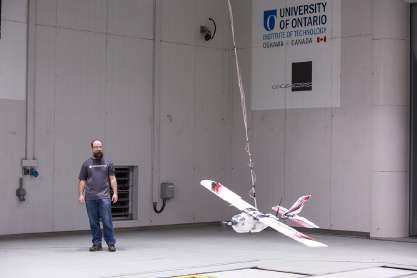
ACE Climatic WInd Tunnel
Overall dimensions
A. Use cases
20.1 m x 13.5 m x 7.5 m
(L x W x H)
To exploit the capabilities of terraXcube simulator in UAV
Temperature from −40°C to +60°C
Relative Humidity from 10% to 95% science, four use cases were defined to understand weather
Wind Speed up to 260 km/h influence on drones.
Rain Simulation System available, frontal layout In the first scenario the propulsion system will be char-
Snow Simulation System available, frontal and overhead layout
full diurnal function with azimuth and
acterized varying environmental parameters. A propeller, a
Solar Simulation System brushless motor and its related electronics (Electronic Speed
altitude
Controller) will be installed inside the Large Cube in a dedi-
TABLE II: ACE Climatic Wind Tunnel specifications
cated test bench. The sensor suite will include a six-axes load
cell, a speed sensor and a power-meter to measure thrust,
III. TERRA X CUBE SIMULATOR torque, motor speed and power consumption respectively.
A dedicated power supply, installed in the control room,
terraXcube [12] is a new research infrastructure opened will provide electric power to the motor highlighting the
in November 2018 in Bolzano, Italy. The facility allows environmental effects on the propulsion system only. Test
simulation of the Earth’s most extreme climatic conditions to on the single rotor will allow investigation of secondary
study their influence on human beings, ecological processes effects related to the motor heat exchange and power losses if
and new technologies. terraXcube consists of two climatic heat is not shed properly. Thermal studies of electric motors
chambers: i) the Large Cube and ii) the Small Cube. Table are usually performed with finite element methods [29] or
III summarizes the characteristics of the Large Cube. This lumped-parameter network analysis [30]. Two difficulties
laboratory is suitable for industrial test: a wide test section arise: i) motor geometrical data are often not available from
is available and suitable for free flight UAV purposes. The the manufacturer to the end user (i.e. stator tooth and joke
Small Cube consists of four independent simulation cham- dimensions) and, ii) thermal coefficient, related to material
bers that can independently replicate different atmospheres properties, are difficult to estimate (i.e. high turbulent airflow
at the same time. inside the motor case). Accurate modelling is challenging
terraXcube was built for medical research however, a
and experimental measurements will be exploited to un-
dedicated UAV programme (DronEx [9]) was launched to
derstand how motor performance will be affected by the
study in a systematic way how weather conditions affect
environmental conditions.
drone flight.
In the second scenario, an overall UAV will be mounted
terraXCube - Large Cube in the test bench. While in the first use case attention
Dimensions
12 m x 6 m x 5 m
will be given to the thrust produced by the single rotor,
(LxWxH) this scenario focuses on the complete UAV performance.
Temperature from −40 °C to 60 °C
Pressure from sea level up to 9000 m Thrust, torque, motor speed and power will be measured and
Relative Humidity from 10% to 95% analysed. Electric power will be provided using a dedicated
Wind Speed available, up to 100 km/h power supply to avoid environmental effect on batteries. The
Rain available, 0 − 60l/m2
total thrust generated by the overall UAV platform will be
Snow overhead layout, 5 cm in 1 hour
Solar Simulation System day/night simulation at 1000 lux measured without any oversimplification related to single
rotor thrust generation as suggested in [13] and [14].
TABLE III: terraXcube large simulator features The third use case will be dedicated to battery tests.
Discharge battery performance will be evaluated at different
temperature and humidity conditions. Useful information on
chemical to electrical power conversion of common batteries
will be studied and compared with available data [15].
In the last scenario, free flight test inside terraXcube will
be scheduled to check stability, controllability and autopilot
behaviour in harsh environments. This is the most interesting
and challenging test as UAVs will operate as in real condi-
tions. Technical issues related to autonomous free flight tests
will be discussed in the next paragraph.
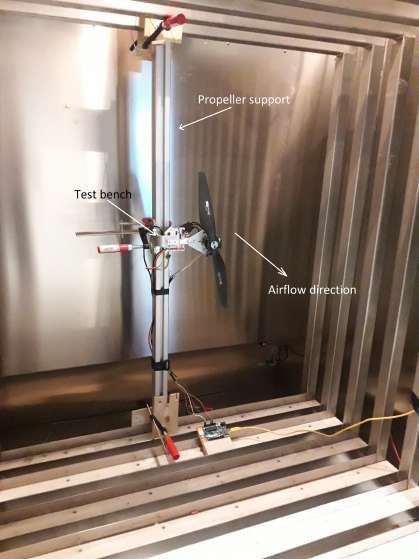
B. Experimental set-up and technical challenges
For use cases 1 and 2, the same set-up will be exploited
and it will consist of: i) a test bench designed to reduce
mechanical vibrations, ii) a six-axes load cell, for thrust
and torque measurements, iii) motor speed sensors, iv) a
Fig. 2: terraXcube laboratory power-meter (inclunding current sensors), and v) temperature
sensors for the motor and the electronic speed controller. A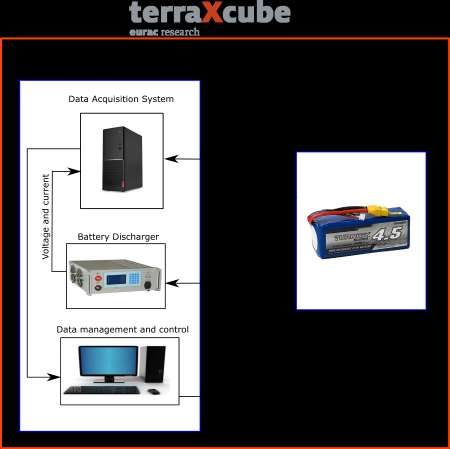
thermal camera will be used to measure motor winding tem-
perature. Figure 3 schematically shows the data acquisition
and control system, in accordance to the work performed by
Nasa Langley research centre [8]. Attention will be given
to avoid ground, wall and ceiling effect while performing
measurements. The results reported in [13] and [14] show
that ceiling effect is limited to value of z/R lower than 2;
ground effect occurs even for higher z/R when considering
the UAV as a whole. A test bench support will allow the
alignment of the rotor axis with the test chamber length in
order to perform test with high value of z/R.
   For use case 3, the Small Cube simulator will be used.
The battery will be placed inside the small test section while
a discharge device will be installed in the control room to
manage the maximum flow current during the discharging
process. Voltage and current sensors will be employed to
measure the desired data (figure 4).
   The main problem related to use case 4 is to allow
autonomous flight inside the Large Cube simulator, desirable                       Fig. 4: Set-up for use case 3
to avoid pilot control and provide a standard test procedure.
As reported in [16] and in [17], the biggest challenge
in UAV indoor applications is the attenuation of Global
Navigation Satellite System (GNSS) signal induced by walls         limited by the need of fixed cameras looking at the onboard
and furniture (20-30 dB compared to outdoor). Severe multi-        marker. The fly-able area is restricted by the field of view of
path effects and signal reflections must be considered due         the cameras (both in range and altitude). A ground computer
to metallic panels used in the simulator housing. Different        is mandatory to perform all the computation and provide high
solutions have been investigated: i) optical systems, ii) ultra-   frequency data rates. Considering terraXcube, the camera
wide-band sensors iii) ultrasonic systems, and iv) extension       mount system would be affect by temperature changes and
of outdoor GPS signal.                                             the optical system calibration would be mandatory each time
                                                                   a new temperature is set. The high cost of optical tracking
                                                                   systems make them suitable only for control law tuning
                                                                   and development in indoor environment, out of the scope
                                                                   of DronEx project.
                                                                      Ultra-wide-band (UWB) is the main technology based on
                                                                   radio frequency sensors. The absolute position of a mo-
                                                                   bile emitter is estimated by measuring the Received Signal
                                                                   Strenght Indication (RSSI) and implementing triangulation
                                                                   algorithms. Thanks to short time pulse duration (10 ns typi-
                                                                   cal), centimetre level accuracy can be reached. An example
                                                                   of UWB indoor GPS is provided by Race Logic for the
                                                                   automotive industry [20]. The main drawback of RF sensor
                                                                   family is multi-path signal reflections that could cause severe
                                                                   GPS glitches resulting in dangerous unexpected movements.
                                                                      Ultrasonic sensors are another feasible solution to generate
                                                                   an indoor GPS signal. The overall system consists of a
                                                                   mobile emitter and several stationary anchors. The on-board
                                                                   beacon generates ultrasound pulses to stationary detectors:
                                                                   a central router collects all Time Of Flight (TOF) data
                                                                   and compute the position of the mobile beacon based on
                                                                   triangulation algorithms. A typical solution is provided by
            Fig. 3: Set-up for use cases 1 and 2                   Marvelmind Robotics [21]. A deep investigation and testing
                                                                   activities were carried out on Marvelmind sensor [22]. Re-
  Optical systems (i.e. Vicon [18] or Optitrack [19]) provide      sults didn’t show good position accuracy and stable flight for
sub-millimetre precision for indoor GPS purposes. They             quad-copter autonomous navigation. The main problem of
require the installation of a reflective marker and a dedicated    ultrasonic sensors is they are affected by environmental con-
on-board computer to convert geometrical position data into        ditions (temperature and humidity especially). TOF requires
conventional GPS data (i.e. NMEA). The system flexibility is       a precise knowledge of the speed of sounds, that would be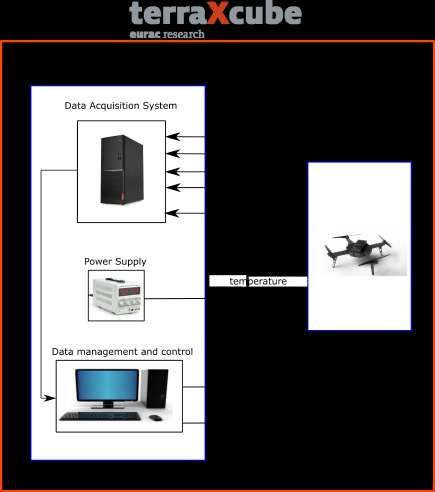
Weather      Altitude                   Tempetature [°C]
influenced by the simulated environment.                                station       [m]      Winter   Spring Summer         Autumn    ISA
   Extending the outdoor GPS signal inside terraXcube                Torino           249       4.72     13.91      23.33       13.77   13.38
                                                                     Borgone          400       3.21     12.11      21.64       11.94   12.40
would a suitable option as it prevent changes in the naviga-         Salbertrand     1010       1.07      8.33      16.92       8.84     8.44
tion system and would allow testing as in real outdoor sce-          Forno Alpi
                                                                                     1215       0.80     7.11      15.43       8.31     7.10
                                                                     Graie
nario. An example is reported in [24]: a set of GPS repeaters        Chiaves         1617      0.91     5.73       14.34      7.52      4.49
are placed on the roof of the building and provide signal            Malciaussia     1805      -0.30    4.34       13.14      6.38      3.27
                                                                     Sestriere       2020      -2.04    2.31       11.99      4.86      1.87
inside the infrastructure. By knowing the GPS pseudorange            Lago Agnel      2304      -3.20    0.91       10.28      3.88      0.02
and the absolute position of the repeaters, the computation of       Sommeiller      2981      -6.75    -3.48       5.63      -0.23     -4.38
                                                                     Gran Vaudala    3272      -9.28    -6.11       3.00      -2.67     -6.27
the absolute mobile receiver inside the building can be done.
The GPS repeater consist of a Low Noise Amplifier (LNA)             TABLE IV: Measured and ISA estimated temperatures at
to re-irradiate the GPS signal inside the building. Problems        various altitude [26]
related to this solution are: i) multi-path reflections, ii) time
synchronization and iii) extremely low accuracy (the same
for outdoor application, not suitable for indoor flight).           seasons that mostly differ from ISA model as shown in figure
   Other industrial solutions will be investigated before free      5, especially at low altitude. Autumn and Spring data best fit
flight test execution. A vision based solution could be a good      the temperature predicted by ISA. To take in mind seasonal
balance between complexity, cost and navigation system              temperature effects with respect to ISA model, the following
integrity.                                                          corrections will be applied: i) a constant offset of 9.5°C
                                                                    will be added to ISA temperature for Summer and, ii) a
C. Simulated atmospheres                                            linear altitude correction will be applied to simulate Winter
   Four atmospheres will be simulated for use cases 1,2 and         according to eq. 2. Spring and Autumn will be approximated
4: i) temperature changes at constant pressure and humidity         using ISA model as the difference between real data ISA
(from −40°C to +60°C, 20°C step), ii) pressure changes              temperatures is within 5°C.
at constant temperature and humidity (from sea level up to
4000 m, 500 m step, and from 4000 m to 9000 m, 1000 m                               Twinter (h) = TISA − (T0 + ah)                         (2)
step), iii) combined effect of temperature and humidity and         where a = −0.0025°C/m and T0 = 9.19°C.
iv) combined effect of temperature and pressure based on               The same approach was used to obtain relative humidity
the International Standard Atmosphere (ISA) model (from             data at different altitude as reported in figure 6. It can be
sea level to 3000 m, 500 m step). While the first two               noted a parabolic trend for Winter and Autumn seasons,
atmospheres focus on the isolated effect of temperature             while a quasi-constant behaviour during Spring and Summer.
and pressure (altitude), the last two highlight the combined        Based on the historical data, a linear equation model will be
effect of weather variables to study real scenario. The ISA         considered for humidity estimation with altitude for Winter
model is needed to provide a standard test condition, even          and Autumn seasons (eq. 3 and 4); constant humidity values
though seasonal effect and local specific atmospheres are not       of 67.4% and 70.5% will be used for Spring and Summer
considered.                                                         respectively.
   As temperature is the main responsible for battery per-
formance degradation [25], for use case 3 the atmosphere                            RHwinter (h) = b2 h2 + b1 h + b0                       (3)
simulated will be limited to the effect of temperature and its
combination with relative humidity.
                                                                                    RHautumn (h) = c2 h2 + c1 h + c0                       (4)
   Seasonal effects: The ISA model provides a standard
atmosphere for vehicle performance testing at various al-           where b2 = 3.01E − 6, b1 = −17.15E − 3, b0 = 85.31,
titude. Considering the troposphere, the assumptions made           c2 = 1.31E − 6, c1 = −8.63E − 3, c0 = 84.27.
by ISA model are: i) perfect gas, ii) constant air chemical            Compared to the international standard atmosphere, this
composition iii) dry air and, iv) constant temperature rate         is a first attempt for a detailed atmospheric model able to
with altitude [23]. The following simplified model results:         predict temperature, humidity and pressure closed to real data
                      T (h) = T0 − ∇T h                      (1)    taking in mind seasonal weather conditions.

where ∇T = 0.0065 [°C/m] and T0 = 15°C. This model                                     IV. TEST PERFORMED
is based on average conditions at mid latitudes, providing a           terraXcube simulator will be available in May 2019 for re-
good standard day for engineering computations.                     search activities. Preliminary tests were performed to analyse
   An analysis was made to highlight seasonal effect and in-        the effect of temperature on single rotor thrust generation
vestigate ISA error exploiting historical meteorological data       inside a smaller climatic chamber. Even tough tests were
(temperature and relative humidity) from weather stations in        performed in a smaller test cell, these data provide a trend
Piemonte, Italy, at different altitude [26].                        on rotor performance as well as the order of magnitude
   The mean temperature values between 2014 and 2016                of expected quantities. The T-Motor 15 x 5 carbon fibre
during Winter, Spirng, Summer and Autumn were calculated,           propeller with T-Motor T60A Electronic Speed Controller
as reported in table IV. Summer and winter are the two              and U5 kv400 brushless motor were used to perform all
60 seconds by the data acquisition system. The procedure
12
Winter
was repeated for temperatures in the range −33.5°C to
Spring +40°C; the same PWM signal for motor control was used
10 Summer
Autumn
for all the tests.
8
|T-T IS A |
6
4
2
0
0 500 1000 1500 2000 2500 3000 3500
Altitude [m]
Fig. 7: Climatic chamber dimensions
Fig. 5: Difference between experimental data and predicited
ISA temperatures at various altitude. Experimental data
(square markers) and interpolation models (dashed lines)
85
Winter
Spring
Summer
80 Autumn
75
RH [%]
70
65
Fig. 8: Experimental set-up
60 Results at different temperatures are shown in figures 10,
0 500 1000 1500 2000 2500 3000
Altitude [m]
11 and 12 as percentage change with respect to +15°C
considered as a reference standard condition.
Fig. 6: Humidity experimental data (square markers) and Figure 10 shows that as temperature decreases the pro-
interpolation models (dashed lines) peller thrust increases. This behaviour is related to the air
density changes due to temperature reduction at constant
pressure. The electrical power shows the same behaviour of
the measurements inside the Angelantoni PV4500 facility. the thrust: as a consequence of thrust increase, more power
The rotor assembly was mounted on a test bench platform is needed. The electric current behaves as power and was
(RCBenchmark 1520 [27]) inside the chamber as in figure not reported in the paper. A different trend is experienced
9. The motor was powered by a dedicated power supplier by the motor speed (figure 11) which decreases as lower
placed outside the test section. Thrust, motor speed, current temperature are set. Even though the overall percentage
and voltage were recorded using a computer in the control changes are quite small, the speed reduction is related to
room. Figures 7 and 8 show the experimental set-up used for air density increase as well. The electronic speed controller
the test and the overall dimensions. The climatic chamber (ESC) generates three alternating voltages from a constant
is quite small compared to terraXcube but the tests were DC voltage source. As any motor speed feedback is provided,
made to provide first insight on single rotor performance. the ESC works in an open loop configuration: the motor
The tests were performed in the following way: the operator speed is not adjusted as the motor load changes. As lower
set the temperature inside the chamber and wait for stationary temperatures are set, the air density increases as well as the
conditions. As a PWM signal was sent to the electronic speed propeller torque. Given the same PWM input signal to the
controller (ESC) the motor started spinning. When the motor ESC, the motor speed decreases in response to higher motor
reached stationary conditions, measurements were taken for load.5
Experimental data
4 Parabolic interpolation
3
2
Power %
1
0
-1
-2
-3
-4
-40 -30 -20 -10 0 10 20 30 40
Temperature [°C]
Fig. 12: Percentage change in power
Comparing figures 10, 11 and 12 it can be noted that while
a linear interpolation is sufficient for thrust data, a second
order polynomial regression model is needed to fit speed and
power measurements. Moreover, given the same temperature
change, the thrust increase is higher than the power. As an
example, at 0°C, thrust has experienced a mean increase of
Fig. 9: Climatic chamber during temperature test session 2.58% while the electric power increase is only 1.91%. This
is related to the motor speed that shows a reduction of 1.12%.
The overall power increases is dominated by torque increase
10 due to higher air density values, despite lower motor speed.
Experimental data
8 Linear interpolation Because of the small dimensions of the climatic chamber,
measurements were influenced by wall effect even though ef-
6
forts during the installation were made to prevent it. Ground
4 and ceiling effects are combined due to the small chamber
Thrust %
2
dimension. Considering the distances between the main door
and the wall surface upstream the propeller, the following
0
ratios can be evaluated: (z/R)G = 6.04 and (z/R)C = 0.78
-2 for ground and ceiling effect respectively. Propeller tip to
-4
wall distance ratio is (y/R) = 2.9. Despite thrust increase
reported in [13] and [14] for ground and ceiling effect
-6
-40 -30 -20 -10 0 10 20 30 40 respectively, lower thrust was experienced inside the test
Temperature [°C] section probably due to high turbulence. The set-up used in
Fig. 10: Percentage change in thrust test is different to those reported in [13] and [14] as ground,
ceiling and wall effect act simultaneously. A quasi-linear
behaviour of combined ground and ceiling rotor performance
2 is reported [28]: the propeller works as an impermeable
Experimental data
Parabolic interpolation
structure so that the downstream flow (dominated by ground
1
effect) is independent of the upstream conditions (dominated
0 by ceiling effect) and vice versa. Measurements for wall
effect, showing a negligible aerodynamic influence, are re-
Motor speed %
-1
ported in [28] but in this case the airflow is not affected by
-2
ground and ceiling. The comparison with the experimental
set-up in figure 8 is not direct: the authors in [28] do not
-3
consider the interaction between wall, ground and ceiling
-4
effects that would results in high turbulence inside a test
section. The high turbulence could leads to thrust reduction,
-5
-40 -30 -20 -10 0 10 20 30 40
as a consequence of vortex dimension increase. Despite
Temperature [°C] conventional ground and ceiling effect, inside the climatic
Fig. 11: Percentage change in motor speed chamber the downward flow is slowed and tries to disperse
radially. The presence of the test section provides additionalobstacles for the flow, enforcing the turbulence and resulting 25
in lower thrust. Figure 13 schematically shows the complex Measured thrust % change
Calculated air density % change
20
aerodynamic field in the chamber.
According to the Momentum Theory, the propeller thrust 15
in hover conditions (eq. 5) is proportional to the air density
ρ as well as the square inducted velocity vi2 . The thrust 10
%
changes should be directly related to air density variations 5
with temperature.
0
T = ρAvi2 (5) -5
Comparing air density (computed by temperature and
-10
pressure data) and thrust percentage changes (figure 14), -40 -30 -20 -10 0 10 20 30 40
Temperature [°C]
rotor thrust increase is lower than air density change. Thrust
measurements are affected by: i) thermal effect on load cell Fig. 14: Comparison between air density and thrust percent-
(non linearities and temperature changes on span; during age changes
the tests, a drift in thrust sensor zero was observed and
calibration was performed each time a new temperature was
set), ii) motor speed reduction, and iii) turbulence inside the inside the Large Cube will be defined while the first tests
climatic chamber. will be performed on isolated rotors and complete UAV in a
dedicated test bench.
The preliminary rotor tests performed inside a small
climatic chamber provides insight on temperature effect on
thrust and power consumptions. Results are affected by
turbulence and sensor accuracies but are in accordance with
expected trends on thrust and power while temperature is
changing. More realistic data will be collected as soon as ter-
raXcube will be full operational. Pressure (altitude) influence
multi-rotor performance as well as combined effect such as
temperature and pressure or temperature and humidity will
be considered. This comprehensive study is specific to multi-
rotors and will eventually lead to more advanced simulation
models for propulsion system and UAV performance in harsh
environmental conditions. Insight and suggestions for UAV
manufacturers and aviation agency for non standard flight
approval (e.g. search and rescue missions in avalanche or
mountains) will be the main results of DronEx project.
ACKNOWLEDGMENT
The authors would like to thank Eurac Research Institute
for Renewable Energy for the access to the facility Accel-
erated life testing lab, support and collaboration during test
activities.
R EFERENCES
[1] Elisabeth, S., & Hans, A. (2018). Monitoring height and greenness of
non-woody floodplain vegetation with UAV time series. ISPRS journal
of photogrammetry and remote sensing.
Fig. 13: Schematic airflow conditions in ground effect and [2] Andrade, F., Johansen, T. A., & Storvold, R. (2017). Autonomous
inside the climatic chamber UAV surveillance of a ships path with MPC for Maritime Situational
Awareness. In 2017 International Conference on Unmanned Aircraft
Systems. Institute of Electrical and Electronics Engineers (IEEE).
[3] Mademlis, I., Mygdalis, V., Raptopoulou, C., Nikolaidis, N., Heise, N.,
V. CONCLUSIONS & FUTURE WORK Koch, T., & Metta, S. (2017). Overview of drone cinematography for
This paper aims to present a dedicated facility for UAV sports filming. In European Conference on Visual Media Production
(CVMP)(to be presented as short).
performance test in a climate-controlled environment. The [4] Silvagni, M., Tonoli, A., Zenerino, E., & Chiaberge, M. (2017).
experimental set-up and the related technical challenges due Multipurpose UAV for search and rescue operations in mountain
to harsh weather conditions are discussed. Several use cases avalanche events. Geomatics, Natural Hazards and Risk, 8(1), 18-33.
[5] Ham, Youngjib, et al. Visual monitoring of civil infrastructure systems
are defined in terms of equipments under tests and simulated via camera-equipped Unmanned Aerial Vehicles (UAVs): a review of
atmosphere. A suitable tracking system to perform flight test related works. Visualization in Engineering 4.1 (2016): 1.[6] Wild, Graham, John Murray, and Glenn Baxter. Exploring civil [23] Cavcar, Mustafa. The international standard atmosphere (ISA).
drone accidents and incidents to help prevent potential air disasters. Anadolu University, Turkey 30 (2000): 9.
Aerospace 3.3 (2016): 22. [24] Ozsoy, Kerem, Ayhan Bozkurt, and Ibrahim Tekin. Indoor positioning
[7] Brandt, John, and Michael Selig. Propeller performance data at low based on global positioning system signals. Microwave and Optical
reynolds numbers. 49th AIAA Aerospace Sciences Meeting including Technology Letters 55.5 (2013): 1091-1097.
the New Horizons Forum and Aerospace Exposition, 2011. [25] Hausmann, Austin, and Christopher Depcik. Expanding the Peukert
[8] Russell, Carl R., et al. Wind Tunnel and Hover Performance Test equation for battery capacity modeling through inclusion of a temper-
Results for Multicopter UAS Vehicles, 2016. ature dependency. Journal of Power Sources 235 (2013): 148-158.
[9] DronEx: Testing drones in extreme environmen- [26] ARPA Piemonte. Retrieved January, 2019, from
tal conditions. Retrieved January, 2019, from http://www.arpa.piemonte.it/
https://terraxcube.eurac.edu/projects/dronex/, ”Investimenti a favore [27] RCBenchmark 1520. Retrieved January, 2019, from
della crescita e dell’occupazione FESR 2014-2020 progetto DronEx” https://www.rcbenchmark.com/pages/series-1520
[10] Freefly Alta 8 Flight Manual. Retrieved January, 2019, from freefly- [28] Jardin, Thierry, Sebastien Prothin, and Cristian Garca Magaa. Aero-
systems.com/app/uploads dynamic Performance of a Hovering Microrotor in Confined Environ-
[11] PrecisionHawk explores extreme-weather testing of ment. Journal of the American Helicopter Society 62.2 (2017): 1-7.
drones at ACE. Retrived Jannuary, 2019, from [29] Kefalas, Themistoklis D., and Antonios G. Kladas. ”Thermal in-
https://news.uoit.ca/archives/2016/03/ace-research-partnership-with- vestigation of permanent-magnet synchronous motor for aerospace
uav-innovator-precisionhawk-explores-extreme-weather-testing-of- applications.” IEEE Transactions on industrial electronics 61.8 (2014):
drones.php 4404-4411.
[30] Dimolikas, Konstantinos, et al. ”Lumped-parameter network thermal
[12] terraXcube Eurach Research. Retrieved January, 2019, from
analysis of permanent magnet synchronous motor.” Materials Science
https://terraxcube.eurac.edu/
Forum. Vol. 792. Trans Tech Publications, 2014.
[13] Conyers, Stephen A., Matthew J. Rutherford, and Kimon P. Valavanis.
An Empirical Evaluation of Ground Effect for Small-Scale Rotorcraft.
2018 IEEE International Conference on Robotics and Automation
(ICRA). IEEE, 2018.
[14] Conyers, Stephen A., Matthew J. Rutherford, and Kimon P. Valava-
nis. An empirical evaluation of ceiling effect for small-scale rotor-
craft. 2018 International Conference on Unmanned Aircraft Systems
(ICUAS). IEEE, 2018.
[15] Barcellona, Simone, et al. ”Analysis of ageing effect on Li-polymer
batteries.” The Scientific World Journal 2015 (2015).
[16] Mautz, Rainer. Overview of current indoor positioning systems.
Geodezija ir kartografija 35.1 (2009): 18-22.
[17] Mainetti, Luca, Luigi Patrono, and Ilaria Sergi. A survey on indoor
positioning systems. Software, Telecommunications and Computer
Networks (SoftCOM), 2014 22nd International Conference on. IEEE,
2014.
[18] Vicon Motion Tracking System. Retrieved January, 2019, from
https://www.vicon.com/
[19] Optitrack Motion Capture System. Retrieved January, 2019, from
https://optitrack.com/
[20] Race Logic Indoor GPS module. Retrieved January, 2019, from
https://www.vboxautomotive.co.uk/index.php/it/products/telemetry-
systems/vbox-indoor-positioning-system
[21] Marvelmind Robotics. Retrieved January, 2019, from
https://marvelmind.com/
[22] Li, Y., Scanavino, M., Capello, E., Dabbene, F., Guglieri, G., & Vilardi,
A. (2018). A novel distributed architecture for UAV indoor navigation.
Transportation Research Procedia, 35, 13-22.You can also read