2019: New Zealand's 4th-warmest year on record - NIWA
←
→
Page content transcription
If your browser does not render page correctly, please read the page content below

New Zealand Climate Summary: 2019 Issued: 9 January 2020
2019: New Zealand’s 4th-warmest year on record
Temperature Annual temperatures were above average (+0.51°C to +1.20°C above the annual
average) across the majority of New Zealand. Pockets of well above average (>1.20°C
from average) temperatures were observed in the Bay of Plenty and Hawke’s Bay. Near
average (within -0.50°C to +0.50°C of average) temperatures occurred in parts of the
Wairarapa, the West Coast, Tasman, Nelson, Marlborough and coastal Canterbury. 2019
was the 4th-warmest year on record for New Zealand, based on NIWA’s seven-station
series which began in 1909.
Rainfall Yearly rainfall in 2019 was below normal (50-79% of normal) across Northland,
Auckland, the Bay of Plenty as well as parts of Waikato, Hawke’s Bay, the Wairarapa and
Marlborough. Conversely, rainfall was above normal (120-149% of normal) in western
Southland and parts of Westland. Rainfall was near normal (80-119% of normal) for the
remainder of New Zealand.
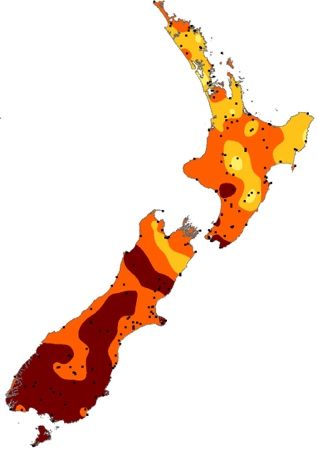
Soil moisture A dry and warm January led to the rapid depletion of soil moisture levels, which
continued throughout February with drier than normal soils present across much of the
country by the end of summer. Below normal soil moisture levels continued into autumn
for the North Island, while heavy rain during the end of March contributed to soils
becoming wetter for western parts of the South Island. By the end of winter, soil
moisture levels were near normal for most of the country. Soil in the North Island began
to dry out again during spring. At the end of spring 2019, soil moisture levels were below
normal for much of the upper and eastern North Island, along with scattered portions of
Tasman, Marlborough and Canterbury. Above normal soil moisture levels were observed
in the lower west coast of the North Island and in parts of Otago and Southland. As of 1
January 2020, soils were wetter than normal for the time of year across parts of
Southland, Otago, Nelson, Marlborough Sounds and Wellington. Soil moisture levels
were much lower than normal for the time of year in Northland, Auckland, northern
Waikato and eastern parts of Wairarapa.
Sunshine The wider Nelson region experienced New Zealand’s highest annual sunshine total
during 2019 (2859 hours recorded at Richmond).
Click on the following links to jump to the information you require:
Overview
The year in review
Temperature anomaly maps
Rainfall anomaly maps
Observations and statistics
Annual temperature
Annual rainfall
2019 climate in the six main centres
Significant weather and climate events in 2019
Overview
2019 was New Zealand’s 4th-warmest year on record. The nationwide average temperature for 2019,
calculated using stations in NIWA’s seven-station temperature series which began in 1909, was 13.37°C
1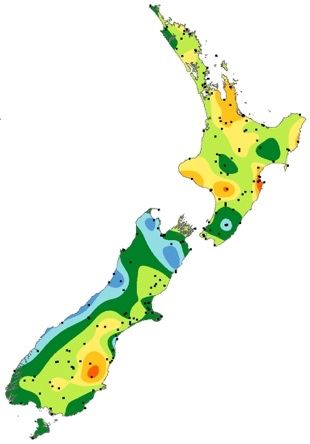
(0.76°C above the 1981–2010 annual average). 2016 remains NZ's hottest year on record which had a
nationwide average temperature of 13.45°C (0.84°C above the 1981–2010 annual average). The years 1998
and 2018 were tied at 2nd-equal (0.80°C above the 1981–2010 annual average).

The year began with New Zealand’s 3rd-warmest January on record. Widespread heatwave conditions took
hold during the end of the month with several locations experiencing their warmest January day on record.
The warmest temperature of 2019 was recorded on 31 January at Hanmer Forest. The high of 38.4°C
became New Zealand’s 18th-equal warmest temperature on record for all months (See Significant Weather
and Climate Events in 2019 for further details).

A central Pacific El Niño event (which persisted through to July) brought frequent bouts of high pressure
with widespread sunny and dry weather to start the year. By the end of February, Nelson observed a 40-day
dry spell1 which was the 4th-longest dry spell on record there (with records extending back to 1862), while
Tauranga and Hamilton had 36 consecutive dry days – their 3rd-longest dry spells on record (records began
in 1910 and 1935, respectively). The dryness contributed to multiple fires arising during February. Most
notably on 5 February, tinder-dry conditions in the Tasman District fuelled a large scrub fire in Pigeon Valley
near Wakefield. The fire doubled in size overnight, spreading to cover 1870 hectares within a perimeter of
20 km by 3 a.m. on 6 February. A Civil Defence State of Emergency was declared which lasted until 27
February. It was reportedly the largest aerial firefight in New Zealand's history, with 23 helicopters and two
planes used at the peak of the fire.

A key climate driver and contributor to NZ’s hot start to 2019 was the presence of above average sea
temperatures around our coastlines. Some coastal areas around Hawke’s Bay and Canterbury experienced
marine heatwave2 conditions for a time and marine heatwave conditions also persisted in the Tasman Sea
through to March. Warmer than average seas contribute to warmer than average temperatures on land but
can also provide extra energy for passing storms (all else being equal, increased surface fluxes of latent and
sensible heat can provide potential energy to storms). An example of this occurred on 25-27 March when a
mix of an ‘atmospheric river’3, extending from Australian cyclones, coupled with extra energy from the
Tasman Sea marine heatwave, as well as a strong low-pressure system siphoning moisture toward New
Zealand, brought extremely heavy rainfall to the western South Island. A State of Emergency was declared in
Westland and the Waiho River bridge on State Highway 6 was claimed by raging floodwaters. Between 25–
27 March, a New Zealand 48-hour rainfall record was set at the Hokitika catchment of the Cropp River which
recorded 1086 mm, or more than a metre of rain.

Warmth and dryness remained a theme into winter. It was NZ’s 4th-warmest autumn and 7th-warmest winter
on record. It was also the driest January to June on record for Auckland (321.2 mm, 62% of
normal), Hamilton (275.8 mm, 53% of normal), Whangārei (277.8 mm, 44% of normal), Whitianga (332.8
mm, 39% of normal), and Kaitaia (238.4 mm, 36% of normal). In Auckland, Watercare urged residents to use
water wisely at the start of July as water storage was 25% less than normal for the time of year. Snow events

1   A dry spell is defined as a period of 15 days or more with less than 1mm of rain on any one day.

2According to Australian research (Hobday et al., 2016), warm sea surface temperature events are considered marine heatwaves
(MHWs) if they last for five or more days with temperatures warmer than the 90th percentile based on a 30-year historical baseline
period.

3 Atmospheric rivers are relatively long, narrow corridors in the atmosphere that transport most of the water vapour outside of the
tropics. According to the American Meteorological Society, integrated vapour transport (from Earth’s surface to about 9000 m) must
be at least 250 kgm-1s-1 along the periphery of the moisture plume to be considered an atmospheric river.

                                                                    2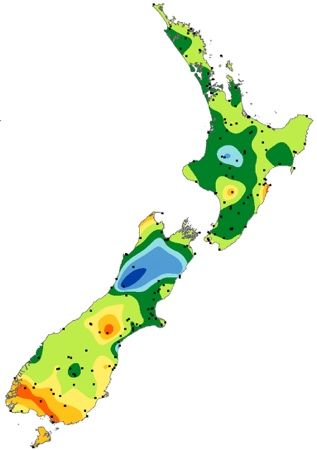
were infrequent during the winter season and instead the warm and settled weather during June and July
resulted in frequent fog events and disruptions at airports.

A strongly negative Southern Annular Mode4 at the start of August and stronger than normal polar and sub-
tropical jet streams fuelled a more active weather pattern to end winter. The cooler temperatures at the
end of winter and start of spring were also influenced by a rare major Sudden Stratospheric Warming (SSW)
event, which occurred in the polar stratosphere during late-August and peaked in mid-September (this was
the Southern Hemisphere’s strongest SSW on record and just the second major event on record). Despite
several sharp cold snaps, temperatures as a whole were near average for the time of year in September and
continued on the near average note in October, before prevailing northwesterlies in November brought
unseasonably warm temperatures and New Zealand’s warmest November on record.

Another key climate driver during spring 2019 was a strongly positive Indian Ocean Dipole (IOD) event in
October and November. The IOD’s hallmark is cooler than average sea surface temperatures in the eastern
Indian Ocean near Indonesia and warmer than average sea surface temperatures in the Arabian Sea. This
particular IOD event was of near-record strength and caused abnormally dry conditions across Indonesia
and Australia during the end of 2019 (and contributed to Australia’s dangerous fire conditions). For New
Zealand, it brought more westerly quarter winds than normal during spring, from cooler, drier
southwesterlies in October to warm, moist northwesterlies in November. The year ended on a cool and wet
note in the South Island. During the first eight days of December, a prolonged period of northwesterly
airflows over the country delivered persistent rainfall to the headwaters of the South Island lakes and rivers.
Lake Wanaka and Lake Wakatipu rose considerably, inundating lakeside roads, tracks and reserves.
Meanwhile a dry December for the upper North Island led to rapidly depleting soil moisture levels to start
the new decade.

Overall, annual mean sea level pressures for 2019 were slightly lower than normal over the South Island and
south of the country while higher than normal pressures occurred over the Tasman sea. This atmospheric
pressure pattern produced slightly more westerly wind flows than normal for the year. Frequent bouts of
high pressure contributed to a sunny year. The wider Nelson region experienced New Zealand’s highest
annual sunshine total during 20195 (2859 hours recorded at Nelson), followed by Marlborough (2799 hours -
Blenheim) and Hawke’s Bay (2709 hours – Napier).

Based on the seven-station series, 2019 featured six months with near average temperatures (within -0.50°C
to +0.50°C of average), six months with above average temperatures (greater than +0.50°C of average) and
no months with below average temperatures (less than -0.50°C of average). It has now been 35 months
since New Zealand has had a month with below average temperatures (since January 2017). Furthermore,
five of the past seven years have been amongst New Zealand’s hottest on record. This trend is consistent
with the overall pattern of global warming.

4 https://niwa.co.nz/climate/information-and-resources/southern-annular-mode
5 NIWA has had a regional sunshine ranking since 2017. This considers the differences between the data recorded by our new high
precision electronic sensors and the historic method of recording, using a Campbell Stokes sunshine instrument, which burns a trace
in a sun card. The regional sunshine ranking reflects the highest sunshine hours in local authority regions, except for Nelson which
has been extended to include the wider Nelson urban area (i.e. including Richmond).

The manual Campbell Stokes recorders are gradually being replaced, and the main table this year primarily contains data from
stations with electronic sensors. Three manual sites have been included – Tauranga, Wellington, and Christchurch. They have been
included only because they are main centres and there are no electronic sensors nearby. The comparison of data using the different
recorders is currently being assessed.

                                                                 3
Historical nation-wide annual temperature anomalies (degrees above or below the 1981-2010 normal) from NIWA’s
seven-station temperature series which begins in 1909. Five of the past seven years have been among New Zealand’s
warmest on record.

Section 1: The year in review
The monthly sequence of New Zealand climate was as follows:

January 2019: New Zealand’s 3rd-warmest January on record
It was New Zealand’s 3rd-warmest January on record. Temperatures were above average (0.51 to 1.20°C
above average) and well above average (>1.20°C above average) across the country. The only exceptions
were the coastal margins of Westland and western Southland where temperatures were near average (-0.50
to +0.50°C of average). Many locations observed record or near-record warm January temperatures. Rainfall
was below normal (50-79% of normal) or well below normal (1.20°C above
average) for much of New Zealand with areas of near average temperatures (-0.50 to +0.50°C of average) in
the eastern and lower North Island as well as the upper and western South Island. February rainfall was
below normal (50-79% of normal) or well below normal (149% of normal) rainfall was observed for parts of
Gisborne, coastal Southland, and north Canterbury (between Kaikōura and Waipara) while near normal
rainfall (80-119% of normal) was mostly restricted to the east coast of the North Island (south of Napier). At
the end of February, drier than normal soils were present across much the country. Severely dry soils were
present across Northland, Auckland, Bay of Plenty, Waikato and Manawatu-Whanganui and extremely dry

                                                       4
soils were present in the Taranaki, Tasman and Nelson regions. Meteorological drought conditions (as
defined by the NZ Drought Index) were present at the end of February in Nelson, Tasman and the Buller
District.

March 2019: New Zealand’s equal 2nd warmest March on record
It was New Zealand’s equal 2nd warmest March on record. Temperatures were above average (0.51°C to
1.20°C above average) or well above average (>1.20°C above average) across the entire country. Many
locations observed record or near-record warm March temperatures. Rainfall was below normal (50-79% of
normal) or well below normal (149% of normal) in the west and far north, while the
east and far south observed below to well below normal rainfall. By the end of March, drier than normal
soils were present across the majority of the North Island and a large portion of the South Island.
Conversely, soil moisture levels were slightly higher than normal in northern Marlborough and Tasman,
along with the West Coast, and parts of Otago. Meteorological drought conditions (as defined by the NZ
Drought Index) were present in Western Bay of Plenty as of 30 March.

April 2019: Wet and cool for inland parts of the South Island, variable elsewhere
Inland parts of Southland, Otago and Canterbury experienced below average (-0.51°C to -1.20°C of average)
temperatures. In contrast, areas along the west coast of the South Island experienced above average (0.51
to 1.20°C above average) temperatures. Temperatures were near average (-0.50 to +0.50°C of average) for
the majority of the North Island. Rainfall was above normal (120-149% of normal) or well above normal
(>149% of normal) for much of inland Otago, southern Westland, Canterbury, Marlborough Wellington,
Wairarapa and Taranaki. Rainfall was below normal (50-79% of normal) or well below normal (1.20°C above
average) across the entire country, with the most unusually warm temperatures in the South Island. Many
locations observed record or near-record warm May temperatures. Rainfall was below normal (50- 79% of
normal) or well below normal (149% of normal) for
much of the western and lower South Island. Near or below normal rainfall occurred in parts of
Marlborough, Canterbury, coastal Otago, and southern Southland. By the end of May, soils were drier than
normal for much of the North Island with small areas of wetter than normal soils about western Waitomo
and the Kapiti Coast. South Island soil moisture was generally near normal with pockets of below normal soil
moisture about Waimate and Waitaki as well as the interior Marlborough region.

June 2019: An unusually dry start to winter
Temperatures were near average (-0.50 to +0.50°C of average) for the majority of the North Island. A
portion of south Waikato observed below average temperatures (-0.51°C to -1.20°C of average) while
coastal southern Hawke’s Bay and interior Manawatu-Whanganui observed above average temperatures
(0.51°C to 1.20°C above average). Inland parts of Marlborough and Tasman along with northern Canterbury
                                                      5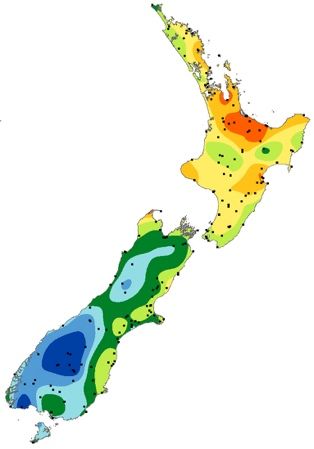
and West Coast experienced below average or well below temperatures (< -1.20°C below average).
Temperatures were above average or well above average (>1.20°C above average) in much of Southland,
coastal Otago, and a portion of interior Canterbury. Rainfall was below normal (50-79% of normal) or well
below normal (1.20°C above
average) nearly everywhere across New Zealand, with the most unusually warm temperatures in the interior
South Island and parts of Manawatu-Whanganui. Many locations observed record or near-record warm July
temperatures. Rainfall was above (120-149% of normal) or well above normal (>149% of normal) for the
majority of the South Island with the exception being a portion of eastern Southland and lower and interior
Otago where below normal rainfall (50-79% of normal) was observed. For the North Island, above or well
above normal rainfall was observed in central and southwestern areas while near normal (80-119% of
normal) or below normal rainfall was observed in the majority of the north and east. By the end of July, soil
moisture was near normal for most locations while a small area in lower coastal Canterbury and upper
coastal Otago observed below normal soil moisture.

August 2019: Variable temperature and rainfall patterns with frequent southwesterly winds
Temperatures were above average (0.51°C to 1.20°C above average) in parts of central Southland, north
Otago, Taranaki, Whanganui, southern Hawke’s Bay, Waikato and the Coromandel. Temperatures were
below average (-0.51°C to -1.20°C of average) in parts of the West Coast, Tasman, Marlborough and
Wairarapa. Rainfall was above normal (120-149% of normal) or well above normal (>149% of normal) for
western and southern parts of the South Island, as well as coastal North Otago, Manawatu-Whanganui,
central Waikato and Auckland. Rainfall was below normal (50-79% of normal) or well below normal (
were restricted to very small patches along the east coast of the South Island near Kaikōura, Christchurch
and Dunedin.

October 2019: Variable rainfall patterns; cool in the lower South Island
October temperatures were near average (-0.50 to +0.50°C of average) across nearly the entire North Island,
as well as much of the northern South Island and the West Coast. Isolated above average temperatures
(0.51°C to 1.20°C above average) were observed in Northland, the Coromandel Peninsula, Taranaki, Hawke’s
Bay, and northern Tasman. Meanwhile, widespread below average temperatures (-0.51°C to -1.20°C of
average) and isolated well below average temperatures (149% of normal) for many eastern coastal areas, including Northland, the Coromandel Peninsula,
Gisborne, Hawke’s Bay, southern Canterbury, Otago, and Southland. Conversely, below normal rainfall (50-
79% of normal) was observed in western Northland, parts of Auckland and Waikato, the Central Plateau,
and Marlborough. Elsewhere, generally near normal rainfall (80-119% of normal) was observed. By the end
of October, soil moisture was near normal across most of New Zealand. Soils were wetter than normal in
coastal Gisborne, much of Hawke’s Bay, as well as coastal Canterbury, Otago, and Southland. Meanwhile,
drier than normal soils were observed in western Northland, Wairarapa, Marlborough, and southern
Canterbury to interior Otago.

November 2019: Hottest November on record for New Zealand
Temperatures were well above average (>1.20°C above average) or above average (0.51°C to 1.20°C above
average) for most of the country. The exception was parts of Fiordland and the West Coast where
temperatures were near average (-0.50 to +0.50°C of average). Rainfall was above normal (120-149% of
normal) or well above normal (>149% of normal) in many western and southern parts of the South Island. In
contrast, rainfall was below normal (50-79% of normal) or well below normal rainfall ( 1.20°C above average) for Bay of Plenty, and parts of
Waikato and Hawke’s Bay. Temperatures were mostly above average (0.51°C to 1.20°C above average) for
remaining parts of the North Island. Below average (-0.51°C to -1.20°C of average) or well below average (>
1.20°C below average) temperatures were experienced in western and inland parts of Southland, Otago, and
many additional areas about the Southern Alps. It was a wet December for much of the South Island, with
well above normal rainfall (>149% of normal) in parts of every region. Rainfall was also well above normal in
Wellington, Kapiti Coast, northern Hawke’s Bay and Gisborne. Above normal rainfall (120-149% of normal)
was observed in parts of Taranaki, Manawatu and southeastern Waikato. Rainfall was below normal (50-
79% of normal) in Northland, Auckland, northern Waikato and Bay of Plenty, Coromandel, Wairarapa,
eastern parts of Central Otago, and coastal Canterbury north of Ashburton. By the end of December, soils
were wetter than normal for the time of year across parts of the Southland, Otago, Nelson, Marlborough
Sounds and Wellington. Soil moisture levels were much lower than normal for the time of year in Northland,
Auckland, northern Waikato and eastern parts of Wairarapa.

                                                      7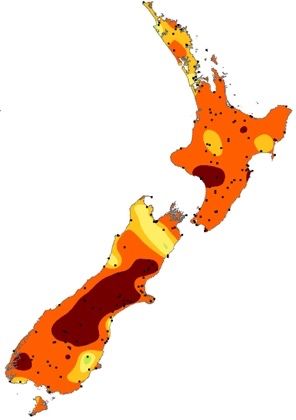
Section 2: Monthly temperature (in °C, as a departure from the 1981-2010 monthly
averages)

        January                February                March                   April                   May       June

          July                  August               September                October               November   December

Figure 1: Monthly temperature anomalies (compared to the 1981-2010 monthly averages) for each month of 2019.

                                                                               8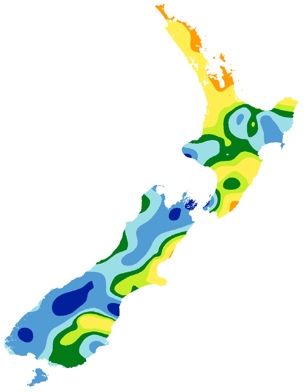
Section 3: Monthly rainfall (as a percentage of the 1981-2010 monthly normals)

        January                 February                 March                   April                  May        June

          July                  August                 September                October               November   December

Figure 2: Monthly rainfall as a percentage of each 1981-2010 monthly normal for each month of 2019.

                                                                                 9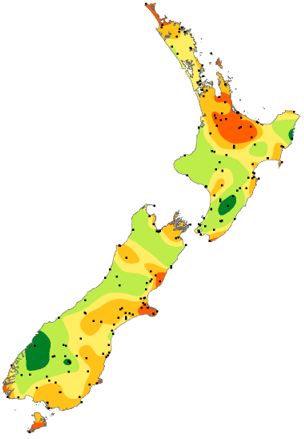
Section 4: Observations and statistics

Based on data available at the time of writing, NIWA analyses of month-by-month records show:

• The nationwide average temperature for 2019 was 13.37°C (0.76°C above the 1981–2010 annual
  average). Using NIWA’s seven-station temperature series, 2019 was the 4th-warmest year on record since
  records began in 1909.
• Whangārei recorded the highest annual average temperature for 2019 with 16.5°C, followed by
  Whangaparaoa (Auckland) with 16.4°C.
• The highest air temperature of the year was 38.4°C recorded at Hanmer Forest, followed by 37.9°C at
  Medbury and 37.8°C at Waiau, all of which occurred on 31 January.
• The lowest air temperature of the year was -9.2°C recorded at Lake Tekapo on 3 June, followed by -9.1°C
  at Hanmer Forest on 28 June, and -9.0°C at Tara Hills on 19 August.
• The top three daily rainfall totals from regularly reporting gauges in 2019 were 463 mm at Castle Mount
  on 25 March, 402 mm at Ivory Glacier on 2 December, and 401 mm at Milford Sound on 25 March.
• The top three daily rainfall totals from regularly reporting gauges in 2019 excluding high elevation
  stations were: 401 mm at Milford Sound on 25 March, 291 mm at Aoraki / Mt Cook Village on 26 March,
  and 226 mm at Rings Beach on 9 September.
• Of all the regularly reporting gauges, the wettest locations in 2019 were: Cropp River (West Coast, 975
  metres above sea level) with 14,227 mm, Tuke River (West Coast, 975 metres above sea level) with
  12,098 mm, and Doon River (Southland, 1211 metres above sea level) with 10,371 mm.
• Of the regularly reporting gauges, the wettest locations in 2019 excluding high elevation stations were:
  Milford Sound with 8,417 mm, Aoraki / Mt Cook with 5,546 mm, and Manapouri (West Arm Jetty) with
  5,135 mm.
• The lowest rainfall recording locations for 2019 were Clyde and Cromwell with 417 mm, Ranfurly with
  433 mm, and Windsor with 435 mm.
• The wider Nelson region experienced New Zealand’s highest annual sunshine total during 2019 (2859
  hours recorded at Nelson), followed by Marlborough (2799 hours - Blenheim) and Hawke’s Bay (2709
  hours – Napier).
• The highest confirmed wind gust for 2019 was 196km/h recorded at Cape Turnagain on 15 May.
• Of the six main centres in 2019, Tauranga was the warmest, Dunedin was the coolest, Wellington was the
  wettest, Christchurch was the driest, Auckland was the sunniest and Dunedin was the least sunny.

Ranked annual total rainfall, mean temperatures and sunshine hours for the stations available at time of
writing are displayed on the following six pages. Some sites have missing days of data. The number of
missing days is indicated by a superscript number next to the annual value in the tables below.

                                                     10
Rainfall MURCHISON MTNS EWS 3798 LOWER RETARUKE CWS 1489
Location
(mm) ALBERT BURN 3724 WAIPAPA AT WAITETI STATION 1486
CROPP AT WATERFALL 14227 AHURIRI AT CASSINIA MORAINE 3667 PUREORA FOREST CWS 1457
CROPP AT CROPP HUT 12541 HOKITIKA AERO 3517 RANGITAIKI AT ANIWHENUA 1444
TUKE AT TUKE HUT 12098 HOKITIKA AWS 34912 MT POTTS EWS 14111
DOON AT MIDDLE ARM 10371 MT COOK AERO AWS 32528 MANAPOURI AERO AWS 1405
HOKITIKA AT PRICES FLAT 9850 HOKITIKA EWS 3163 PURUKOHUKOHU AT NO 4 1398
HAAST AT CRON CK 9503 PUYSEGUR POINT AWS 302411 TAUMARUNUI EWS 13805
IVORY AT RIPPLEROCK 9458 WAITUTU CWS 2922 WAIMARINO AT KEPA RD 1369
IVORY GLACIER CWS 9457 UPPER RAKAIA EWS 2783 WELLINGTON, KELBURN 2 1367
HOKITIKA RAPID CK 8792 MAHANGA EWS 2724 TAUMARUNUI AWS 135512
MILFORD SOUND EWS 8417 MAKOTUKU AT F TRIG 2707 TURANGI 2 EWS 1345
HOKITIKA AT COLLIERS CK 8431 EGLINTON, KNOBS FLAT CWS 2692 TONGARIRO AT TURANGI 1345
GODLEY AT PANORAMA RIDGE 8040 MT RUAPEHU, CHATEAU EWS 2626 WHANGANUI AT BELOW PIRIAKA 1344
WAIHO AT DOUGLAS HUT 7956 GREYMOUTH AERO EWS 243213 WHITIANGA AERO AWS 13066
CASTLE MOUNT EWS 79512 WESTPORT EWS 2422 OHAKUNE EWS 1285
RAKAIA AT LAKE RAMSAY 7410 COBB AT TRILOBITE 2311 TROUNSON CWS 1260
GODLEY AT EADE HUT 6661 WAIPAOA AT MANGATU DIVIDE 2283 WELLINGTON, KELBURN AWS 12493
WHATAROA AT SHB 6608 REEFTON EWS 21831 INVERCARGILL AERO 12392
HAAST AT ROARING BILLY 61256 WESTPORT AERO AWS 21242 FAREWELL SPIT AWS 12386
MT PHILISTINE EWS 66096 NGAHERE AT NGAHERE HUT 2067 KERIKERI AERODROME AWS 12341
ARTHURS PASS AWS 588810 WHAKAPAPA AT MT RUAPEHU EWS 2053 WHITIANGA EWS 12321
MT COOK EWS 5546 TONGARIRO AT MANGATOETOE 1969 TE PUKE EWS 1230
ARTHURS PASS EWS 5516 MOTU EWS 19414 WHATAWHATA 2 EWS 1212
MURCHISON AT ROSE RIDGE 5377 STRATFORD EWS 18822 WAIOURU EWS 11982
MUELLER HUT EWS 53751 TAURANGA-TAUPO AT KIKO RD 1812 ROTORUA EWS 11941
TAIPO AT SHBR 5374 MOTU AT WAITANGIRUA 1785 HAWERA AWS 11877
MANAPOURI, WEST ARM JETTY EWS 5135 OTAMATUNA, TE MAPOU HUT CWS 1765 INVERCARGILL AERO 2 EWS 11841
PIGEON CREEK CWS 4873 NEW PLYMOUTH AWS 15572 INVERCARGILL AERO AWS 1170
HAAST AT MOA CK 4669 TAKAKA EWS 155113 WAIPAPA AT TTT RD CULVERT 1183
BUTCHERS CK AT BUTCHERS GULLY 4351 WHANGANUI AT TE PORERE 14987 KERIKERI EWS 1167
11MATUKITUKI AT WEST WANAKA 1153 WAIPARA N. BRANCH @ LANGS GULLY 990 METHVEN CWS 84210
HICKS BAY AWS 11427 QUEENSTOWN EWS 988 TAUPO AWS 8401
UPPER HUTT, TRENTHAM EWS 1125 WHAKAURU AT MOSSOP RD 983 WAIPOUNAMU CWS 838
MAHIA AWS 111511 NELSON AWS 9671 WHANGAREI AERO AWS 8372
PAHIATUA EWS 1115 PARAPARAUMU EWS 962 MATAMATA, HINUERA EWS 835
BIRCHWOOD WXT AWS 11014 POKAIWHENUA AT PUKETURUA 955 MANA ISLAND AWS 8302
LEVIN EWS 1101 MAYFIELD @ RUAPUNA 954 WANAKA CWS 805
FIVE RIVERS CWS 1079 GALATEA AWS 9465 GISBORNE AWS 7912
WAIROA AERO AWS 10666 AUCKLAND AERO 9421 TAURANGA AERO AWS 787
WAIOURU AIRSTRIP AWS 10621 LEVIN AWS 9423 TAKAPAU PLAINS AWS 7824
CAPE TURNAGAIN AWS 10557 APPLEBY 2 EWS 9416 BALMORAL EAST CWS 781
WELLINGTON, GRETA POINT CWS 1051 GORE EWS 9342 LEIGH 2 EWS 779
TAUPO CWS 10474 RICHMOND EWS 933 DIAMOND HARBOUR EWS 774
PUKEKOHE EWS 1036 TAURANGA CWS 931 WANGANUI, SPRIGGENS PARK EWS 77312
PARAPARAUMU AERO 1030 AUCKLAND, MOTAT EWS 921 AHURIRI AT STH DIADEM 769
AKAROA EWS 1028 AUCKLAND, MANGERE 2 EWS 920 KAITAIA AERO EWS 7687
AKITIO EWS 1028 AUCKLAND, N. SHORE ALBANY EWS 919 WAIKATO @ CAMBRIDGE GOLF COURSE 762
TIWAI POINT EWS 102614 WAIKATO AT REIDS FARM 919 QUEENSTOWN AERO AWS 761
WELLINGTON AERO BACKUP AWS 10242 WHAKATANE AERO AWS 9188 ASHBURTON AERO AWS 7574
PORIRUA, ELSDON PARK AWS 10225 KAITAIA EWS 910 WHANGAREI EWS 755
RUSSELL CWS 1021 DARGAVILLE 2 EWS 906 WANAKA AERO AWS 7493
WELLINGTON AERO 1017 TUTIRA CWS 900 NUGGET POINT AWS 74610
WHAKATANE EWS 1014 LUMSDEN AWS 8975 BLENHEIM AERO AWS 743
NELSON AERO 1013 TOLAGA BAY WXT AWS 8755 STANTON AT CHEDDAR VALLEY 740
WAIKERIA EWS 10101 HANMER FOREST EWS 873 DANNEVIRKE EWS 721
MANGAKINO AT DILLON RD 1008 HAMILTON, RUAKURA 2 EWS 871 WANGANUI AWS 7172
MANGARE STM AT MANGARE RD 1006 PARAPARAUMU AERO AWS 8711 DUNEDIN, MUSSELBURGH EWS 7121
TAHUNAATARA AT OHAKURI RD 1006 PALMERSTON NORTH AWS 8681 HASTINGS AWS 7112
WHIRINAKI AT GALATEA 994 HAMILTON AWS 853 DUNEDIN AERO AWS 702
PORT TAHAROA AWS 99210 WAIOTAPU AT REPOROA 848 LAKE KARAPIRO CWS 702
GORE AWS 9917 PURERUA AWS 8473 FLAT HILLS WXT AWS 6976
12PUKAKI AERODROME AWS 689 CHERTSEY CWS 549 RUSSELL CWS 15.6
MASTERTON, TE ORE ORE CWS 686 OAMARU EWS 549 WHANGAREI EWS 15.6
BALCLUTHA, TELFORD EWS 682 CHRISTCHURCH, KYLE ST EWS 546 KERIKERI EWS 15.5
FAIRLIE AWS 6803 TIMARU EWS 539 PORT TAHAROA AWS 15.5
MARAEKAKAHO CWS 679 LINCOLN, BROADFIELD EWS 525 AUCKLAND, N. SHORE ALBANY EWS 15.4
CAPE CAMPBELL AWS 6703 TARA HILLS AWS 5218 KAITAIA EWS 15.4
KAIKOURA AWS 6681 MEDBURY CWS 518 WHITIANGA EWS 15.4
BLENHEIM RESEARCH EWS 661 WAIPARA WEST EWS 514 NGAWI AWS 15.41
WINCHMORE 2 EWS 6571 LAUDER EWS 508 AUCKLAND, MOTAT EWS 15.3
NAPIER EWS 651 CASTLEPOINT AWS 5039 FAREWELL SPIT AWS 15.3
WAIAU SCHOOL CWS 651 TIMARU AERO AWS 4831 KAIKOHE AWS 15.3
WAIPAWA EWS 6519 ALEXANDRA CWS 435 WHITIANGA AERO AWS 15.3
WHANGAPARAOA AWS 64911 WINDSOR EWS 435 PAEROA AWS 15.2
WAKANUI 2 CWS 640 RANFURLY EWS 433 NAPIER EWS 15.1
GISBORNE EWS 6381 ALEXANDRA AWS 4277 LAKE KARAPIRO CWS 15.0
CULVERDEN AWS 6357 CLYDE 2 EWS 417 GISBORNE AWS 15.01
NAPIER AERO AWS 633 CROMWELL EWS 417 WHAKATANE AERO AWS 15.0
MOKOHINAU AWS 6279 Mean WHAKATANE EWS 15.0
Location
ASHCOTT ROAD CWS 624 temp(°C) GISBORNE EWS 14.9
LISMORE, RACEMANS HOUSE CWS 617 WHANGAREI AERO AWS 16.5 WAIROA, NORTH CLYDE EWS 14.9
OHOKA CWS 607 WHANGAPARAOA AWS 16.4 NAPIER AERO AWS 14.81
MASTERTON EWS 602 KAITAIA AERO EWS 16.2 HASTINGS AWS 14.8
NGAWI AWS 6001 LEIGH 2 EWS 16.2 PUKEKOHE EWS 14.7
BARING HEAD 596 PURERUA AWS 16.2 MAHIA AWS 14.7
OAMARU AIRPORT AWS 5912 AUCKLAND AERO 16.01 TOLAGA BAY WXT AWS 14.7
OAMARU AWS 5912 TAURANGA CWS 15.9 FIRTH OF THAMES EWS 14.6
MASTERTON AERO AWS 5823 TAURANGA AERO AWS 15.9 TROUNSON CWS 14.4
CHRISTCHURCH AERO 574 AUCKLAND, MANGERE 2 EWS 15.8 HAMILTON, RUAKURA 2 EWS 14.41
LAKE TEKAPO EWS 5729 KERIKERI AERODROME AWS 15.81 CASTLEPOINT AWS 14.4
CHRISTCHURCH AERO BACKUP AWS 5715 HICKS BAY AWS 15.7 WANGANUI AWS 14.3
RANGIORA EWS 554 DARGAVILLE 2 EWS 15.6 WELLINGTON AERO 14.3
13WAIROA AERO AWS 14.3 MASTERTON, TE ORE ORE CWS 13.0 LE BONS BAY AWS 12.2
HAMILTON AWS 14.21 WESTPORT EWS 13.0 CHERTSEY CWS 12.0
NEW PLYMOUTH AWS 14.21 WESTPORT AERO AWS 13 HOKITIKA EWS 11.9
WELLINGTON, GRETA POINT CWS 14.1 CAPE TURNAGAIN AWS 13 TURANGI 2 EWS 11.9
TE KUITI EWS 14.0 TAUMARUNUI AWS 13 HOKITIKA AWS 11.91
BROTHERS ISLAND AWS 14.0 WAIPAWA EWS 13 DUNEDIN, MUSSELBURGH EWS 11.8
MATAMATA, HINUERA EWS 13.8 TAUPO CWS 12.9 METHVEN CWS 11.8
PARAPARAUMU EWS 13.8 WHATAWHATA 2 EWS 12.9 PUYSEGUR POINT AWS 11.81
WAIKERIA EWS 13.8 WAIPARA WEST EWS 12.8 ASHBURTON AERO AWS 11.8
LEVIN AWS 13.81 MASTERTON AERO AWS 12.81 ROXBURGH WXT AWS 11.8
PORIRUA, ELSDON PARK AWS 13.8 STRATFORD EWS 12.8 KAIKOURA, MIDDLE CREEK 11.7
NELSON AWS 13.71 ASHCOTT ROAD CWS 12.7 RANGIORA EWS 11.7
PALMERSTON NORTH AWS 13.71 CHRISTCHURCH, KYLE ST EWS 12.7 REEFTON EWS 11.7
PARAPARAUMU AERO AWS 13.71 AKITIO EWS 12.7 OAMARU AWS 11.71
TUTIRA CWS 13.6 DANNEVIRKE EWS 12.6 OHOKA CWS 11.6
WELLINGTON, KELBURN AWS 13.6 DIAMOND HARBOUR EWS 12.6 WAKANUI 2 CWS 11.6
BARING HEAD 13.5 MASTERTON EWS 12.6 PIGEON CREEK CWS 11.6
LEVIN EWS 13.5 PAHIATUA EWS 12.6 BALMORAL EAST CWS 11.5
MARTINBOROUGH EWS 13.5 TAUMARUNUI EWS 12.6 LISMORE, RACEMANS HOUSE CWS 11.5
CAPE CAMPBELL AWS 13.5 WAIAU SCHOOL CWS 12.6 HAAST AWS 11.4
GALATEA AWS 13.5 TAKAKA EWS 12.5 CROMWELL EWS 11.3
RICHMOND EWS 13.4 AKAROA EWS 12.4 OAMARU EWS 11.2
HAWERA AWS 13.4 MEDBURY CWS 12.4 TIWAI POINT EWS 11.2
KAIKOURA AWS 13.4 TAUPO AWS 12.4 WINCHMORE 2 EWS 11.2
PALMERSTON NORTH EWS 13.4 APPLEBY 2 EWS 12.4 OAMARU AIRPORT AWS 11.21
ROTORUA EWS 13.3 GREYMOUTH AERO EWS 12.4 WANAKA AERO AWS 11.2
MANA ISLAND AWS 13.3 LINCOLN, BROADFIELD EWS 12.3 MOTU EWS 11.2
ROTORUA AERO AWS 13.2 CULVERDEN AWS 12.3 FRANZ JOSEF EWS 11.2
FLAT HILLS WXT AWS 13.2 CHRISTCHURCH AERO 12.21 ALEXANDRA CWS 11.1
UPPER HUTT, TRENTHAM EWS 13.1 SECRETARY ISLAND AWS 12.2 SOUTH WEST CAPE AWS 11.1
BLENHEIM AERO AWS 13.11 TAKAPAU PLAINS AWS 12.2 TIMARU AERO AWS 11.1
14FAIRLIE AWS 11.1 RANFURLY EWS 9.6 AUCKLAND, MOTAT EWS 25551
MILFORD SOUND AWS 11.01 MANAPOURI, WEST ARM JETTY EWS 9.5 RAOUL ISLAND AWS 252713
MAYFIELD @ RUAPUNA 10.9 WAIOURU EWS 9.5 ROTORUA EWS 25132
PUREORA FOREST CWS 10.9 MT COOK AERO AWS 9.4 AUCKLAND, MANGERE 2 EWS 2496
WAIPARA N. BRANCH @ LANGS GULLY CWS 10.9 WAIOURU AIRSTRIP AWS 9.3 TAURANGA AERO 2494
WANAKA CWS 10.9 MT COOK EWS 9.2 AKITIO EWS 2459
WINDSOR EWS 10.9 EGLINTON, KNOBS FLAT CWS 8.8 DIAMOND HARBOUR EWS 24381
DUNEDIN AERO AWS 10.91 ARTHURS PASS AWS 8.4
MASTERTON EWS 2399
BIRCHWOOD WXT AWS 10.9 ARTHURS PASS EWS 7.9
LINCOLN, BROADFIELD EWS 23681
ALEXANDRA AWS 10.9 MT RUAPEHU, CHATEAU EWS 7.8
NUGGET POINT AWS 10.9 MURCHISON MTNS EWS 5.6 ASHBURTON AERO AWS 23592
GORE AWS 10.9 ALBERT BURN 5.4 CROMWELL EWS 23331
INVERCARGILL AERO 2 EWS 10.8 IVORY GLACIER CWS 4.4 LEVIN EWS 2329
INVERCARGILL AERO AWS 10.81 UPPER RAKAIA EWS 4.2 WAIPARA WEST EWS 2323
OHAKUNE EWS 10.7 MT PHILISTINE EWS 3.6 RANGIORA EWS 2313
CLYDE 2 EWS 10.7 MUELLER HUT EWS 3.2 AUCKLAND, N. SHORE ALBANY EWS 23042
BALCLUTHA, TELFORD EWS 10.5 MAHANGA EWS 2.8 CHRISTCHURCH AERO 2285
QUEENSTOWN EWS 10.5 MT POTTS EWS 1.7 WINCHMORE 2 EWS 228512
QUEENSTOWN AERO AWS 10.41 CASTLE MOUNT EWS 0.5 OAMARU EWS 2273
LUMSDEN AWS 10.4 WESTPORT EWS 2264
TARAPOUNAMU EWS 10.3 Sunshine AKAROA EWS 2257
Location
TIMARU EWS 10.3 (hours) UPPER HUTT, TRENTHAM EWS 2257
FIVE RIVERS CWS 10.2 RICHMOND EWS 2859 KAWERAU AWS 22525
HANMER FOREST EWS 10.2 BLENHEIM RESEARCH EWS 2799 HAMILTON, RUAKURA 2 EWS 22452
WAIPOUNAMU CWS 10.2 APPLEBY 2 EWS 27347 STRATFORD EWS 22402
LAUDER EWS 10.1 NAPIER EWS 2709 WHANGAREI EWS 2231
GORE EWS 10.0 WHAKATANE SUNSHINE 2690 WAIKERIA EWS 22282
WAITUTU CWS 9.9 NEW PLYMOUTH AWS 26821 QUEENSTOWN AERO AWS 22131
TARA HILLS AWS 9.9 TAKAKA EWS 263014 WELLINGTON, KELBURN 2207
PUKAKI AERODROME AWS 9.8 NELSON AERO 2606 DARGAVILLE 2 EWS 21981
MANAPOURI AERO AWS 9.71 GISBORNE AWS 25663 PARAPARAUMU AERO 2189
15KAITAIA EWS 2167
TURANGI 2 EWS 21651
TE KUITI EWS 21461
HOKITIKA AWS 21061
DUNEDIN, MUSSELBURGH EWS 20892
TAUMARUNUI AWS 20654
MARTINBOROUGH EWS 2023
GREYMOUTH AERO EWS 197415
DANNEVIRKE EWS 1890
INVERCARGILL AERO 2 EWS 1890
FRANZ JOSEF EWS 188316
REEFTON EWS 18541
HOKITIKA AERO 1842
GORE EWS 18142
PALMERSTON NORTH EWS 176716
INVERCARGILL AERO 17573
BALCLUTHA, TELFORD EWS 15911
MT COOK EWS 1526
16Section 5: Annual temperature – record or near record warmth for many
locations
2019 was New Zealand’s 4th-warmest year on record based on NIWA’s seven-station series, which
begins in 1909. Many locations observed record or near-record high mean, mean maximum, and
mean minimum temperatures. Notably, Tauranga had its warmest year since records began there in
1913.
Table 1: Near-record or record high or low annual average temperature departures for 20196.
Location Mean air Departure Year Comments
temp. (oC) from records
normal (oC) began
Mean temperature
Tauranga 16.0 1.1 1913 Highest
Ngawi 15.4 0.9 1972 Highest
Farewell Spit 15.3 1.4 1971 Highest
Kaikōura 13.5 1.1 1963 Highest
Whangaparaoa (Auckland) 16.6 0.9 1982 2nd-highest
Motu 12.0 1.2 1990 2nd-highest
South West Cape 11.0 0.8 1991 2nd-highest
Dunedin (Musselburgh) 11.8 0.7 1947 Equal 2nd-highest
Kerikeri 16.0 0.7 1945 3rd-highest
Whangārei 16.6 0.8 1967 3rd-highest
Paeroa 15.4 0.7 1947 3rd-highest
Whakatāne 15.1 1.1 1974 3rd-highest
Hicks Bay 15.8 0.9 1969 3rd-highest
Hastings 14.8 1.7 1965 3rd-highest
Wairoa 15.3 1.0 1964 3rd-highest
Mahia 14.9 0.8 1990 3rd-highest
Puysegur Point 11.8 0.8 1978 3rd-highest
Lumsden 10.4 0.8 1982 3rd-highest
Invercargill 11.0 1.0 1905 3rd-highest
Tiwai Point 11.4 0.8 1970 3rd-highest
Nugget Point 10.9 0.7 1970 3rd-highest
Rotorua 13.5 0.8 1964 4th-highest
Paraparaumu 13.9 0.8 1953 4th-highest
Levin 14.0 0.9 1895 4th-highest
Mean maximum temperature
Kerikeri 21.3 1.2 1945 Highest
Whangārei 21.3 1.4 1967 Highest
Whangaparaoa 20.0 1.2 1982 Highest
6The rankings (1st, 2nd, 3rd….etc) in Tables 1 to 12 are relative to climate data from a group of nearby stations, some of
which may no longer be operating. The current climate value is compared against all values from any member of the
group, without any regard for homogeneity between one station’s record and another. This approach is used because of
the practical limitations of performing homogeneity checks in real-time.
17Whenuapai (Auckland) 20.1 1.0 1945 Highest
Whitianga 21.2 1.9 1962 Highest
Paeroa 20.7 1.1 1947 Highest
Tauranga 20.4 1.3 1913 Highest
Te Puke 20.0 1.0 1973 Highest
Rotorua 18.8 1.8 1964 Highest
Taupō 19.0 2.3 1949 Highest
Hamilton (Airport) 20.1 1.1 1946 Highest
Te Kuiti 20.8 2.0 1959 Highest
Ngawi 18.7 1.1 1972 Highest
Gisborne 21.1 1.6 1905 Highest
Wairoa 21.0 1.7 1964 Highest
Upper Hutt (Trentham) 18.3 1.2 1939 Highest
Ohakune 17.0 1.9 1962 Highest
Farewell Spit 19.0 1.4 1971 Highest
Blenheim 19.6 1.2 1932 Highest
Hanmer Forest 19.4 2.4 1906 Highest
Kaikōura 17.1 1.3 1963 Highest
Medbury 18.6 1.1 1927 Highest
Waiau 19.5 1.8 1974 Highest
Christchurch 18.2 1.3 1863 Highest
Tara Hills 17.0 1.2 1949 Highest
Ōamaru 16.6 1.1 1967 Highest
Dunedin (Musselburgh) 16.1 1.4 1947 Highest
Whakatāne 20.3 1.2 1974 2nd-highest
Motu 17.3 1.9 1990 2nd-highest
Trangi 18.1 1.0 1968 2nd-highest
Hicks Bay 19.2 1.2 1969 2nd-highest
Hastings 20.5 2.0 1965 2nd-highest
Porirua 17.5 0.6 1968 2nd-highest
Waipara West 18.9 0.8 1973 2nd-highest
Timaru 17.4 1.1 1885 2nd-highest
Ranfurly 16.6 1.5 1897 2nd-highest
Leigh 21.3 2.4 1966 3rd-highest
Napier 20.4 1.5 1870 3rd-highest
Puysegur Point 14.3 0.9 1978 3rd-highest
Dunedin (Airport) 17.0 1.0 1962 3rd-highest
Tiwai Point 15.0 1.0 1970 3rd-highest
Balclutha 16.1 0.8 1964 3rd-highest
South West Cape 13.5 0.8 1991 3rd-highest
Mokohinau 19.0 0.7 1994 4th-highest
Martinborough 19.0 1.0 1986 4th-highest
Mahia 17.9 0.8 1990 4th-highest
Palmerston North 18.7 1.0 1928 4th-highest
Hawera 17.1 0.7 1977 4th-highest
Akaroa 18.2 0.7 1978 4th-highest
Nugget Point 14.2 0.7 1970 4th-highest
Mean minimum temperature
18Aoraki / Mt Cook Village 4.6 1.0 1929 Highest
Lumsden 5.3 0.9 1982 Highest
Port Taharoa 12.6 1.0 1973 2nd-highest
Ngawi 12.1 0.8 1972 2nd-highest
Hawera 9.8 1.0 1977 2nd-highest
Brothers Island 12.1 0.6 1997 2nd-highest
Medbury 6.3 1.0 1927 2nd-highest
Five Rivers 5.2 0.8 1982 2nd-highest
Gore 6.3 0.8 1907 2nd-highest
Invercargill 6.6 1.1 1905 2nd-highest
Mahia 11.9 0.8 1990 3rd-highest
Porirua 9.9 0.2 1968 3rd-highest
Farewell Spit 11.6 1.4 1971 3rd-highest
Puysegur Point 9.3 0.8 1978 3rd-highest
Cape Campbell 11.3 0.6 1953 3rd-highest
Kaikōura 9.9 0.7 1963 3rd-highest
Culverden 6.4 1.3 1928 3rd-highest
Ōamaru 7.1 0.3 1967 3rd-highest
Dunedin (Musselburgh) 8.3 0.7 1947 3rd-highest
Roxburgh 6.7 2.0 1950 3rd-highest
Tiwai Point 7.8 0.6 1970 3rd-highest
South West Cape 8.6 0.9 1991 3rd-highest
Paraparaumu 10.0 0.7 1953 4th-highest
Wellington (Kelburn) 10.8 0.9 1927 4th-highest
During 2019 many high record and near-record extreme temperatures occurred. Most notably,
several record and near-record high temperatures occurred during the last few days of January.
Hanmer Forest reached 38.4°C on 31 January which was New Zealand’s 18th-equal warmest
temperature all-time. The lowest air temperature of the year was -9.2°C recorded at Lake Tekapo on
3 June. This was the lowest annual minimum temperature this decade.
Table 2: Near-record or record high or low annual temperature extremes for 2019.
Location Temperature Date of Year Comments
(oC) occurrence records
began
Highest extreme maximum temperatures
Hanmer Forest 38.4 Jan-31st 1906 Highest
Waiau 37.8 Jan-31st 1974 Highest
Rotorua 32.2 Feb-13th 1964 Highest
Wellington (Kelburn) 30.3 Jan-29th 1928 Highest
Stratford 29.5 Jan-29th 1960 Highest
Lake Tekapo 35.0 Jan-31st 1925 Highest
Kaitaia 31.2 Jan-29th 1948 Highest
Hamilton (Airport) 32.0 Jan-29th 1946 Highest
Te Kuiti 33.3 Jan-29th 1959 Highest
19Levin 32.6 Jan-29th 1895 Highest
Porirua 31.0 Jan-29th 1968 Highest
Upper Hutt (Trentham) 33.5 Jan-29th 1939 Highest
Ohakune 31.1 Jan-29th 1962 Highest
Medbury 37.9 Jan-31st 1927 Highest
Ranfurly 33.7 Jan-31st 1897 Equal highest
Paeroa 32.3 Feb-14th 1947 2nd-highest
Taumarunui 33.6 Jan-29th 1947 2nd-highest
Takaka 32.6 Jan-28th 1978 2nd-highest
South West Cape 27.0 Feb-13th 1991 2nd-highest
Whenuapai (Auckland) 30.3 Jan-29th 1945 2nd-highest
Whakatāne 32.3 Jan-6th 1975 2nd-highest
Taupō 32.9 Jan-29th 1949 2nd-highest
Richmond 33.8 Jan-27th 1862 2nd-highest
Te Puke 32.4 Feb-13th 1973 Equal 2nd-highest
Whitianga 31.7 Jan-11th 1962 Equal 2nd-highest
Waiouru 29.7 Jan-29th 1962 3rd-highest
Kerikeri 31.2 Jan-6th 1945 Equal 3rd-highest
Five Rivers 30.3 Dec-31st 1982 Equal 3rd-highest
Nelson 32.9 Jan-27th 1862 4th-highest
Blenheim 35.3 Jan-27th 1932 4th-highest
Ngawi 31.5 Jan-30th 1972 Equal 4th-highest
Lowest extreme maximum temperatures
Balclutha 2.4 Aug-4th 1972 Lowest
Auckland (Western Springs) 9.0 Aug-18th 1971 2nd-lowest
Highest extreme minimum temperatures
Milford Sound 19.1 Mar-26th 1935 Highest
Puysegur Point 19.6 Feb-10th 1978 Highest
Richmond 24.3 Jan-28th 1862 Highest
South West Cape 17.3 Feb-10th 1991 Highest
Ngawi 21.8 Feb-5th 1972 3rd-highest
Whitianga 21.2 Jan-30th 1971 Equal 3rd-highest
Balclutha 15.5 Mar-26th 1972 4th-highest
Martinborough 20.1 Mar-27th 1986 Equal 4th-highest
Medbury 21.5 Feb-1st 1927 Equal 4th-highest
Lowest extreme minimum temperatures
Manapouri (West Arm Jetty) -6.2 Jul-10th 1971 3rd-lowest
Section 6: Annual rainfall – a dry year for the North Island
2019 was a dry year for many parts of the North Island with below normal (50-79% of normal)
rainfall recorded across Northland, Auckland and the Bay of Plenty as well as parts of Waikato,
Hawke’s Bay, the Wairarapa and Marlborough. Many locations observed record or near-record low
rainfall amounts. Kaitaia, Whangārei, Hamilton, Masterton and the Auckland (Western Springs) site
20all had their driest year on record. In Tauranga, where observations extend all the way back to 1898,
it was the 4th-driest year on record.
Conversely, more westerly winds than normal mean that western Southland and parts of Westland
observed above normal rainfall (120-149% of the annual normal). For Hokitika, it was the 4th-wettest
year on record with records extending back to 1866. Milford Sound also had its 4th-wettest year on
record (records began in 1929) with an astonishing 8,417 mm of rain recorded there in 2019. That’s
more than 20 times the rainfall observed in Cromwell and Clyde - New Zealand’s driest locations for
2019 (417 mm of rain each) just 100 km away as the crow flies but on the leeward side of the
Southern Alps. These large differences in New Zealand’s rainfall occur due to the föhn effect7 and
are a striking feature of our climate.
Table 3: Record or near-record annual rainfall totals for the year 2019.
Location Rainfall Percentage Year Comments
total (mm) of normal records
began
High records or near-records
Manapouri (West Arm Jetty) 5135 125 1971 2nd-highest
Manapouri (Airport) 1405 124 1961 3rd-highest
Hokitika 3517 121 1866 4th-highest
Milford Sound 8417 125 1929 4th-highest
Low records or near-records
Kaitaia 910 65 1948 Lowest
Whangārei 755 54 1937 Lowest
Leigh 779 70 1966 Lowest
Auckland (Western Springs) 921 76 1948 Lowest
Hamilton (Airport) 853 71 1935 Lowest
Masterton 602 65 1926 Lowest
Dannevirke 721 70 1951 Lowest
Te Puke 1230 75 1973 2nd-lowest
Whatawhata 1212 75 1952 2nd-lowest
Hamilton (Ruakura) 871 78 1905 3rd-lowest
Dargaville 906 80 1943 4th-lowest
Auckland (North Shore) 919 76 1966 4th-lowest
Tauranga 787 66 1898 4th-lowest
There were no locations that experienced their record or near-record highest 1-day extreme rainfall
in 2019.
Table 4: Record or near-record high extreme 1-day rainfall totals that occurred in 2019.
Location 1-day extreme Date Year Comments
rainfall (mm) records
began
None observed
7 Watch NIWA’s föhn wind explainer here: NIWA’s https://www.youtube.com/watch?v=4AVMUIw2E_k
21Section 8: 2019 climate in the six main centres
Five out of the six main centres observed above average temperatures during 2019 while only one
(Auckland) had near average temperatures. Hamilton had its driest year on record, Tauranga its 4th-
driest year and Auckland also had below normal rainfall. The remaining main centres had near
normal rainfall. Of the six main centres in 2019, Tauranga was the warmest, Dunedin was the
coolest, Wellington was the wettest, Christchurch was the driest, Auckland was the sunniest and
Dunedin was the least sunny.
Table 5: 2019 climate in the six main centres.
Rainfall
Location Rainfall (mm) % of normal Comments
Aucklanda 920 82% Below normal
Taurangab 787 66% Well below normal (4th-lowest on record)
Hamiltonc 853 71% Well below normal (lowest on record)
Wellingtond 12498 103% Near normal
Christchurche 574 97% Near normal
Dunedinf 7129 96% Near normal
Temperature
Location Mean Departure from Comments
temp. (oC) normal (oC)
Aucklanda 15.8 +0.4 Near average
Taurangab 16.0 +1.1 Above average (warmest on record)
c
Hamilton 14.4 +0.8 Above average
Wellingtond 13.69 +0.7 Above average
Christchurche 12.3 +0.7 Above average
f
Dunedin 11.8 +0.7 Above average (equal 2nd-warmest on record)
Sunshine
Location Sunshine
(hours)
Aucklanda 2496
Taurangab 2494
g
Hamilton 224510
Wellingtond 2207
Christchurche 2285
Dunedinf 20810
a Mangere b Tauranga Airport c Hamilton Airport d Kelburn e Christchurch Airport f Musselburgh g Ruakura
8 Missing 3 days of data
9
Missing 1 day of data
10 Missing 2 days of data
22Section 9: Significant weather and climate events in 2019
This section contains information pertaining to some of the more significant weather and climate
events that occurred in 2019. Note that a more detailed list of significant weather events for 2019
can be found in the Highlights and extreme events section of NIWA’s Monthly Climate Summaries.
These summaries are available online at http://www.niwa.co.nz/climate/summaries.
Drought and low rainfall
On 5 February, tinder-dry conditions in the Tasman region fuelled a large scrub fire in Pigeon Valley
near Wakefield. The fire doubled in size overnight, spreading to cover 1870 hectares within a
perimeter of 20 km by 3 a.m. on 6 February. A Civil Defence State of Emergency was declared which
lasted until 27 February as firefighting efforts continued to work on hot spots, fight flareups and
contain the fire. By 13 February, the wildfires had burned through 2300 hectares in the Nelson-
Tasman region, destroyed one home, and led to evacuations of more than 1000 people. By 24
February, the fire was contained and controlled with a 30 m boundary black-out zone. It was
reportedly the largest aerial firefight in New Zealand's history, with 23 helicopters and two planes
used at the peak of the fire. Fire and Emergency New Zealand stated that the cost of the aircraft,
ground machinery, and other firefighting resources had been $1 million a day for the first week of
the fire.
At the end of February several dry spells came to an end. Nelson observed a 40-day dry spell which
was the 4th-longest dry spell on record there (with records extending all the way back to 1862) while
Hamilton and Tauranga had 36 consecutive dry days –their 3rd-longest dry spells on record. Auckland
(Mangere) observed a 23-day dry spell which was the region’s 9th-longest on record.
At the start of July, Watercare urged residents in Auckland to use water wisely, as the city's total
water storage was down to 59.2%, 25% less than normal for the time of year.
Floods and high rainfall
Extremely heavy rainfall occurred in the western South Island on 25-27 March. The weather event
was a mix of an ‘atmospheric river3’ extending from Australian cyclones coupled with extra energy
from the Tasman Sea marine heatwave, as well as a strong low-pressure system siphoning moisture
toward New Zealand. On 26 March, a State of Emergency was declared in Westland as torrential
rainfall and strong winds battered the region and caused evacuations, power outages and road
closures. The Waiho River bridge on SH6, the link between Franz Josef and Fox Glacier, was claimed
by raging floodwaters. Haast River at Roaring Billy recorded a water level of 7.423 m, the 2nd-highest
water level at the station since 1969 (highest 7.580 m in 1978). Between 25-27 March, a New
Zealand 48-hour rainfall record was set at the Hokitika catchment of the Cropp River which recorded
1086 mm, or more than a metre of rain. That beat the previous New Zealand two-day record, also
from Cropp River in December 1995, by about 40 mm.
On 29 April, heavy rain hit Christchurch and the Canterbury region. There were widespread reports
of surface flooding in Christchurch city, with 27 streets affected. Heavy rain was thought to have
triggered a slip on SH73 between Otira and Kumara Junction, forcing the temporary closure of one
lane in the area.
23On 30 May, rain flooded parts of SH6 which caused Westland District Council to activate its
Emergency Operations Centre to monitor the situation. The Buller River reached its alarm point of
8.4 m at Te Kuha (village east of Westport) forcing SH6 at Inangahua Junction to close.
On 10 August, heavy rain fell in eastern parts of Otago and South Canterbury. Flooding forced the
closure of SH1 between Ōamaru and Timaru.
On 10 September, heavy rain in the Coromandel Peninsula caused closures for sections of SH25 from
Coromandel to Whitianga, Tairua to Whitianga and Tairua to Hikuai. Kuaotunu bore the brunt of the
storm's damage and a large slip just south of Cemetery Rd in Kuaotunu caused a road closure until
12 September. Several local roads in Kuaotunu were also affected by flooding and slips, while
garages, backyards and paddocks were fully submerged. Several people in Kuaotunu were displaced
by flooding with some on standby to be evacuated.
During the first eight days of December, a stationary high to the northeast of New Zealand and low
pressure to the southwest brought a prolonged period of northwesterly airflows over the country.
These delivered persistent rainfall to the headwaters of the South Island lakes and rivers. Lake
Wanaka and Lake Wakatipu rose considerably, inundating lakeside roads, tracks and reserves. Many
Wanaka businesses sand-bagged their properties as floodwaters threatened buildings in the central
business district.
On 7-8 December, heavy rain caused significant issues for many parts of the South Island and lower
North Island. The Rangitata River rose rapidly due to heavy rain in the headwaters, causing extensive
flooding in areas along the lower reaches of the river. A local State of Emergency was declared in
the Timaru District due to flooding, and residents were evacuated from several areas including
Rangitata Island and Rangitata Huts
Table 6: Record high monthly extreme 1-day rainfall totals were recorded in 2019 at:
Location Extreme 1- Date of Year Ranking
day rainfall extreme records
(mm) rainfall began
January
None observed
February
None observed
March
Manapouri (West Arm Jetty) 140 25th 1971 Highest
April
None observed
May
Akaroa 114 31st 1977 Highest
June
None observed
July
Taupō 84 4th 1949 Highest
24August
Ōamaru 78 10th 1950 Highest
September
None observed
October
Paeroa 148 14th 1914 Highest
November
None observed
December
None observed
Temperature extremes
From 27 January – 1 February a combination of warm seas, high pressure over the country and a hot
airmass originating from Australia led to heatwave conditions across New Zealand. Several locations
across the country observed record or near-record high daily maximum and minimum summer
temperatures. The warmest temperature during the period was 38.4°C recorded in Hanmer Forest
on 31 January. This was Hanmer Forest’s highest temperature on record (data since 1906) and the
18th-equal warmest temperature on record for all months in New Zealand.
Several record or near-record high daily maximum and minimum temperatures were broken on 3-4
July as a mild air flow from the sub-tropics brought above average temperatures to most regions.
Notably, Dunedin (Musselburgh) observed 20.3°C on 3 July which is the warmest July temperature
since records began there in 1947. On the same day, a new July maximum temperature record of
17.6°C was set in Ranfurly, with records dating all the way back to 1897.
The first week of November saw unusually high temperatures nationwide. The heat was associated
with a northwesterly airflow delivering warm and dry air from interior Australia. Several locations
observed record or near-record high daily maximum temperatures for spring during this time. Most
notable was Kawerau (Bay of Plenty), which recorded a maximum temperature of 34.6°C on 3
November. This was New Zealand’s third-highest spring temperature on record.
Several locations across Southland and Otago observed one of their warmest December days on
record on 31 December. In Ranfurly, the temperature reached 32.3°C, making it Ranfurly’s highest
December temperature since records began in 1897.
Table 7: Extremes of high daily maximum temperature in 2019 were recorded at:
Location Extreme Date of Year records Ranking
maximum extreme began
(°C) temperature
January
Kaitaia 31.2 29th 1948 Highest
Whangaparaoa 29.4 29th 1982 Highest
Auckland (Whenuapai) 30.3 29th 1945 Highest
Whitianga 31.7 11th 1962 Highest
Whakatāne 33.3 28th 1975 Highest
Taupō 32.9 29th 1949 Highest
25Whatawhata 32.2 29th 1952 Highest
Hamilton (Ruakura) 32.9 29th 1906 Highest
Hamilton (Airport) 32.0 29th 1946 Highest
Te Kuiti 33.3 29th 1959 Highest
Taumarunui 33.6 29th 1947 Highest
Levin 32.6 29th 1895 Highest
Porirua 31.0 29th 1968 Highest
Wellington (Kelburn) 30.3 29th 1928 Highest
Upper Hutt (Trentham) 33.5 29th 1939 Highest
Stratford 29.5 29th 1960 Highest
Ohakune 31.1 29th 1962 Highest
Waiouru 29.7 29th 1962 Highest
Takaka 32.6 28th 1978 Highest
Motueka 34.0 27th 1956 Highest
Appleby 32.6 28th 1932 Highest
Richmond 33.8 27th 1862 Highest
Brothers Island 27.0 29th 1997 Highest
Hanmer Forest 38.4 31st 1906 Highest
Medbury 37.9 31st 1927 Highest
Waiau 37.8 31st 1974 Highest
Lake Tekapo 35.0 31st 1925 Highest
Paeroa 31.9 29th 1947 Equal highest
Farewell Spit 29.0 29th 1971 Equal highest
Ranfurly 33.7 31st 1897 Equal highest
February
Tauranga 31.6 13th 1913 Highest
Te Puke 32.4 13th 1973 Highest
Rotorua 32.2 13th 1964 Highest
Motu 30.0 15th 1990 Highest
Te Kuiti 32.1 14th 1959 Highest
South West Cape 27.0 13th 1991 Highest
March
Whitianga 28.7 4th 1962 Highest
South West Cape 26.0 31st 1991 Highest
Paeroa 29.2 3rd 1947 Equal highest
April
None observed
May
Arthurs Pass 17.6 6th 1973 Highest
June
Arapito 20.3 13th 1978 Highest
Farewell Spit 18.1 14th 1971 Equal highest
July
Porirua 17.4 24th 1968 Highest
26Ranfurly 17.6 3rd 1897 Highest
Dunedin (Musselburgh) 20.3 3rd 1947 Highest
Manapouri (West Arm Jetty) 18.7 9th 1971 Highest
August
Whitianga 20.8 11th 1962 Highest
Greymouth 19.4 11th 1947 Highest
September
Ohakune 21.1 4th 1962 Highest
October
Whangārei 25.6 27th 1967 Highest
Whangaparaoa 23.1 27th 1982 Highest
Whitianga 25.2 27th 1962 Highest
Te Puke 25.3 27th 1973 Highest
Whakatāne 28.2 27th 1975 Highest
Motu 26.3 27th 1990 Highest
Farewell Spit 24.0 26th 1971 Highest
Ranfurly 26.8 26th 1897 Highest
November
Kaitaia 26.4 4th 1948 Highest
Kerikeri 29.4 4th 1945 Highest
Kaikohe 28.4 4th 1973 Highest
Whangārei 29.4 5th 1967 Highest
Mokohinau 23.6 5th 1994 Highest
Whitianga 30.9 4th 1962 Highest
Tauranga 29.2 3rd 1913 Highest
Te Puke 31.5 3rd 1973 Highest
Kawerau 34.6 3rd 1954 Highest
Rotorua 30.9 23rd 1964 Highest
Taupō 32.8 23rd 1949 Highest
Te Kuiti 29.2 25th 1959 Highest
Lower Retaruke 29.5 23rd 1966 Highest
Waipawa 29.5 5th 1945 Highest
Ohakune 27.8 3rd 1962 Highest
Hanmer Forest 32.5 28th 1906 Highest
Cheviot 33.1 3rd 1982 Highest
Waipara West 32.1 3rd 1973 Highest
Rangiora 31.7 28th 1965 Highest
Akaroa 31.1 3rd 1978 Highest
Le Bons Bay 26.9 3rd 1984 Highest
Lumsden 27.5 2nd 1982 Highest
Clyde 32.5 2nd 1978 Highest
Balclutha 28.6 2nd 1964 Highest
Hamilton (Airport) 28.3 7th 1946 Equal highest
Wairoa 34.1 27th 1964 Equal highest
Alexandra 32.2 2nd 1928 Equal highest
December
Ranfurly 32.3 31st 1897 Highest
Five Rivers 30.3 31st 1982 Highest
27Table 8: Extremes of low daily maximum temperature in 2019 were recorded at:
Location Extreme Date of Year records Ranking
low extreme began
maximum temperature
(°C)
January
None observed
February
Akaroa 12.3 24th 1978 Lowest
March
None observed
April
None observed
May
None observed
June
None observed
July
None observed
August
Auckland (Western Springs) 9.0 18th 1971 Lowest
Haast 4.8 4th 1949 Lowest
Balclutha 2.4 4th 1972 Lowest
Nugget Point 1.2 4th 1972 Lowest
Campbell Island 0.8 13th 1991 Lowest
September
Taupō 7.2 9th 1950 Lowest
Akaroa 6.1 8th 1978 Lowest
Hawera 8.3 8th 1977 Equal lowest
October
None observed
November
None observed
December
None observed
Table 9: Extremes of low daily minimum temperature in 2019 were recorded at:
Location Extreme Date of Year Ranking
minimum extreme records
(°C) temperature began
January
None observed
February
Porirua 4.8 26th 1968 Lowest
Arapito 3.8 25th 1978 Lowest
28You can also read