On the measure of land subsidence throughout DEM and orthomosaics using GPS and UAV Medición de asentamientos debido a la subsidencia regional a ...
←
→
Page content transcription
If your browser does not render page correctly, please read the page content below
I ngeniería I nvestigación y T ecnología
volumen XXII (número 1), enero-marzo 2021 1-12
ISSN 2594-0732 FI-UNAM artículo arbitrado
Información del artículo: Recibido: 24 de junio de 2020, aceptado: 16 de noviembre de 2020
Attribution-NonCommercial-NoDerivatives 4.0 International (CC BY-NC-ND 4.0) license
https://doi.org/10.22201/fi.25940732e.2021.22.1.006

On the measure of land subsidence throughout DEM and orthomosaics using
GPS and UAV
Medición de asentamientos debido a la subsidencia regional a través del uso de GPS,
VANT y análisis de DEM
Galeana-Pérez Víctor Manuel                                              Medellin-Aguilar Gerardo
Universidad Autónoma de Querétaro                                        Universidad Autónoma de Querétaro
Facultad de Ingeniería                                                   Facultad de Ingeniería
E-mail: vmgaleana26@gmail.com                                            E-mail: gerardo.medellin@uaq.mx
https://orcid.org/0000-0002-5613-2489                                    https://orcid.org/0000-0002-3691-8046
Chávez-Alegría Omar
Universidad Autónoma de Querétaro
Facultad de Ingeniería
E-mail: omar.chavez@uaq.mx
https://orcid.org/0000-0003-4474-0206

                                                                  Abstract
Today, topography is an essential part for the construction of civil works in Mexico and in the world, obtaining it has become a com-
plicated task due to the large areas to be built, the difficult access that puts the integrity of individuals at risk; and the high requirement
of personnel for the tasks. Currently, photogrammetry using unmanned aerial vehicles (UAV) has been potentiated due to the infinity
of uses, autonomy and little demand for resources, to carry out tasks in short times. Furthermore, the topography was, until some
years ago, quasi-static, however due to the alteration generated by human activities it has been transformed into a dynamic activity.
This work presents the procedures to carry out a topographic survey in the Querétaro valley, in an area called “El Ensueño”, it has
had a subsidence fault for years, and has been in constant movement, causing considerable damage to infrastructure. The present
study reveals for the first time an orthomosaic and a Digital Elevation Model (DEM) of the study site, for a survey with UAV it is ne-
cessary to use Ground Control Points (GCP), in order to correct the DEM by orthorectification of the images obtained during the flight
by means of UAV. The results obtained show a total error in centimeters of 3.33 and image pixels in 0.311, both in the X, Y and Z
space, which represent an acceptable error considering that the latter must be less than 0.6 pixels, so therefore, the alignment of the
images and measurement by GPS were performed correctly during the processing. Furthermore, the Digital Terrain Model allows to
observe a steep difference between one extreme and the other, which will make it location of the fault that defines the subsidence
zone (affected area).
Keywords: Unmanned aerial vehicles, land subsidence, orthomosaic, digital elevation model, photogrammetry, monitoring, Agisoft
Meta Shape.

                                                                 Resumen
Hoy en día, la topografía forma parte indispensable para la construcción de obras civiles en México y en el mundo, su obtención se
ha vuelto una tarea complicada debido a las grandes áreas para levantar, el difícil acceso que pone en riesgo la integridad de los in-
dividuos y el alto requerimiento de personal para las tareas. En la actualidad, la fotogrametría mediante vehículos aéreos no tripula-
dos (VANT) se ha potencializado debido a la infinidad de usos, autonomía y poca demanda de recursos para llevar a cabo labores en
tiempos cortos. Además la topografía era, hasta hace algunos años cuasiestática, sin embargo, el ritmo acelerado de las actividades
humanas la han convertido en dinámica. En este trabajo se presenta el procedimiento utilizado para realizar un levantamiento topo-
gráfico en el valle de Querétaro, en una zona denominada “El Ensueño”, esta presenta una falla por subsidencia desde hace años y
ha estado en continuo movimiento, provocando cuantiosos daños en la infraestructura. El presente estudio da a conocer por prime-
ra vez un ortomosaico y un Modelo Digital de Elevación (MDE) del sitio en estudio. Para un levantamiento con VANT es necesario
usar Puntos de Control Terrestre (PCT) con la finalidad de corregir el MDE mediante la ortorectificación de las imágenes obtenidas
durante el vuelo, por medio de VANT. Los resultados obtenidos, muestran un error total en centímetros de 3.33 y de imagen en pi-
xeles de 0.311, ambos en el espacio X, Y y Z, los cuales representan un error aceptable, considerando que este último debe ser in-
ferior a 0.6 pixeles, por lo tanto, la alineación de las imágenes y medición mediante GPS fueron realizadas de forma correcta
durante el procesamiento. Además, el Modelo Digital del Terreno (MDT) muestra una muy marcada diferencia entre uno y otro lado
de la falla, lo que puede indicar que esta es una herramienta muy útil para identificar las áreas afectadas por la subsidencia con un
método rápido y más preciso.
Descriptores: Vehículo aéreo no tripulado, subsidencia, ortomosaico, modelo digital de elevaciones, fotogrametría, monitoreo,
Agisoft Meta Shape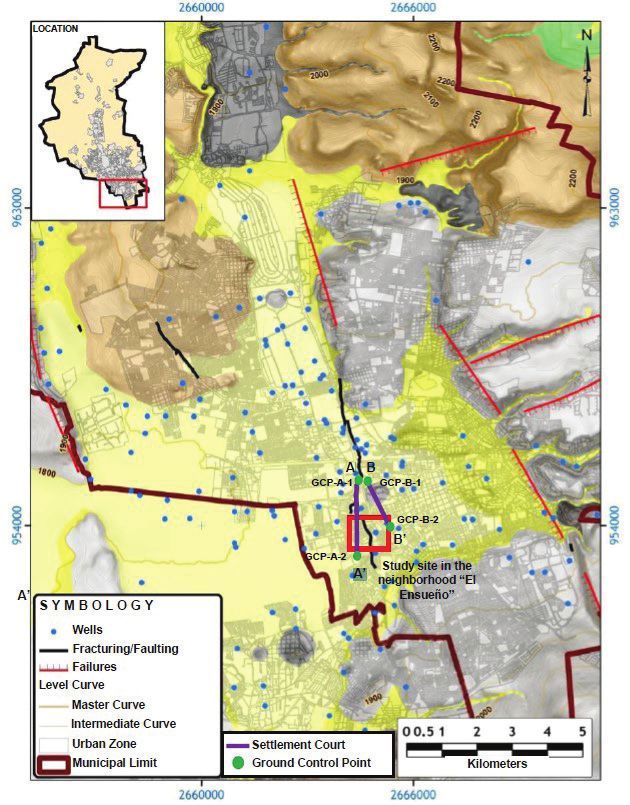
https://doi.org/10.22201/fi.25940732e.2021.22.1.006
                       On   the measure of land subsidence throughout   DEM   and orthomosaics using   GPS   and   UAV

                        Introduction                                     and a GPS from high-resolution images contemplating
                                                                         eight georeferenced GCPs and corrected by the station
Currently, photogrammetry is a technique used in ob-                     closest to the study site.
taining digital elevation, and orthomosaic models of
areas from aerial images (Mills & McLeod, 2013).                                            Theoretical framework
Although technology has potentially evolved to impro-
ve the results of this technique using tools based on te-                Previous studies
rrestrial and remote sensors such as global positioning
systems (GPS), total station, detection, and range of la-                Different authors have focused their work on the UAV
ser images (LiDAR), the synthetic aperture radar, and                    and the GPS, due to the facilities and working condi-
unmanned aerial vehicles (UAV), among others, the use                    tions they provide, they also used these technologies
of some of these continues to represent high costs in                    for the development of their research such as Nietham-
their use (Hastaoğlu et al., 2019).                                      mer et al. (2012) and Luccier et al. (2013) used the UAVs
    Among the instruments of high accessibility, low                     to reconstruct landslides using aerial photography;
cost, and that allow obtaining high spatial resolution                   Siebert & Teizer (2014), they used UAV to inspect
images in a simple, and flexible way, the UAV can be                     works and supervise the emergency and disaster ser-
mentioned (Hemmelder et al., 2018); this instruments                     vice. Barmpounakis et al. (2016) used UAV to monitor
allows safeguarding the integrity of operators in dan-                   traffic and acquire some parameters of speed, accele-
gerous environments, and have few flight restrictions                    ration and trajectories. Forlani et al. (2018) used UAV
(ISPRS, 2004; Shi et al., 2011; Patterson et al., 2014; Xiang            with RTK (Real Time Kinematic or Real Time Satellite
& Tian, 2011).                                                           Navigation) in the same flight plan to generate Digital
    Although UAVs have significantly increased their                     Surface Models (DSM) using three different block con-
capacity to collect data in the field with higher density                figurations.
(Dering et al., 2019), it has been pointed out that the use                  Similarly, GPS has stood out as a new technology
of additional tools improves the precision of the results                due to the ease of acquiring data in the field. In this
(Jimenez et al., 2017).                                                  way, Llenera & Suarez (2015) analyzed the GPS data to
    When only the camera positions are used as coordina-                 obtain reference and time systems using different posi-
tes for the construction of the DEMs, these constructions                tions of the satellites. They obtained points on the sur-
tend to present errors in orientation of the block mainly,               face of the earth by means of computer triangulations,
and open the way for there to be significant information                 altitude, longitude, and latitude.
biases. Therefore, it is recommended to add at least three                   Now, referring to the study site that is proposed in
or four GCPs to camera stations during processing to                     this paper, some researchers have been carried out for
avoid bias because of elevations (Forlani et al., 2018).                 some years where different damages caused by the
    Thus, the use of Agisoft Meta Shape software and                     existing faults in the Queretaro valley have been re-
ground control points (GCP) added to the high-quality                    ported. These failures are mainly associated to the
images contribute to improving the precision of the                      graben with shape rectangular bounded by the fault
DEM obtained (Jimenez et al., 2017).                                     system with north-south direction and normal displa-
    The use of distributed ground control points (GCP),                  cement. The western and eastern trace can be located
allows greater control in the plani-altimetry correction                 in the San Bartolome fault and the Oriental fault (Ca-
of the images, producing acceptable errors (Liew et al.,                 rreón et al., 2005). Pacheco (2007) carried out a gravi-
2012; Jimenez et al., 2017; Martinez et al., 2018).                      metric study, using six profiles on faulting, constructing
    The software allows data processing and the gene-                    gravimetric, and gradient anomaly maps in order to
ration of final models. However, these procedures                        characterize the phenomenon on urban areas more
make it possible to compare the methodologies with                       precisely, quickly, and easy. On the other hand, Civil
respect to the conventional methods. The bibliographic                   Protection of Queretaro (2015) created a Risk Atlas (Fi-
information is still scarce, and dispersed; the topogra-                 gure 1) in which it registers the vulnerability, risk of
phy obtained by UAV requires case studies that contri-                   subsidence, and fracturing of the subsoil according to
bute to validate the precision that can be achieved using                the location of each site, considering the proximity to
this instrument, and the support of control points (Ji-                  the faults but this Atlas has an accuracy of 50 m in
menez et al., 2017).                                                     some areas and it does not detect the influence area of
    Having said the above, this article describes a proce-               each failure nor the new ones. This Atlas is presented
dure to create a DEM and orthomosaic using a UAV                         herein as Figure 1.

2               I ngeniería I nvestigación   y   T ecnología , volumen XXII (número 1), enero-marzo 2021: 1-12 ISSN 2594-0732 FI-UNAM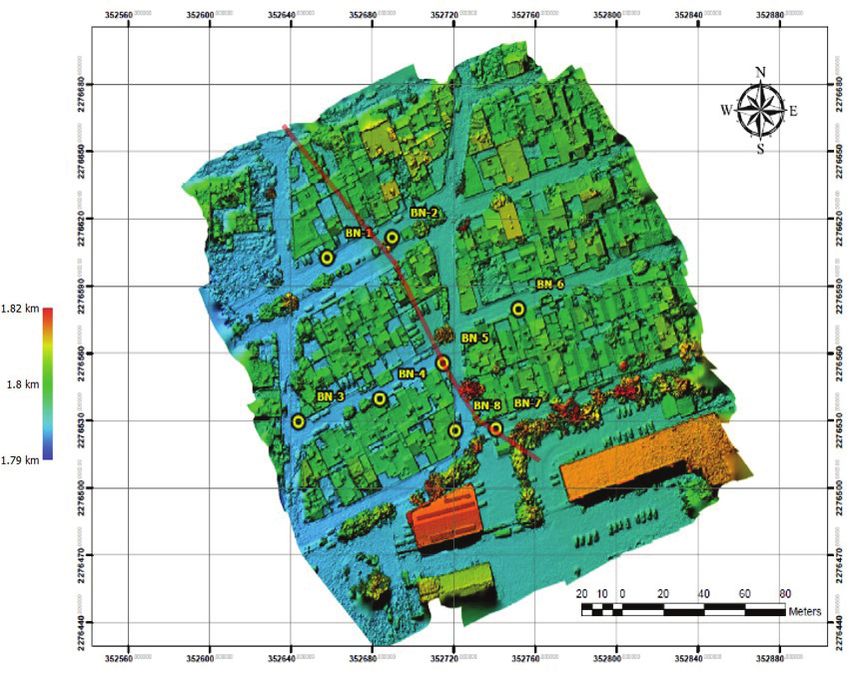
https://doi.org/10.22201/fi.25940732e.2021.22.1.006
                             Galeana-Pérez Víctor Manuel, Chávez-Alegría Omar, Medellin-Aguilar Gerardo

                                                                                              Figure 1. Sections with their respective
                                                                                              GCP. Adapted from Civil Protection
                                                                                              (2015)

UAV                                                                      cial Mexican Standard NOM-107-SCT3-2019 through
                                                                         Table 1.
The UAV is used to obtain aerial images in less time at
different heights, while maintaining high resolution in
                                                                         GPS
digital photogrammetry (Colomina & Molina , 2014).
The UAVs are mainly made up of two main elements:                        GPS are autonomous devices because they have their
an aerial platform, equipped with a camera and a navi-                   own reference system and time scale using different
gation system, and a remote control from which aerial                    reference systems expressing the positions of their sa-
activity is programmed and monitored by using a mo-                      tellites (Llenera & Suárez, 2015); however, it is neces-
bile device (Escalante et al., 2016). On the other hand, to              sary to have a computer network to be able to
determine the video recording mode for UAV, there are                    determine by triangulation, altitude, longitude and
certain parameters such as: stabilization, location, navi-               latitude of an object on the earth’s surface (Cortés et
gation, and identification of objects (Barmpounakis et                   al., 2010).
al., 2016).                                                                  On the other hand, it is necessary to consider that
     The use of UAVs in Mexico is regulated by the SCT                   sometimes they have measurement errors. Some of the
(Secretaría de Comunicaciones y Transportes, 2019),                      main factors are: meteorological phenomena, the im-
who classifies the RPAS (Remotely Piloted Aircraft                       precision of the clocks, unforeseen electrical interferen-
System) commonly known as drones through the Offi-                       ces, multi-path errors, among others (Cortés et al., 2010).

           I ngeniería I nvestigación   y   T ecnología , volumen XXII (número 1), enero-marzo 2021: 1-12 ISSN 2594-0732 FI-UNAM         3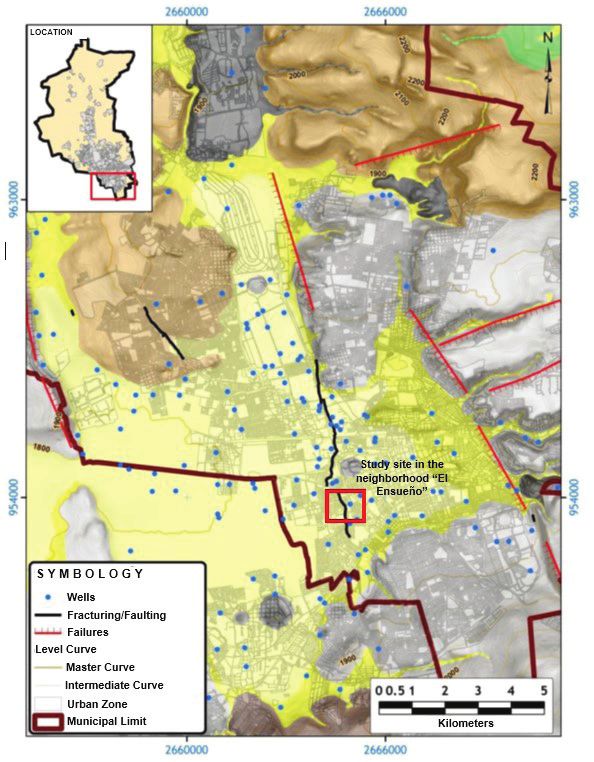
https://doi.org/10.22201/fi.25940732e.2021.22.1.006
On the measure of land subsidence throughout DEM and orthomosaics using GPS and UAV
Table 1. The classification of the UAV according to their weight
Classification of Remotely Piloted Aircraft Systems
Compliance with the Numeral of
Maximum takeoff weight Use
this Official Mexican Standard
Recreational 4.10, 4.11 y 5.1.
Equal to, or less than
Micro RPAS Private non-commercial
2 kg 4.10, 4.11, 5.1, 5.2 y 8*
or commercial
Recreational 4.10, 4.11 y 6.1.
Greater than 2 kg, and
Small RPAS Private non-commercial
up to 25 kg 4.10, 4.11, 6.2 y 8*
or commercial
Recreational 4.10, 4.11 y 7.1.
Greater than 25 kg Big RPAS Private non-commercial
4.10, 4.11, 7.2 y 8*
or commercial
*Number 8 is only applicable when special operations are required
Ground Control Point (GCP) and objects present in it. DEM are frequently used in
studies related to geology, the environment, enginee-
GCP is a physical ground site, established within a ring and architecture (Akturk & Altunel, 2018).
coordinate system and which can be used as a guide According to the aforementioned, there are two types
(Cruz, 2008). The purpose of these points is to provide of DEM: one is the Digital Surface Model (DSM) which
information for the georeference process of space ob- represents all the existing or present elements on the sur-
jects and phenomena of interest according to the needs face of the earth (vegetation, buildings, and, infrastructu-
of each project; Liew et al. (2012), mentions that GCPs re). It could be understood that it represents the
are used for rectification of aerial images in a non-para- elevations of the surface layer of objects on the ground
metric approach. and are used to interpret the shapes of the reliefs and
On the other hand, it is necessary to have a good some elements it contains. These have being useful for
distribution in the study area and a number of GCPs 3D modeling of telecommunications, urban planning
that contribute to have a better precision in photogram- and aviation, among others; and the Digital Terrain Mo-
metry obtained by UAV (Martínez et al., 2018). del (DTM), through which the shape of the terrain is pro-
duced. Once all the foreign elements were removed. It
represents the elevation values of the lowest points of the
Orthomosaics surface or terrain, being very useful to locate geographic
A mosaic, according to Cheng et al. (2007) is the set of elements and natural features such as rivers, ridge lines
images taken from one or more cameras, through which and breaks, among others (Fuentes et al., 2012).
it is possible to make an overlap between them, joining
and combining them in a single image and, by expan- Materials and methods
ding the range of vision of the scene. When the mosaic
Study area
is corrected by the distortions generated by the relief
even with the objects in it. These are called orthomosaic The study area is located in Santiago de Queretaro,
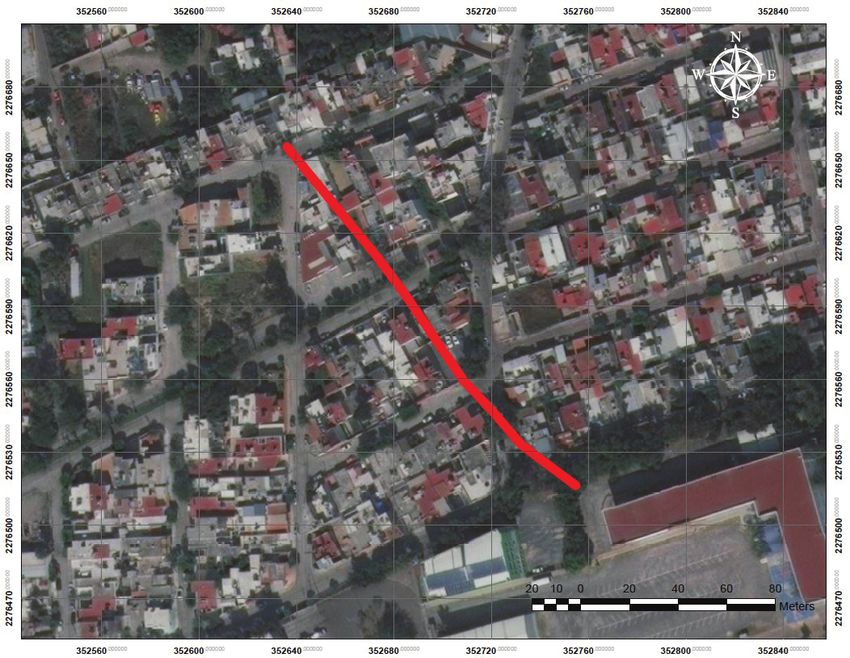
(Escalante et al., 2016). Queretaro, Mexico (Figure 2); it presents a rugged topo-
graphy due to continuous movements, since there is a
Digital Elevation Model (DEM) fault due to subsidence, also known by other authors as
a stress crack, located in the Queretaro valley, which is
According to Instituto Nacional de Estadística y Geo- shown in Figure 3 and Figure 4, crossing the neighbor-
grafía (INEGI, 2019) in Mexico a DEM is a visual and hood of “El Ensueño”.
mathematical representation of the height values, rela- This area presents vertical displacements of bet-
ted to the mean sea level, which makes it possible to ween 0.20 to 0.90 centimeters with NE-SW and NW-SE
characterize the shapes of the relief and the elements orientation. One of the most affected areas is the “El En-
4 I ngeniería I nvestigación y T ecnología , volumen XXII (número 1), enero-marzo 2021: 1-12 ISSN 2594-0732 FI-UNAM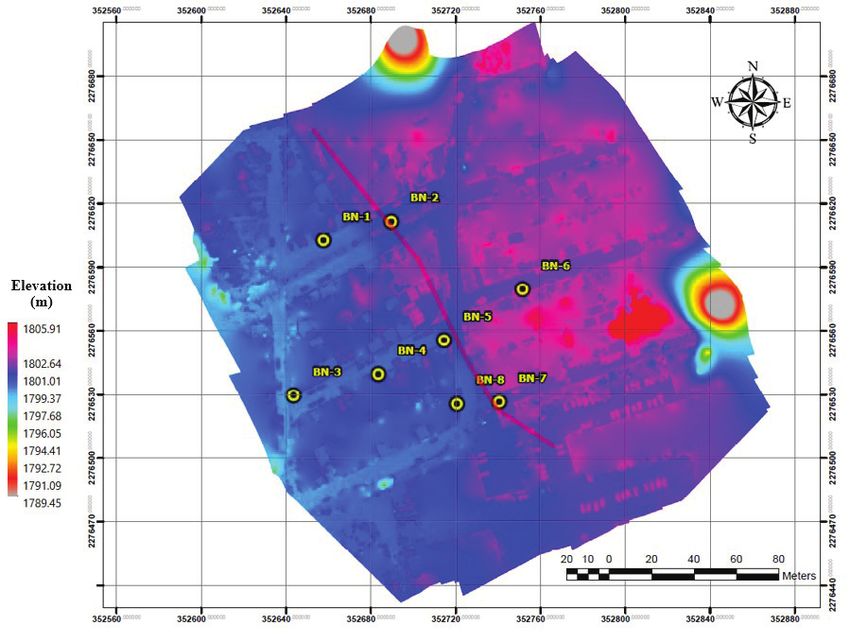
https://doi.org/10.22201/fi.25940732e.2021.22.1.006
                             Galeana-Pérez Víctor Manuel, Chávez-Alegría Omar, Medellin-Aguilar Gerardo

                                                                                              Figure 2. Macro and micro location of
                                                                                              Santiago de Queretaro

                                                                                              Figure 3. Fault system in the Central
                                                                                              Zone and location in the “El Ensueño”
                                                                                              (Protección Civil, 2015)

                                                                                              Figure 4. Micro-localization of the area
                                                                                              of study “El Ensueño”, where the fault is
                                                                                              shown by subsidence that crosses it

           I ngeniería I nvestigación   y   T ecnología , volumen XXII (número 1), enero-marzo 2021: 1-12 ISSN 2594-0732 FI-UNAM          5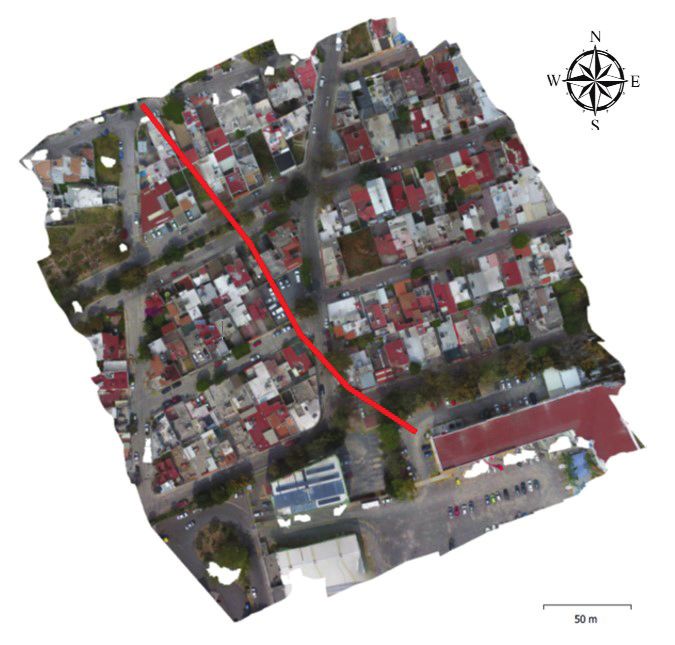
https://doi.org/10.22201/fi.25940732e.2021.22.1.006
                       On   the measure of land subsidence throughout   DEM   and orthomosaics using   GPS   and   UAV

sueño” area, which is located inside the ellipsoid (Figu-                 placed at the study site. Each point was measured for
re 5) WGS 84 (World Geodetic System, 1984) with the                       one hour in order to have better data quality and more
parameters of semi-major axis 6378137.00 and semi-                        reliable precision. So, the measurement error can be
minor axis 6356752.314, and is located in the zone 14                     reduced.
with UTM coordinates 2276546.01 N and 352689.16 E,
where an area of 18,288 m2 is considered (shown in Fi-
                                                                          Flight planning and image acquisition
gure 3, inside a box).
                                                                          The UAV flight plan was carried out on November 26,
Placements of ground control points                                       2019 at 12:40 pm, in a time of 6 min and 26 s, with di-
                                                                          mensions of 127 x 144 m and an overlap of images of
Eight GCPs were located at the study area in order to                     80 % and 70 %, at an altitude of 60 m. The flight plan
have greater control over the planimetry and altimetry                    carried out by the UAV at the study site is shown in Fi-
correction of the images. GCPs were made up of steel                      gure 11, all through the PIX4D mobile application.
plates welded to rods with an iron plate over it. This is
shown in Figure 6. So, they were anchored to the
                                                                          Data processing
ground and could be measured with a dual-frequency
GPS (Figure 7).                                                           Two software were used to process the data obtained in
    As a result of the placement of the GCPs in the “El                   the field: the Topcon Tools for the processing of the
Ensueño” neighborhood, the following location sketch                      data obtained by the GPS in the static method, and the
of the eight GCPs used is obtained, shown in Figure 8.                    Agisoft Metashape, for the processing of the images ob-
    Furthermore, considering that the GCPs would not                      tained by the UAV.
be visible during the UAV flight, the use of tarps with a
multi-colored target was implemented to facilitate the
                                                                          Ground control points
identification of the GCPs.
                                                                          To process the eight GCPs, it was downloaded from the
Data collection                                                           Geodesic Network of Mexico (RGNA) of INEGI. The
                                                                          measurements of the UQRO station with the coordina-
Regarding the data collection two devices were used: a                    tes UTM 2277537.296 N and 352773.121 E, using the
UAV DJI Phantom 4, with a 20 megapixel image sensor,                      WGS 84 ellipsoid for the post-processing of the data.
a transmission range of 7 kms and autonomy of 30 m;                       This station is located in the Engineering Department
and a Sokkia GRX2 GPS, with Magnet Field software                         of the Autonomous University of Queretaro (UAQ),
and precision in static mode: Only: L1: H: 3mm + 0.8                      which it is the active station of the State of Queretaro.
ppm, V: 4mm + 1.0 ppm.                                                    These data where obtained in RINEX format. It were
                                                                          processed with the UNERINEX software from INEGI to
Measurement of ground control points                                      join the 24 h measurements by using only those that
                                                                          were made on November 21 and 22, 2019. The Topcon
The GCPs were measured on November 21 and 22,                             Tools software was used in order to obtain the correc-
2019, for which the Sokkia GRX2 GPS was used in sta-                      tion the coordinates a greater precision in them and
tic mode (Figures 9 and 10), in each of the eight points                  that these are linked to the INEGI RGNA.

Figure 5. Reference ellipsoid. Adapted from             Figure 6. Placement of GCP in the       Figure 7. Final result of the
(Olaya, 2014)                                           “El Ensueño                             placement of the GCP

6               I ngeniería I nvestigación   y   T ecnología , volumen XXII (número 1), enero-marzo 2021: 1-12 ISSN 2594-0732 FI-UNAM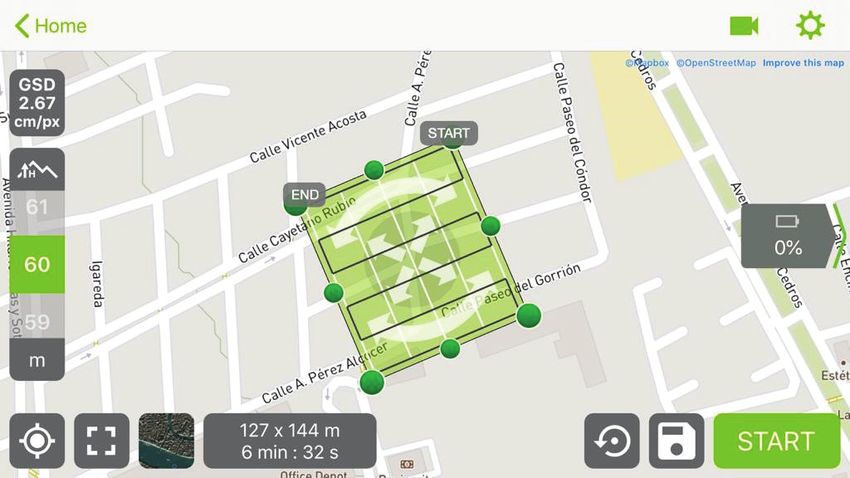
https://doi.org/10.22201/fi.25940732e.2021.22.1.006
                             Galeana-Pérez Víctor Manuel, Chávez-Alegría Omar, Medellin-Aguilar Gerardo

                                                                                                      Figure 10. GCP measurement in
                                                                         Figure 9. GCP and GRX2       the “El Ensueño” with the Sokkia
Figure 8. Location of the GCPs in the “El Ensueño”                       GPS used                     GRX2 GPS

                                                                                              Figure 11. UAV flight plan in the “El
                                                                                              Ensueño”

                            Images                                          Subsequently, the images were oriented with the
                                                                         coordinates obtained; as a result, the dense point cloud
For the processing of the images obtained by means of                    can be obtained, the model can be textured, the DEM
the UAV, the Agisoft MetaShape software was used                         and the orthomosaic can be acquired through the diffe-
where, firstly, the photographs obtained with the UAV                    rent integrated options that the software has.
were added, followed by the eight GCP obtained by
means of the GPS data, and these were introduced as                                                Results
markers points, the coordinates obtained from the pro-
cessing of the points with Topcon Tools were establis-                   The results obtained from the processing of the data
hed, although it is worth mentioning that these points                   used in this article by means of GPS and UAV for obtai-
were attached manually, identifying in each photogra-                    ning DEM and orthomosaics are presented below.
ph included in the processing, the GCP to have a minor                       The GCPs taken by the Sokkia GRX2 GPS in static
error in the process; after that, the option of the cameras              mode, processed with Topcon Tools software and geo-
in each of the photographs was immediately unmar-                        referenced to the INEGI RGNA, are shown in Figure 12
ked, so that the coordinates for the model are those of                  and Figure 13. The link of the active station of Quereta-
the GCP and not those of the GPS of the UAV, because                     ro and the GCPs are shown in UTM coordinates.
the latter has with many variations due to changes in                        It should be noted that the processing was done se-
climatic and environmental conditions, obstructions                      parately, because the DEMO version of the software
and sensors, among others.                                               was used as it did not have the license.

           I ngeniería I nvestigación   y   T ecnología , volumen XXII (número 1), enero-marzo 2021: 1-12 ISSN 2594-0732 FI-UNAM      7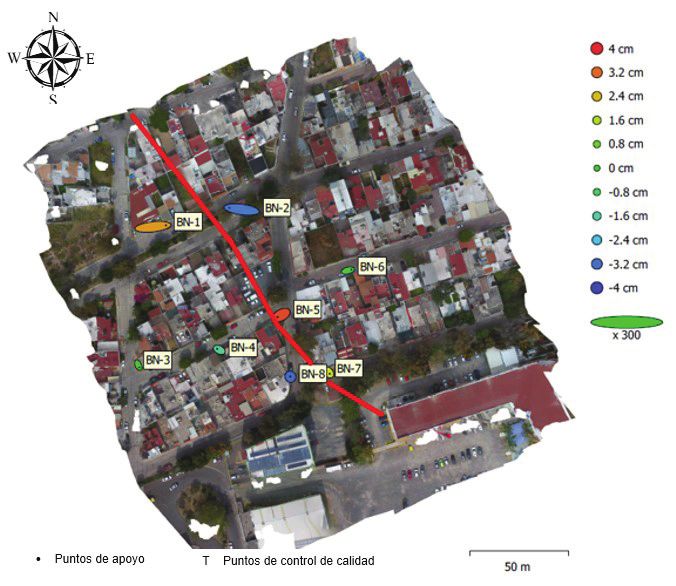
https://doi.org/10.22201/fi.25940732e.2021.22.1.006
                       On   the measure of land subsidence throughout   DEM   and orthomosaics using   GPS   and   UAV

                                                                                                Figure 12. Processing of GCPs 1 to 4 with
                                                                                                Topcon Tools software

                                                                                                Figure 13. Processing of GCPs 5 to 8 with
                                                                                                Topcon Tools software

As a result, the coordinates and elevations of the GCPs                  Table 2. GCP coordinates and elevations obtained
were obtained, such information is presented in Table 2.                     Ground              UTM coordinates
                                                                                                                                Elevation
    On the other hand, the images that were obtained by                      Control
                                                                                              North                   East         (m)
the UAV were processed with the Agisoft MetaShape                          Point (GCP)
software, through which a dense point cloud anchored                           BN-1         2276603.236            352658.586   1800.060
to the GCP obtained by the GPS was created for more                            BN-2         2276612.125            352690.924   1801.227
precision of the model, finally acquiring the orthomosaic
                                                                               BN-3         2276530.970            352644.987   1799.863
of the study site, which is shown in Figure 14.
    Likewise, the estimation of the GCP errors was ob-                         BN-4         2276540.403            352684.722   1800.074
tained as shown in Figure 15. The report generated by                          BN-5         2276556.601            352715.472   1800.889
Agisoft MetaShape where each color indicates the error                         BN-6         2276580.706            352752.989   1801.617
in Z axis represented in the color palette on the right                        BN-7         2276527.735            352741.959   1801.108
side, which are indicated in centimeters. The size and
                                                                               BN-8         2276526.363            352721.866   1800.227
shape of the ellipse represents the error in X and Y, the-
se errors are considered from the GCPs who are recog-
nized as support points according to the software                        In Table 3 each error for each GCP in the different di-
nomenclature. Therefore, when the images processed                       mensions are shown. The calculation of the errors were
were obtained during the flight. These can be affected                   obtained by means of the differences between the sour-
by the different light conditions and obstacles that the                 ce camera and the estimated coordinates of the GPS. By
captured images may present.                                             considering a good alignment of the images and the
    Errors were automatically obtained by the software,                  real coordinates obtained by the high-precision GPS.
using the formula for the calculation of the Mean Square                 As a result of which a lower final value is obtained at
Error (RMSE) by considering the square error in each of                  0.6 re-projection pixels for all points. It is considered
the dimensions with respect to its projection on the ima-                that if the error obtained is greater than 1 pixel no co-
ges that are shown in the previous in Figure 15. The                     rrect alignment between the images and the coordina-
GCPs presented in Figure 15 are shown below in Table 3.                  tes is implied.

8               I ngeniería I nvestigación   y   T ecnología , volumen XXII (número 1), enero-marzo 2021: 1-12 ISSN 2594-0732 FI-UNAM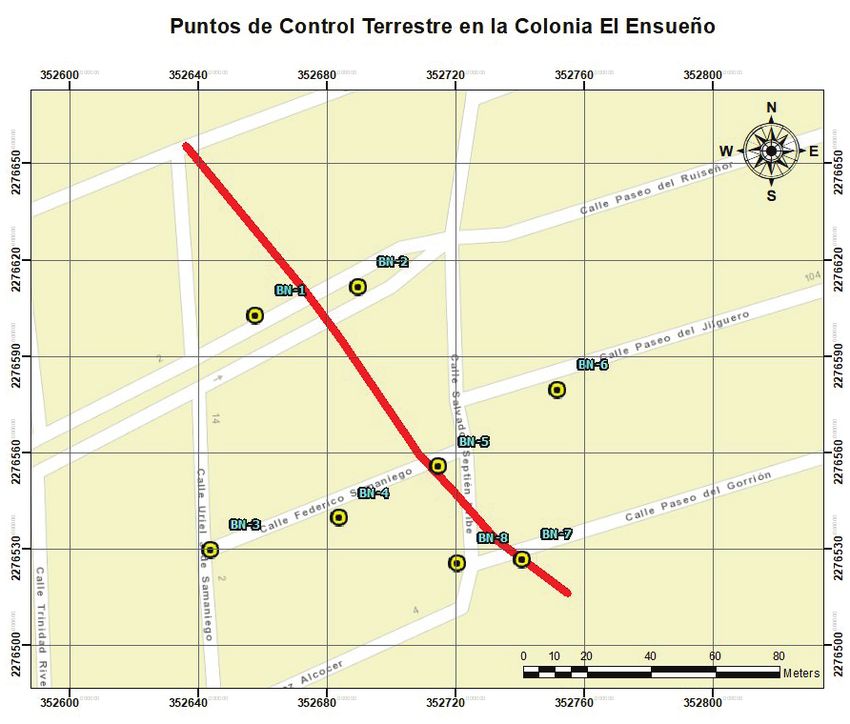
https://doi.org/10.22201/fi.25940732e.2021.22.1.006
                                 Galeana-Pérez Víctor Manuel, Chávez-Alegría Omar, Medellin-Aguilar Gerardo

Figure 14. Orthomosaic from the “El Ensueño” obtained by                   Figure 15. Location of each GCP and error estimation using
Agisoft Metashape Processing                                               Agisoft MetaShape software

Table 3. GCP X-East, Y-North, Z-Altitude
     GCP             Error X (cm)         Error Y (cm)     Error Z (cm)    Total (cm)          Image (pix)
     BN-1              4.44092                0.50457        2.74891        5.24718             0.520 (14)
     BN-2              -4.19617               0.54762       -3.11089        5.25218             0.366 (21)
     BN-3              0.33765                -0.74040        0.1484        0.82718             0.111 (4)
     BN-4              -0.70271               0.35078       -1.36845        1.57782             0.213 (16)
     BN-5              -1.21713               -0.64384       3.52810        3.78727             0.251 (33)
     BN-6              1.15467                0.28454       -0.33718        1.23609             0.169 (30)
     BN-7              0.42314                -0.46419       1.91749        2.01775             0.343 (25)
     BN-8              -0.06164               0.09154       -3.24125        3.24313             0.359 (19)
     Total             2.26205                0.49308        2.39459        3.33077               0.311

Finally, the digital elevation models of the study site                    it is possible to appreciate the unevenness by conside-
are shown in Figure 16 and 17. A maximum height of                         ring that it is approximately between 90 to 120 cm,
1,819.87 m and a minimum height of 1,795.59 m for the                      which continuous displacements have been occurred
DSM were showed. A resolution of 0.0463611 m / pix,                        causing different building’s damage during almost
and a point density of 465,256 points per m2, and for the                  thirty years.
DTM a maximum height of 1805.91 m and a minimum                                 The parameters and the information mentioned
of 1789.45 m were obtained. The DEM is presented in                        above were obtained with the flight characteristics of
Figure 16. It is better known as the Digital Surface Mo-                   the UAV shown in Table 4.
del (DSM) because it represents all the elements present
on the study site or on the earth’s surface such as: buil-                                         Conclusions
dings, vegetation, automobiles, infrastructure, among
others. Figure 17 is called the Digital Terrain Model                      The UAVs have recently taken on an important role
(DTM). It shows a classification of the point cloud by                     within engineering and research. Different authors
terrain. Only those points that belong to the natural te-                  have used the UAVs to carry out simple and sometimes
rrain, without considering all those points that belong                    more complicated tasks, some of them have been: topo-
to the infrastructure and vegetation are presented.                        graphic surveys by means of aerial photogrammetry,
    As can be seen in the Figure 17. The range of colors                   monitoring of large areas with landslides, emergency
of blue varies in the central part of the DEM because in                   service in rescues from natural disasters, among other
that area there is a subsidence transverse fault that                      innovative uses. Due to the fact that their use is quite
completely crosses the “El Ensueño” neighborhood. So,                      simple and they demand few resources for it use. It is

             I ngeniería I nvestigación   y   T ecnología , volumen XXII (número 1), enero-marzo 2021: 1-12 ISSN 2594-0732 FI-UNAM      9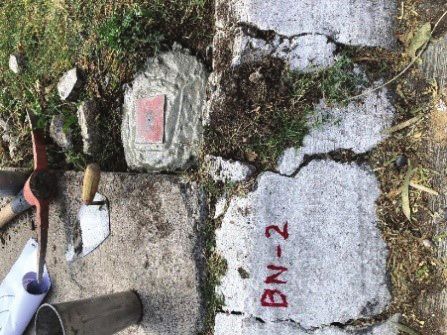
https://doi.org/10.22201/fi.25940732e.2021.22.1.006
                         On    the measure of land subsidence throughout   DEM   and orthomosaics using   GPS   and   UAV

                                                                            being governed by the new (published past November
                                                                            2019) established laws or regulations. Furthermore,
                                                                            they are considered an excellent alternative to acquire
                                                                            high resolution images and other data, in a short time
                                                                            in any environment.
                                                                                On the other hand, GPS has also become an exce-
                                                                            llent tool for obtaining points at any physical site on
                                                                            earth, in order to accurately obtain geographic coordi-
                                                                            nates.
                                                                                According to the aforementioned. It is exposed in
                                                                            the different sections of this article, the use of both tech-
                                                                            nologies is complementary, increases precision and re-
                                                                            duces data collection time in the field. However, the use
                                                                            of the UAV independently has some disadvantages
                                                                            when used to carry out photogrammetric surveys. Be-
Figure 16. Reconstruction of the DSM                                        cause the integration of GPS and UAVs have multiple
                                                                            variations due to the geometry of the satellite mainly
                                                                            due to the different weather conditions and the quality
                                                                            of the equipment.
                                                                                As can be seen in Table 2, the elevations of the GCP
                                                                            were obtained quickly and easily, repeating this step
                                                                            for a certain time, a monitoring of the complete area
                                                                            could be carried out in order to observe and unders-
                                                                            tand its behavior during related phenomena with dis-
                                                                            placements. On the other hand, in Table 3 the different
                                                                            errors can be observed for each GCP by considering the
                                                                            pixels of each one of the photographs use. As an exam-
                                                                            ple GCP called as BN-1 presents an error in centimeters
                                                                            at X = 4.44092, Y = 0.50457 and Z = 2.74891.
                                                                                It must be mentioned that these errors are automa-
                                                                            tically calculated by the software using the formula of
                                                                            the root mean square error (RMSE). This depends on
                                                                            how a pixel is altered in the processing, or in the cap-
Figure 17. Reconstruction of the DTM
                                                                            ture of the images. The advantage of this process
                                                                            through Agisoft MetaShape is that it shows the total
Table 4. UAV flight characteristics                                         errors in the X, Y and Z dimensions. It can be seen that
                    UAV flight characteristics                              these errors depends on the number of images to
       Number of images                             103                     which they are georeferenced during post-processing.
                                                                            It can be seen that GPS and UAV are two potential ele-
       Flight altitude (m)                         60.6712
                                                                            ments for obtaining DEM and topography in a short
     Soil resolution (m/pix)                      0.0231806
                                                                            period of time, and with low use of technical person-
      Covered area (km2)                          0.0504839                 nel to carry out measurements and operation of the
       Mooring numbers                              7284                    flight, in addition to the low requirements that are
           Projection                              55033                    needed for the processing of all the data.
           Error (pix)                             1.38462                      The most important impact is that the Digital Te-
         Camera model                      FC330 (3.61 mm)                  rrain Model (DTM) shows a spectacular difference
                                                                            between one side and another of the failure zone,
       Camera resolution                      4000 x 3000
                                                                            which can indicates that this is a perfect tool to distin-
        Focal length (m)                            3.61
                                                                            guish the particular affected areas with to use in an
       Pixel size (micron)                 1.56192 x 1.56192                Atlas risk for urban areas with construction over failu-
                                                                            res due to land subsidence phenomena were detected
                                                                            or not.

10               I ngeniería I nvestigación   y   T ecnología , volumen XXII (número 1), enero-marzo 2021: 1-12 ISSN 2594-0732 FI-UNAM
https://doi.org/10.22201/fi.25940732e.2021.22.1.006
Galeana-Pérez Víctor Manuel, Chávez-Alegría Omar, Medellin-Aguilar Gerardo
References Applied Earth Observation and Geoinformation, 83. https://doi.
org/10.1016/j.jag.2019.101916
Akturk, E. & Altunel, A. (2018). Accuracy assesment of a Low- Hemmelder, S., Marra, W., Markies, H. & De Jong, S. M. (2018).
Cost UAV Derived Digital Elevation Model (DEM) in a highly Monitoring river morphology & bank erosion using UAV ima-
broken and vegetated terrain. Measurement, 136, 382-386. gery - A case study of the river Buëch, Hautes-Alpes, France.
https://doi.org/10.1016/j.measurement.2018.12.101 International Journal of Applied Earth Observation and Geoinforma-
Barmpounakis, E. N., Vlahogianni, E. I. & Golias, J. C. (2016). Un- tion, 73, 428-437. https://doi.org/10.1016/j.jag.2018.07.016
manned aerial aircraft systems for transportation enginee- INEGI. (2019). Modelos Digitales de Elevación (MDE) - Descripción.
ring: Current practice and future challenges. International ISPRS. (2004). Approved resolutions of the XXth ISPRS Congress-
Journal of Transportation Science and Technology, 5(3), 111-122. Istanbul. International Archives of the Photogrammetry, Re-
https://doi.org/10.1016/j.ijtst.2017.02.001 mote Sensing and Spatial Information Science, 35, 40.
Carreón, D., Cerca, M., Luna, L. & Gámez, F. J. (2005). Influencia Jimenez, S. I., Ojeda, W., Ontiveros, R. E., Flores, J., Marcial, M. J.
de la estratigrafía y estructura geológica en el flujo de agua & Robles, B. D. (2017). Quantification of the error of digital
subterránea del Valle de Querétaro. Revista Mexicana de terrain models derived from images acquired with UAV. Inge-
Ciencas Geológicas, 22(1), 1-18. niería Agrícola y Biosistemas, 9(2), 85-100. http://dx.doi.
Cheng, Y., Xue, D., Cheng, Y. & Li, Y. (2007). A fast mosaic ap- org/10.5154/r.inagbi.2017.03.007
proach for remote sensing imagen. International Conference Liew, L. H., Wang, Y. C. & Cheah, W. S. (2012). Evaluation of con-
on Mechatronics and Automation, 2009-2013. Retrieved from trol points’ distribution on distortions and geometric transfor-
https://doi.org/10.1109/ICMA.2007.4303859 mations for aerial images rectification. Procedia Engineering,
Colomina, I. & Molina, P. (2014). Unmanned aerial systems for 41, 1002-1008.
photogrammetry and remote sensing: A review. ISPRS Jour- Llenera, E. & Suárez, E. (2015). Sistema de navegación para personas
nal of Photogrammetry and Remote Sensing, 92, 79-97. https://doi. no videntes, mediante el uso del sistema de posicionamiento
org/10.1016/j.isprsjprs.2014.02.013 híbrido (GPS & GLONAS), para la Universidad de las Fuerzas
Cortés, J., Medina, F. & Mendoza, J. (2010). Implementación de un Armadas-ESPE. 1-12.
sistema de posicionamiento global utilizando el módulo GPS Luccier, A., M. de Jong, S. & Turner, D. (2013). Mapping landsli-
SIRFSTARIII. MTI-6 DE STARSNAV. Scientia et Technica, XVI de displacements using Structure from Motion (SfM) and
(45), 233-238. image correlation of multi-temporal UAV photography. Pro-
Cruz, M. (2008). Caracterización de puntos de control en teledetección: gress in Physical Geography, 38(1), 97-116. https://doi.
Aplicación a la corrección geométrica automática de imágenes org/10.1177%2F0309133313515293
NOAA-AVHRR GAC-5 KM. (Tesis de Doctorado). Universi- Martínez, P., Agüera, F., Carvajal, F., Mesas, F., García, A. & Pérez,
dad de Almería, Almería, España. F. (2018). Assessment of UAV-photogrammetric mapping ac-
Dering, G. M., Micklethwaite, S., Thiele, S. T., Vollgger, S. A. & curacy based on variation of ground control points. Internatio-
Crude, A. R. (2019). Review of drones, photogrammetry and nal Journal of Applied Earth Observation and Geoinformation, 72,
emerging sensor technology for the study of dykes: Best prac- 1-10. https://doi.org/10.1016/j.jag.2018.05.015
tises and future potential. Journal of Volcanology and Geothermal Medellín, G. (2015). Evaluación y proyección de daños por el fenómeno
Research, 373, 148-166. https://doi.org/10.1016/j.jvolgeo- de subsidencia en la Avenida 5 de Febrero y propuesta de solución
res.2019.01.018 (Tesis de Maestría). Universidad Autónoma de Querétaro,
Escalante, J. O., Cáceres, J. J. & Porras, H. (2016). Ortomosaicos y Santiago de Querétaro, Querétaro. http://ri-ng.uaq.mx/hand-
modelos digitales de elevación generados a partir de imáge- le/123456789/375
nes tomadas con sistemas UAV. Revista Tecnura, 20(50), 119- Mills, S. & McLeod, P. (2013). Global seamline networks for ortho-
140. mosaic generation via local search. ISPRS Journal of Photo-
Forlani, G., Dall´Asta, E., Diotri, F., Mora di Cella, U., Roncella, R. & grammetry and Remote Sensing, 75, 101-111. https://doi.
Santise, M. (2018). Quality assessment of DSMs produced from org/10.1016/J.ISPRSJPRS.2012.11.003
UAV flights georeferenced with on-board RTK positioning. Re- Niethammer, U., James, M. R., Rothmund, S., Travelletti, J. &
mote Sensing, 10(311). https://doi.org/10.3390/rs10020311 Joswig, M. (2012). UAV-based remote sensing of the Super-
Fuentes, J. E., Bolaños, J. A. & Rozo, D. M. (2012). Modelo digital Sauze landslide: Evaluation and results. Engineering Geology,
de superficie a partir de imágenes de satélite Ikonos para el 128, 2-11. https://doi.org/10.1016/j.enggeo.2011.03.012
análisis de áreas de inundación de Santa Marta, Colombia. Olaya, V. (2014). Sistemas de información geográfica. España: Crea-
Boletín de Investigaciones Marinas y Costeras, 41(2), 251-266. teSpace Indepent Publising Platform.
Hastaoğlu, K. Ö., Gül, Y., Poyraz, F. & Kara, B. C. (2019). Monito- Pacheco, J. (2007). Modelo de subsidencia del valle de Querétaro y pre-
ring 3D areal displacements by a new methodology and soft- dicción de agrietamientos superficiales (Tesis de Doctorado). Uni-
ware using UAV photogrammetry. International Journal of
I ngeniería I nvestigación y T ecnología , volumen XXII (número 1), enero-marzo 2021: 1-12 ISSN 2594-0732 FI-UNAM 11https://doi.org/10.22201/fi.25940732e.2021.22.1.006
On the measure of land subsidence throughout DEM and orthomosaics using GPS and UAV
versidad Autónoma de México, Santiago de Querétaro,
Querétaro.
Patterson, T., McClean, S., Morrow, P., Parr, G. & Luo, C. (2014).
Timely autonomous identification of UAV safe landing zones.
Image and Vision Computing, 32, 568-578. https://doi.
org/10.1016/j.imavis.2014.06.006
Protección Civil. (2015). Atlas de Riesgos del Municipio de Queré-
taro 2015. Santiago de Querétaro, Querétaro, México.
Secretaría de Comunicaciones y Transportes. (2019). Requeri-
mientos para operar un sistema de aeronave pilotada a dis-
tancia (RPAS) en el espacio aéreo mexicano. Norma Oficial
Mexicana NOM-107-SCT3-2019. Diario Oficial de la Federa-
ción.
Shi, J., Wang, J. & Xu, Y. (2011). Object-Based change detection
using georeferenced UAV images. ISPRS-International archives
of the photogrammetry, remote sensing and spacial information
sciences, 38, 177-182. https://www.researchgate.net/deref/
http%3A%2F%2Fdx.doi.org%2F10.5194%2Fisprsarchives-
XXXVIII-1-C22-177-2011
Siebert, S. & Teizer, J. (2014). Mobile 3D mapping for surveying
earthwork projects using an Unmanned Aerial Vehicle (UAV)
system. Automation in Construction, 41, 1-14. https://www.resear-
chgate.net/deref/http%3A%2F%2Fdx.doi.org%2F10.1016%2Fj.
autcon.2014.01.004
Xiang, H. & Tian, L. (2011). Development of a low-cost agricultu-
ral remote sensing system based on an autonomous unman-
ned aerial vehicle (UAV). Biosystems Engineering, 108(2),
174-190. https://doi.org/10.1016/j.biosystemseng.2010.11.010
12 I ngeniería I nvestigación y T ecnología , volumen XXII (número 1), enero-marzo 2021: 1-12 ISSN 2594-0732 FI-UNAMYou can also read


