A Light-weight Solution for Real-Time Dengue Detection using Mobile Phones
←
→
Page content transcription
If your browser does not render page correctly, please read the page content below
A Light-weight Solution for Real-Time Dengue
                Detection using Mobile Phones

  Jerrid Matthews1, Rajan Kulkarni2, George Whitesides3, Majid Sarrafzadeh1, Mario
                            Gerla1, Tammara Massey1

    1
     Computer Science Department, University of California, Los Angeles, Los Angeles, CA
         2
           School of Medicine, University of California, Los Angeles, Los Angeles, CA
     3Department of Chemistry and Chemical Biology, Harvard University, Cambridge, MA

                     {matth122,rkulkarn,majid,gerla,tmassey}@cs.ucla.edu
                            {gwhitesides}@gmwgroup.harvard.edu

        Abstract. Dengue is a disease transmitted mostly from mosquito bites.
        Viral outbreaks have spread vastly across the world, however mostly
        found in warm climate areas. Innovative solutions have been developed
        to combat outbreaks. In developing countries, dengue detection kits are
        not affordable or always accessible. Thus traditional approaches are
        still used that are slow to diagnose and treat in time. We present a
        dengue detection solution that uses vision sensors in cellular phones, a
        lightweight object identification algorithm, and a novel paper based
        patch currently being manufactured by researchers at the Harvard
        School of Medicine and the Dengue Relief Foundation. Our dengue
        detection algorithm rapidly and economically diagnose dengue and
        leverage the power of mobile phones to transmit results to the Center
        for Disease Control (CDC) for further analysis. This novel approach is
        cost effective and can improve the quality of life in developing
        countries by accurately detecting dengue and providing data to the CDC
        for monitoring of dengue epidemics.

        Keywords: dengue, dengue detection, light-weight image processing
        approach, software development approach, dynamic software
        architecture

1 Introduction

Each year, there are approximately 100 million cases of dengue fever or dengue
hemorrhagic fever worldwide [3]. Dengue is also the most common arthropod-borne
infection worldwide with 50–100 million cases annually [10]. This mosquito born
viral disease spread in developing countries due to substandard housing, inadequate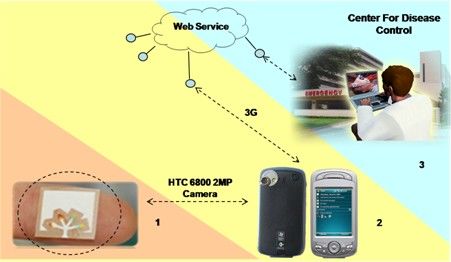
waste and water management, immigration, airborne travel, and deteriorating disease
prevention programs [4].
Disease prevention and control measures have been established for early detection
and monitoring of outbreaks. Unfortunately, the lack of organized resources and
capital in some countries have resulted in a number of increasing dengue viral
outbreak cases. [8]. Cost effective measures to accurately identify dengue can be
combined with rigorous efforts to adequately treat patients and reduce the number of
mosquito breeding sites. Accurate diagnosis of infection and effective preventive and
measures can reduce the number of outbreaks by as much as 30% [7].
We address the challenge of rapid and affordable detection of dengue disease in
countries with limited resources through a combination of low cost hardware and
innovative medical advances. Medical advances in dengue detection allow for dengue
to be accurately tested using an advanced medical bioassay patch developed by
researchers at Harvard School of Medicine [6] and the Dengue Relief Foundation
[14].
Our approach leverages optical sensors on a cellular phone to analyze the patch
results with a color identification algorithm given reference shades that classify the
level of dengue infection. The results of the test are displayed to the doctor or nurse.
Additionally, the information can be transmitted to the Center for Disease Control for
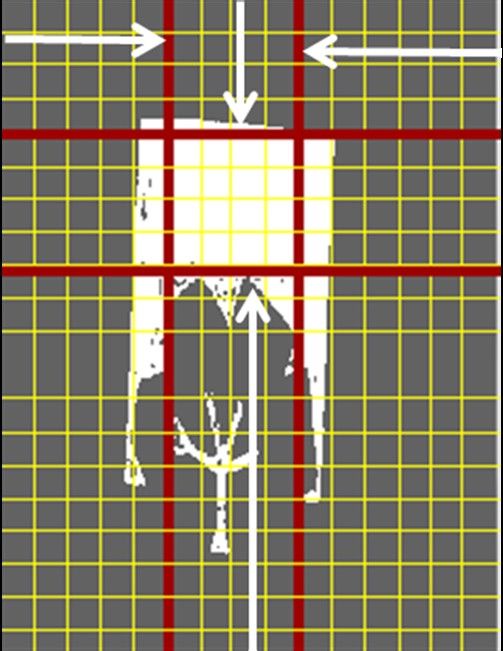
further analysis. An architectural diagram that shows the relationship between the
medical patch, camera phone, and CDC is shown in Figure 1.
Our proposed system can have a significant impact on how dengue is treated in
countries with limited resources.
The main contributions of our system are:
• a dengue testing algorithm that uses a $0.20USD medical patch and a cellular
telephone camera that displays the results to medical personnel and
• the transmission of data to the CDC or other prevention and control agencies
for surveillance and additional testing purposes.
The overall goal of mobile dengue detection is to improve the quality of life in
developing countries The overall goal of mobile dengue detection is to improve the
quality of life in developing countries through accurate disease diagnosis and
surveillance. The transmission of data to the CDC will enable particular strands of
dengue to be diagnosed and epidemic outbreaks can be more rapidly detected.
2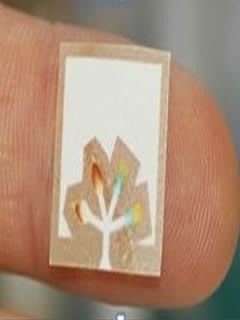
Figure 1: Architectural Overview of Mobile Dengue Detection for 1) Dengue Template 2)
     Embedded System Platform 3) Central Server at Center for Disease Control.

   In this paper, we describe related work in dengue detection. Then, we describe the
dengue disease in detail. Our approach for mobile dengue detection using the mobile
phone and a lightweight image processing algorithm is then explained. Lastly, we
summarize with an analysis of our process and conclusion normal text area, with a line
of about 5cm set immediately above them.

2 RELATED WORK

2.1 Dengue Testing
Researchers are developing many approaches that explore the newfound capabilities
of detecting diseases. Recently, researchers at UCLA developed a novel blood
analysis tool to detect HIV and Malaria with the Lensless Ultra-wide-field Cell
monitoring Array platform based on Shadow imaging (LUCAS) and a cellular phone
[9]. Introducing a small blood sample to three individual stacked trays placed on top
of the CMOS sensor of a cell phone, illuminated by coherent light from a Light
Emitting Diode (LED), researchers can expose distinctive signatures of blood cells
by filtering the wavelength of light that passes through the trays. Following light
filtering, images of the shadows cast from blood cells are then uploaded to the
LUCAS processing platform server and processed using template matching
algorithms to identify certain signatures of diseased blood cells. Previous approaches
involve a tedious process of using expensive microscopes to analyze blood cells and
examining each tray one by one to detect anomalies.
    LUCAS provides a novel approach to viral detection through microscopy, however
further research has found that polymerase chain reaction (PRC) assays are far more
effective for detecting specific types of dengue viral strands. This is evident through
the ability to construct specialized primer sequences, based upon the genomic
sequence of specific types dengue viral strands. These primers anneal to their

                                                                                     3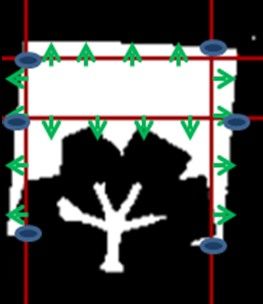
respective viral genome sequence, to isolate a specific dengue type [12]. LUCAS can
reveal dengue viral strands on the cell surface in addition to sometimes inside the cell,
however is not able to classify the viral strand types as efficiently as our dengue
patch. This enables our patch to distinctly diagnose the level of dengue infection.
   Another contrast between our application and LUCAS, is we do not require
modifications to the cell phone, we use a paper based patch that can cheaply be
manufactured in bulk, in addition to performing diagnosis on the cell phone, without
any offload processing.
   Dengue fever rapid test devices, also known as one-step dengue tests, are typically
PCR or immuno-chromatographic based assays for the rapid, qualitative and
differential detection of dengue IgG and IgM antibodies to dengue fever virus in
human blood [13]. A medical kit developed in India adopts a version of PCR bioassay
methodology to detect common strands of Dengue. This novel invention is called
Erba Den-GO [2]. Transasia Bio-Medical developed this kit to detect strands of
dengue in India. Erba Den-GO is a simple testing kit that uses PCR based assays,
which is a process where the viral strands in the DNA are separated by synthesis of
oligonucleotide primers (genomic sequences designed to anneal to their respective
viral genomes), amplified and then analyzed to detect dengue viral strands. The box
includes a small hand held testing device with a small reservoir in the center. In this
reservoir, the user mixes approximately 10 micro-liters of blood with a few drops of a
chemical compound used to isolate the viral strands. After about fifteen minutes, the
patch reveals lines to reflect the stage of dengue.
   Rapid detection kits are a good solution for detecting dengue, however kits such as
these are priced between $200 - (Dengue Fever Rapid DipStick Test) to $700 -
(Dengue Fever IgG/IgM Card Test Kit). The above methodologies offer a good
approach to dengue detection. However, our solution provides a methodology to
detect dengue that is more affordable to third world countries, in addition to being
accurate.

2.2 Mobile Image Processing

Another area of research that has been gaining attention is image processing on
mobile devices. Researchers at Carnegie Mellon have spearheaded a project called
CMUcam. The objective of this project is to provide a framework for image
processing with a small CMOS color camera module, coupled with a high speed
embedded ARM processor. The embedded device is a fully programmable open
source library tailored for general image processing tasks.
   This device provides high speed processing, however does not have networking
capability. The cost of this device is roughly $100.00, which is comparable to the cost
of a cell phone. CMUcam provides a good foundation for robotics and artificial
intelligence frameworks. However, the solution may not be viable in a developing
country due to the need for an additional computer to program the interface. In
contrast, our simple algorithm is capable of performing analysis of the patch, without
an additional processor.
   Our assumption is that medical personnel in the developing country have at least a
cell phone device with an integrated CMOS camera. The algorithm that we use to

                                             4
analyze the patch does not require heavy processing power as most cell phones do not
have high processing capability. Our algorithm is also simple enough to run on cell
phone devices with limited processing capability.
Our research presents an easy way to detect Dengue using the processing power of
a cell phone and a small medical patch that turns different color shades. Our solution
involves a bio-assay based test, and a lightweight image processing algorithm to
diagnose the level of disease. Alternative solutions typically involve traditional tests
using bio-assays, in addition to using microscopy to detect the viruses. Further detail
regarding traditional dengue detection methods are defined in later sections.
Figure 2: Workflow diagram of Figure 3: Workflow diagram of how
how Dengue is traditionally Dengue is treated in accurate detection
treated. mobile health system.
3 DENGUE
Dengue and dengue hemorrhagic fever are viral diseases transmitted by mosquitoes
that have the potential to cause significant illness, particularly if undetected. The
5mosquito has a predilection for urban areas, particularly in developing nations where
breeding regulations may be lacking. The incidence of dengue infections is increasing;
it is estimated that there are 100 million infections annually. 5 million of these
infections are serious enough to require hospitalization [3]. No vaccine is currently
available for the disease. Treatment consists of early identification of the disease
combined with intensive surveillance and fluid support as necessary. Significant
morbidity occurs when the disease is not detected in a timely fashion to allow for
resuscitation efforts to proceed.
Traditionally, the diagnosis of dengue infection is a clinical determination by a
medical professional. However, during the early infection period, when symptoms may
not be as severe as later in the course, the patient with dengue fever can appear to have
a less serious illness and therefore may not be given appropriate treatment.
To overcome this limitation, a number of groups have attempted to develop accurate
dengue tests to detect the presence of dengue antibodies or electrolyte abnormalities
indicating presence of serious disease [1]. However, many of these tests are
unavailable to developing nations due to their high cost or the requirement for
complicated electronics and machinery. To overcome this limitation, researchers [6]
[14] are developing a novel, low-cost patch to detect the presence of infection and
associated abnormalities. This paper-based sensor utilizes colorimetric detection
schemes to note the presence of abnormalities in the patient’s blood.
Each device is predicted to cost less than twenty cents without need for a
sophisticated or expensive reader. Similar to the glucose sensor tests, a droplet of
blood is introduced into the sensor and the analyt es in the blood diffuses into the
various wells of the device, where they react with the chemical reagents. The level of
color change in each well corresponds to the level of analyte in the blood. A
qualitative analysis is available simply by noting the presence of color change.
However, our team is developing the following system to allow for a simple, accurate,
and inexpensive method for quantifying the level of analytes in the blood in
comparison to a printed reference range. Such a system allows for accurate disease
diagnosis and implementation of treatment in a timely fashion.
4 DIAGNOSTIC SUPPORT FOR DISEASE OUTBREAKS
4.1 Conventional Diagnostic Support
The workflow in Figure 2 describes the conventional methodology for treatment of a
patient suspected of having the dengue virus. The process involves an initial clinical
assessment where the physician admits the patient in for initial testing. A sample blood
specimen is then taken for testing and a PCR based assay test would be administered to
extract the viral components of dengue from the patient's serum sample. The test would
be administered multiple times each test isolating a different viral strand to gauge the
level of infection. This process can take as long as a five days to identify the level of
infection. Following this process, if the physician has suspicion of illness, the patient is
immediately admitted to the hospital where further tests and viral antibodies are
administered to fight the virus.
6Figure 4: Dengue Medical Patch Mockup
The apparent problem with this methodology is there is no concise way to
diagnosis of the level of infection quickly to prescribe the necessary treatment. With
each day that passes, the level of viral infection can grow worse, so a more accurate
and timely system is needed to save lives. This is the goal of the dengue detection
patch in conjunction with a mobile phone application. Once developed, the patch will
be highly affordable, and we assume that the typical physician carries a mobile device
with a camera.
4.2 Mobile Diagnostic Support
The new system is described in Figure 3. An ill patient suspected to have dengue
infection or other serious illness is identified and a small blood sample is taken from
the patient. The sample is then introduced into the patch, as shown in Figure 4, where
analytes in the patient’s blood are allowed to diffuse into the different chambers of the
patch. Reaction occurs with the reagents in each well and the device is then inspected
after half an hour. Gross abnormalities in the patient’s blood sample can be detected
by the unaided eye. However, more subtle changes in these parameters, which can
still portend serious illnesses, can only be determined by quantification using the
image processing system described in this paper.
The next step is for the medical practitioner to take a photo of the device (with the
color-coded reference ranges printed next to the wells, as shown in Figure 4). This
image is then processed and the color levels in each of the wells are compared to the
reference ranges, yielding a quantitative result of the analyte levels. Based upon the
results, the patient can be triaged and given appropriate treatment, which may include
fluids or other interventions, and admitted to the hospital for more intensive care and
follow-up.
The benefit of this system is that infection and other serious illness can be detected
sooner, allowing for more rapid diagnosis and treatment. Most mortality cases from
dengue occur because preventive treatment It should be noted that patch development
is in progress, and the most recent published paper given to us for reference is [6].
The patch displayed in Figure 4 serves as the prototype image used for development
of the cell phone algorithm. The image processing algorithm that we are using was
first developed using Matlab, then implemented on the cell phone. The resolution of
the image in Figure 4 used for testing was 240 x 320. As the image scaled picture
clarity was reduced, so until we receive the actual patch, we are unable to perform in
7depth analysis of the patch detection errors. However, the photo suffices as a good
enough bases for algorithm development.
Figure 5: HTC Mogul 6800 Cellular Platform with Embedded Optical Sensor
5 MOBILE EMBEDDED SYSTEM PLATFORM
The HTC Mogul 6800 Windows Mobile Smartphone device is one of the HTC
company's flagship smart phones (Figure 5). The mobile device is small, lightweight
and uses the Qualcomm 400 MHz MSM750 ARM Processor. The device has 64MB
of RAM, and 512 MB of flash memory. The device operates under the Windows
Mobile 6.1 Operating System, and contains a 2.0 Megapixel CMOS camera
embedded in the device. The image of the device is shown below. The software used
to program the Dengue Windows Mobile application is C#.
6 LIGHTWEIGHT IMAGE PROCESSING ALGORITHM
In the past decade, cell phones have transformed from simple mobile communication
devices to mid-ranged scalable computing devices. The processing power of cellular
phones has increased dramatically enabling many technological innovations.
However, although the cellular phone provides increased processing capability,
memory, processing time, and power consumption must be considered.
In this paper, we will discuss the algorithms implemented on the cell phone. In
addition, we analyze several object identification algorithms in the challenges section
that are constrained by limited memory and low processing power.
8Figure 6: Direction of scan lines to define localized area of patch where highest
average pixel value is encountered.
6.1 Greedy Scanning
The first step of our algorithm is to take measures to isolate the patch from
background noise. To localize the patch, a greedy scan is applied beginning with a
vertical scan of every ten pixels across the X axis, then a horizontal scan across the Y
axis in the image. The scan starts from the outside moving inward until the highest
average pixel value is obtained in each respective scan direction. Once the two
columns (from the X axis) and rows (from the Y axis) are obtained for that respective
scan area, the first two high gradient edge points encountered are also stored. Figure 6
gives a visualization of the scan directions. The gradient points are identified by the
following algorithm:
X Axis Scan: Gradient points obtained by a scan beginning outward starting at the top
position, then moving inward every few pixels downward stopping at the first largest
gradient encountered in each scan direction.
Y Axis Scan: Gradient points obtained by a scan beginning outward starting at the left
position, then moving inward to the right every few pixels stopping at the first largest
gradient encountered in each scan direction.
These points are obtained as the average pixel value is calculated for each scan
line. The two points are then used to form a line segment that cuts through the patch.
The figure below marks the direction of the scan lines as they cut through the patch
area.
The red lines from the figure above correspond to the index where the greatest
average pixel value was seen from respective scan directions. Given this information,
we now have a localized area where the patch resides. However we still do not have
any useful information regarding the patch's orientation or location of the wells, but
we're close.
Our implementation assumes:
• Stronger edge approximation accuracy when the patch orientation is a few
degrees within the ranges of 0, 90, 180, or 270.
9Figure 7: Shows gradient points marked from each respective scan, and
stencil scan to define the edge.
- Strong gradient point Gi ( x, y) forming line segment cutting through patch
- Stencil scan direction to approximate edge of patch
• The mobile phone camera is parallel to the patch to avoid skewed areas.
For example a patch oriented around a 45 degree angle will reduce the algorithms
ability to accurately identify edge regions. In most cases, the patch's edges will be
unidentifiable because the edge points will form a V shape instead of a straight line,
thus will invalidate the algorithm's ability to predict an approximate line segment.
6.2 Approximating Patch Edges
Now that the scan lines have identified a local area of the patch, the edges must be
identified in order to approximate the location of the corner points. To approximate the
edges we trace the line segment formed between the gradient points as shown below.
Figure 7 gives a visual picture of the algorithm used to estimate the edge regions of
the patch. The blue oval represents the gradient points selected for each scan area
containing the highest average pixel value. The edge detection stencil scan extends
outward, depicted by the green arrow towards the outer edges of the patch. The next
section describes the edge region approximation algorithm in more detail.
6.3 Edge Region Approximation
The below algorithm represents the weighted neighboring stencil equation that we
derived. A stencil is used to find the sharp gradient point that represents the location
where the image section stops being white and sharply changes to black.
S y = [( L( xi− 2 , y j ) + 2* L( xi−1, y j ))
−(2 * L ( xi +1 , y j ) + L( xi + 2 , y j ))] / 4
(1)
10S x = [( L (xi , y j − 2 ) + 2* L (xi , y j − 1))
−(2* L( xi , y j +1) + L( xi , y j+ 2 ))] / 4
(2)
Figure 8: Shows edge point traces of outward stencil scan
S x is the stensil equation used for scans across the X axis (Equation 1). S y is used
for scans across the Y axis (Equation 2). In equation 3, the scan begins at a starting
L( xi , y j )
point, . The starting point lies along the line segment between gradient
GG
points 1 2 , defined by the blue oval for each respective line scan. The gradient
points extends perpindicular to the segment in the direction of the associated green
G1G2 comes
arrow until a sharp gradient is found. Each initial starting point L along
from the line equation:
L (x i , yj ) =(1 −t )G 1 + , 2t =[0..1]
tG
(3)
If an edge is not found, the next intermidiary point along the line segment is
evaluated. We chose to use a weighted four point stencil to assign higher weights to
adjacent pixel points.
1. Scan performed every few pixels along XY axis.
2. For each pixel in row (on Y) or column (on X) scan
direction (1…N)
a. Get average pixel value for row or column
b. find gradient points
- X Axis: Scan from top to bottom using S y stencil
until first gradient is encountered. Repeat from bottom to
top.
- Y Axis: Scan from left to right using S x stencil until
first gradient is encountered. Repeat from right to
left.
11Figure 9. Pseudo-code for algorithm to obtain highest average pixel
rows/columns and gradient points
Figure 7 shows the direction of the stencil scan, and Figure 8 above shows the
resultant edge points marked to outline the approximated edges of the patch. Figure 9
shows pesudo code of the stensil scan algorithm. Following the line segment scan, a
trend line algorithm such as the Least Squares Fitting can be used to construct a trend
line for each side. Only three sides are necessary to identify the patch. Those sides are
the ones that form perfect straight lines. The side tracing the well area will contain
points that do not construct a perfect line, thus revealing the orientation of the patch.
Once a line equation is constructed for each of the three sides, the two corner
points connecting each side to form the square can be identified by finding the
intersection points from the segments.
6.4 Patch Orientation
In addition to assuming the side with the highest margin of error given the trend line
to be where the wells reside, another option that provides further accuracy is to split
the square into four quadrants, then assume the top two highest average pixel values
to be the top half of the patch. The two quadrants with the lowest values contain the
wells, since that area is mostly black.
7 PROCESSING THE WELLS
Given that the patch is square, we know the length of the sides by measuring the
distance between the two approximated coordinate points. This distance measurement
is then used as a scaling factor for our reference point measurements. To identify the
location of each well, we manually measured the distance between each well and our
chosen reference point then created a scaling factor of how many pixels corresponded
to one unit of measure. We chose our reference point to be the top left of corner of the
patch opposite of the wells. Given the reference point measurements, our length scale
measurements, and our scaling factor we have all the information we need to process
the patch on the mobile phone very quickly.
7.1 Patch Angle Transformation and Well Identification
Given an acceptable patch orientation within range of the accepted degree values
mentioned above, we applied the Jacobean Transform to identify the wells given any
slight offset of the patch from the normal and a measurement. We found the offset
from the normal angle by taking the arctan of the two corner points.
12θ = arctan( y2 − y1 / x2 − x1 )
Once the offset is found the Jacobean Theorem can be applied. For our equation,
we used the following theorem to identify the well location given our reference point.
B = cos 2 θ − sin 2 θ
← cos θ − sin θ ←x ' ←x
1/ B ↑ ↑ ' =↑
→− sin θ cos θ →y →y
(x', y') - represents the original pixel distance from the reference point to a desired
well
(x, y) - represents the new x, y coordinates given the angle offset θ
Given this equation, we can plug in our reference measurements for each well and
find the exact location in the image.
7.2 Well Color Detection
Our implementation assumes a certain amount of infrastructure available. Below is a
list of our assumptions:
• The CMOS Optical sensor is fairly sensitive enough to produce a good quality
image
• There are no variations in illumination.
• The image is a taken at an angle parallel to the patch.
After locating a well, its color can be contrasted with corresponding reference
template colors by comparing their luminosity. Luminosity analysis analyzes the
intensity of the pixels while maintaining the original colors (Figure 10a). Figure 10b
shows the image after the luminosity analysis. After luminosity, the colors are further
segmented into red green and blue yellow planes. Then, the colors are clustered so that
colors that are the closest to each other are grouped together. A range metric is also
used to reduce noise by ensuring that there is a minimum distance between colors in a
cluster. Figure 11 shows the pseudo code for well color detection.
13Figure 10: Image Partitioning and Template Color Segmentation and Matching.
a) Image partitioning by square template matching. b) Luminosity analysis by
pixel intensity. c) Maximum color size by cluster
Some reference colors are error colors that appear in the well but are not the valid
test result. If the maximum cluster color is an error color, then the algorithm searches
for the next maximum cluster size. The result of the maximum cluster color is shown
in Figure 10c.
Input: Image.
Output: N colors. For each partition (1…N){
c. Classify colors by luminosity.
d. Segment colors by red green blue yellow.
e. Group objects into clusters using range
metric.
f. Do{
i. Find maximum cluster size.
}While cluster is error cluster
g. Return maximum cluster color.}
Figure 11. Pseudo-code for Image Partitioning and Template Color Segmentation and
Matching
8 WEB SERVICE
Leveraging the networking capabilities of cellular phones is something that most
wireless health applications seek. In our system, once the cell phone has diagnosed a
patient, if necessary the physician will have the ability to upload the analysis results to
a web service that is tied to the CDC. The goal is to leverage web services to offer a
medical mobile health infrastructure wherever the user is located.
149 ANALYSIS
Our image partitioning and color segmentation and matching algorithm allows a
camera phone to diagnose dengue in a patient. Diagnosis is done by matching the
color results to reference colors for a respected well on the medical patch. There are
several important implications on how this would affect dengue diagnosis in
developing countries. Due to the portable nature of the cell phone diagnosis can be
done at the patient’s home. Mobile diagnosis aids in the treatment of patients in rural
areas. Subsequently, patients will be provided with the recommended treatment for
dengue to prevent death. The mobile diagnosis will have the largest impact on
children who are the most susceptible to the serious side effects of dengue.
The transmission of positive test results to the CDC can also aid in control and
prevention of dengue. The cellular communication also contains information on the
corresponding tower of the transmission. This location information can be used to
determine areas that are susceptible to epidemics. If various agencies have accurate
information on the number, location, and type of dengue outbreaks, they can work on
improving the waste and water management in those particular regions. These
prevention and control techniques can mitigate the further spread of the disease and
improve the quality of people's lives in the developing country. Additionally, affected
travelers will be aware of their condition and be advised not to travel to aid in
recovery and prevent propagation of the disease.
When a new technology is introduced into the healthcare arena, it is important to
note its limitations as well as its capabilities. The portable nature of the cell phone
and medical patch can also raise difficulties in maintaining the equipment. In
developing countries with high crime, cellular phones may be susceptible to thief.
The cellular phone is a valuable resource in developing countries and could be used
for other purposes. However, a key factor that should be considered that contributes
to the effectiveness of our solution is the wavelength sensitivity of the CMOS optical
sensor. The sensor's level of sensitivity does play a role in the quality of an image.
Additionally, the cost of the cellular service was not put into the cost analysis. The
assumption that the cellular network is functioning in the remote region also may not
be a valid assumption for some developing countries. The cost of using the cellular
service and the availability of the service can vary greatly depending on the country’s
resources.
10 CHALLENGES
One of the biggest challenges encountered during this project involved patch
localization algorithms. Due to having a very restricted execution environment in terms
of memory and processing power, this section describes the challenges faced with
analyzing images on the camera.
1510.1 Grayscale Versus Binary
Processing an image given an intensity scan, also known as gray scaling is a common
technique in image processing. Intensity scans work well to transform the dimensions
of a color image into a single dimension of gray shades. The intensity then can be used
by edge detection algorithms such as Sobel to find the gradient of images.
.
Figure 12: Gradient image of patch with weak edge definition from an intensity
scan (gray scale)
What we found during experimentation was that although gray scaling works well to
normalize images, this technique alone does not get rid of background noise. To create
a simplified image with virtually no background noise, a binary image must be
constructed. The binary image that we constructed classifies the inner area of the patch
area as pure white, and removes virtually all background noise. A binary image
simplifies the images color scheme, and makes it easier to identify the patch. Please see
Figures 8 and 12 for reference.
10.2 Sobel Edge Detection
The first approach was to use grayscale image techniques to identify the patch using
intensity scans, followed by edge detection algorithms to isolate the edge regions of the
patch. The algorithm used was the Sobel Algorithm defined below.
←1 0 −1 ←1 2 1
GX = ↑ Gy = ↑↑ 0 0 0 *A
↑2 0 − 2 *A
↑
→1 0 −1 ↑−
→ 1 −2 −1
G ( x, y ) = G x + G y
The goal was to utilize the edge map produced from the gradient edges to identify
and isolate the outer corner region of the patch, however we found that in certain
16instances edges were not clearly defined strong enough to have an influence on our
localization algorithm, which was bounding box at the time, or clearly identify the
patch.
For example, the image shown in Figure 12 is a result of the Sobel algorithm using a
3x3 convolution kernel in both the X and Y direction; Gx and Gy respectively to
produce the gradient image G. The variable A corresponds to a 3x3 sub-section of the
image to be masked
In scenarios, where the subject's skin color resembles the color of the outer edges of
the patch, the edges were less defined. In addition, if a picture was taken of the patch at
certain angles, the edges were also less defined.
10.3 Patch Testing
Given that the patch is in development, we only had the image from Figure 4 to work
with. As mentioned in the above section, the resolution of the image was 240x320. To
test the algorithm on the phone, the image was placed in a directory on the mobile
device and used for analysis by the image processing application. However, there is a
limit to how much the image can be resized or reshaped before losing quality. Using
the native image size, we are able to accurately approximate the well locations with an
average error of about error 8 pixels off the target patch corner point in the Y axis
direction, and three pixel positions off in the X axis. We are not able to test as
accurately due to the picture quality loss once the image is scaled up. The program
runtime was about 13 seconds with the picture at 240x300. If the image is scaled to 1
Megapixels, the algorithm will take around 30 seconds to complete, however the image
resolution is not clear enough to accurately detect the patch. Further analysis will be
performed once we receive the actual patch.
11 CONCLUSIONS AND FUTURE DIRECTIONS
In conclusion, we have presented a novel approach for detecting dengue using the
processing power of mobile phones. This approach provides a method for detecting
dengue that is highly cost effective. Using light weight image processing algorithms,
the cell phone is used to analyze the patch and accurately determine the disease state
with limited processing capabilities and memory. Our system requires no off board
processing and provides the user with simple and timely feedback.
To further enhance the capabilities of our application, we are continuing research
on better image processing algorithms to effectively identify the patch given
background noise. The active contouring algorithm is very effective at identifying
objects within images, however the algorithm involves many complex sets of
operations to bound an object of interest. Further research will involve taking into
account general concepts of how the algorithm works to create a hybrid version given
that the only object of interest is our patch in an image.
Lastly, an area of special interest resides in the security and authenticity of data
from the cellular phone. Ensuring the integrity of a patient's medical record is a very
17important consideration in addition to ensuring that a patient's medical data remains
safe if the patient's cell phone is stolen or lost. Researchers at the Wireless Health
Institute at UCLA have developed a medical device called a Gateway, which serves as
a secure data warehouse for medical data, in addition to a communication controller
device for medical information uploads to a third party. This device is small enough
to clip on the belt or reside in their pocket of a patient. This device can ensure data
integrity by facilitating the upload of dengue outbreak information to the CDC, and
encrypting a patient's medical information before uploads to ensure integrity.
ACKNOWLEDGEMENTS
We thank Krishna Yeshwant of Harvard Medical School and Diagnostics for access to
the rapid sensor devices for this study. We'd also like to thank Lord Cole and Ganesh
Sundaramoorthi from University of California, Los Angeles for their consultation with
image processing algorithms.
REFERENCES
[1] P. Dussart, L. Petit, B. Labeau, L. Bremand, A. Leduc, D. Moua, S. Matheus, L. Baril,
“Evaluation of Two New Commercial Tests for the Diagnosis of Acute Dengue Virus
Infection Using NS1 Antigen Detection in Human Serum”, PLoS Neglected Tropical
Diseases, vol. 2, no. 8, pp. e280, 2008.
[2] "Erba Den-Go to Detect Dengue", http://www.transasia.co.in/Erbadengo.html
[3] D.J. Gubler, “Dengue/dengue hemorrhagic fever: history and current status”, Novartis
Foundation Sympsoium, vol. 277, pp. 3-16, 2006.
[4] M. Guszman and G. Kouri. Dengue and dengue hemorrhagic fever in the Americas:
lessons and challenges.” Journal of Clinical Virology 27 (2003) 1-13.
[5] R. S. Lancotti, C. H Calisher, D. Gubler G. Chang, A. V. Vorndam, "Rapid Detection and
Typing of Dengue Viruses from Clinical Samples by Using Reverse Transcriptase-
Polymerase Chain Reaction, Vol. 30, No 3, 1992.
[6] A.W. Martinez, M.J. Butte, G.M. Whitesides, “Patterned Paper as a Platform for
Inexpensive, Low-Volume, Portable Bioassays.” Angewandte Chemie International
Edition, vol. 46, no. 8, pp. 1318-1320.
[7] Organizacion Panamerica de la Salud. Nueva Generatcion de Programas de Prevencion y
Control del Dengue en las Americas. OPS/HCP/HCT/206/02.
[8] F. Pinheiro. Dengue in the Americas 1980-1987. Epidemiol Bull PAHO 1989; 10:1-8.
[9] T. Su, S. Seo, A. Erlinger, A. Ozcan "Multi-color LUCAS: Lensfree on-chip cytometry
using tunable monochromatic illumination and digital noise reduction",” Cellular and
Molecular Bioengineering. 1:2, 146-156., 2008.
[10] Hilde M., Rust M.,Chen C, Heidi E, Wilschut1 J, Zhuang X., Smit1 J. "Dissecting the Cell
Entry Pathway of Dengue Virus by Single-Particle Tracking in Living Cells"
[11] Sa-ngasang-A, Wibulwattanakij S., Chanama S, O-rapinpatipat A., A-nuegoonpipat A.,
Anantapreecha S., Sawanpanyalert P, Kurane we. "Evaluation of RT-PCR as a Tool for
Diagnosis of Secondary Dengue Virus Infection"
[12] Lanciotti R., Calisher C., Gubler D., Jen Chang G., Vorndam V. "Rapid Detection and
Typing of Dengue Viruses from Clinical Samples by Using Reverse Transcriptase-
Polymerase Chain Reaction"
18[13] "Dengue Fever Rapid Test Kits", http://www.ivdpretest.com/Dengue-Rapid-Tests.html
[14] "Dengue Relief Foundation", http://www.denguerelief.org/aboutus/index.html
Anthony R., Charles R., Illah N., "A Low Cost Embedded Color Vision System"
[15] Anthony R., Charles R, Illah N., "A Low Cost Embedded Color Vision System", IROS
2002
19You can also read