Low-Carbon Cars In Germany - A summary of socio-economic impacts - European Climate Foundation
←
→
Page content transcription
If your browser does not render page correctly, please read the page content below

Low-Carbon Cars In Germany
  A summary of socio-economic impacts

We are grateful to the following
organisations for contributing their
expertise and insight:

50Hertz Transmission GmbH          Nissan Center Europe GmbH

ABB Ltd                            Nationale Organisation Wasserstoff-
                                   und Brennstoffzellentechnologie GmbH
BMW AG
                                   Toyota Motor Europe
Continental AG
                                   Valeo S.A.
Daimler AG
                                   Verkehrsclub Deutschland e.V.
EnBW AG
                                   Verband der Automobilindustrie e.V.
EUROBAT
                                   Volkswagen AG
European Aluminium
                                   Verbraucherzentrale Bundesverband e.V.
IG Metall

LANXESS AG

Michelin

The Mobility House GmbH

Naturschutzbund Deutschland e.V.
Acknowledgements

Analytical Team                                             Disclaimer

Phil Summerton, Managing Director,                          The stakeholders who contributed to this study shared the
Cambridge Econometrics                                      aim of establishing a constructive and transparent exchange
                                                            of views on the technical, economic and environmental issues
Sophie Billington, Project Manager,                         associated with the development of low-carbon technologies
Cambridge Econometrics                                      for cars. The objective was to evaluate the boundaries within
                                                            which vehicle technologies can contribute to mitigating
Jamie Pirie, Senior Economist,                              carbon emissions from cars in Germany. Each stakeholder
Cambridge Econometrics                                      contributed their knowledge and vision of these issues. The
                                                            information and conclusions in this report represent these
Shane Slater, Director, Element Energy                      contributions, but should not be treated as binding on the
                                                            companies and organisations involved.
Alex Stewart, Director, Element Energy

Joris Besseling, Principal Consultant, Element Energy       Berlin, October 2017

Wolfgang Schade, Director, M-Five GmbH Mobility,
Futures, Innovation, Economics

Independent Reviewer

Peter Mock, Managing Director,
International Council on Clean Transportation

Project coordination

Pete Harrison, Transport Director,
European Climate Foundation

Constance Chucholowski, Senior Consultant,
Joschka Fischer & Company

This is a summary of the Cambridge Econometrics
report “Low-carbon cars in Germany: A socio-economic
assessment”, which can be downloaded at:
https://www.camecon.com/how/our-work/
low-carbon-cars-in-germany/

Suggested reference: Harrison P, 2017, Low-carbon cars in
Germany: A summary of socio-economic impacts
Executive Summary

    The German auto industry is a global leader in             Total costs for motorists of owning ZEVs could
    technology innovation and will continue to play a          converge, under certain scenarios, to that of
    leading role in tackling climate change and urban          combustion vehicles until 2030, and in some
    air pollution. This project has confirmed that             particular use-cases (e.g. taxis) will reach cost-
    improving the efficiency of cars and deploying Zero        parity even much earlier. To make the transition to
    Emissions Vehicles (ZEVs) can make a significant           low-carbon mobility successful, governments will
    contribution to meeting Germany’s ambitious CO2            need to encourage this convergence and should
    reduction target for transport in 2030 and towards         consult with industries and other stakeholders.
    2050 and the Paris Agreement.
                                                               Charging infrastructure is a condition for a quick
    While this study has not analysed impacts on               market uptake of EVs, and investment therefore
    competitiveness, participants agreed that the              needs to be accelerated. The implementation of
    German auto industry needs to remain at the                a rapid charging infrastructure in Germany will
    cutting edge of innovation of low-carbon vehicle           cost several billion euros by 2030. A determined
    technologies in order to remain competitive during         and joint effort of the industry, government
    this transition.                                           and civil society is needed in order to deploy
                                                               sufficient charging infrastructure. Timing, location,
    The transition from petroleum-based energy                 capability, interoperability and ease of use are key
    sources to renewably sourced energy is good for            issues. Electricity grids will need to be reinforced
    Germany’s economy and for net employment.                  and modernized as part of sector coupling,
    Replacing imported oil with domestically-produced          but these costs can potentially be reduced by
    energy will keep many billions of euros recirculating      implementing smart charging to moderate peak
    in the German economy. The transition to these             electricity demand.
    energy sources will also create new jobs, for
    example in manufacturing and installing the                The transition to low-carbon mobility causes a
    charging infrastructure, but will ultimately reduce        wide range of impacts to employment across
    jobs in manufacturing of combustion engines.               several sectors. Employment in the automotive
    Profound understanding of the changes to training          sector will remain stable until 2030 in our central
    and skillsets is needed to facilitate a just transition.   scenario (where climate goals are met through
                                                               a balanced mix of hybrids, plug-in vehicles
    However, Germany is unlikely to achieve its                and increasingly efficient ICEs). After 2030, the
    ambitious CO2 reduction target for transport in            transition to e-mobility will increase employment
    2030 solely via changes to new vehicles. Sustainable       in sectors such as construction and infrastructure,
    low-carbon mobility needs a systemic approach,             but will ultimately impact the whole automotive
    taking into account solutions and transport modes          value chain. Predictions from 2030 onward face
    beyond the automotive sector. New technologies,            multiple challenges requiring profound analysis.
    such as low-carbon fuels, and digital innovations,         The future location of battery manufacturing will
    like shared & connected mobility, will play a key          have some impact on the economic outcome. If
    role in this task. This means all solutions that can       Germany wants to maximise the value from the
    contribute to achieving the decarbonisation goals          transition to low-carbon mobility, it should seek
    by 2050 should be considered, and they should be           to encourage domestic battery production by
    promoted where effective and efficient.                    providing a supportive policy environment.

1
2
5

Introduction

    During 2016, the German government set a target          This expert panel met on six occasions to advise
    of reducing transport CO2 emissions by 40-42%            an analytical team, which was tasked with
    by 2030. At the same time, the European Union’s          answering the following key questions:
    “Strategy on Low Emissions Mobility” foresees a
    fundamental shift away from petroleum towards            • To what extent can clean car technologies
                                                             contribute to meeting Germany’s 40-42% transport
    greener energy sources. And the Paris Agreement
                                                             CO2 reduction goal by 2030?
    seeks to hold average global temperatures to well
    below 2 degrees Celsius. It is clear that change         • What is the range of possible impacts on
    is coming.                                               consumers from changes to vehicle purchasing
                                                             costs and overall vehicle running costs?
    It is inevitable that much of this change will
    be achieved via the adoption of new vehicle              • How is Germany positioned to capture the value
                                                             of future vehicle technologies, such as lightweight
    technologies. For Germany, an economy heavily
                                                             materials, and batteries?
    invested in automotive production, such goals will
    have profound and far-reaching consequences.             • How much would Germany need to invest in
    With this in mind, the European Climate Foundation       charging infrastructure for the agreed vehicle
    (ECF) convened a project to examine the main             technology scenarios, including reinforcing the
    social, environmental and economic impacts of a          electricity grid?
    technology-led transition to low-carbon cars. While
                                                             • What is the likely range of overall impacts on
    this study focuses on vehicle technologies, we also
                                                             German GDP and employment?
    acknowledge that the transition to low-carbon
    mobility will also require many other solutions,
                                                             It is also worth noting three potential impacts that
    such as low-carbon liquid fuels and greater use
                                                             this study has NOT attempted to quantify:
    of shared mobility. Further research is needed to
    understand the full potential, especially for cutting-
                                                             • It has not tried to measure the impact on the
    edge solutions such as e-fuels. To help inform the       competitiveness of the German auto industry,
    assumptions and review the emerging evidence,            either from outpacing or from lagging behind the
    the ECF involved the following organisations:            global transition to clean mobility.

    • Germany’s three largest car manufacturers; two         • It has not tried to measure changes to the
    international car manufacturers; and four suppliers      number of cars that might result from potential
    from the automotive value chain.                         changes in mobility patterns.

    • Three companies involved with the supply of            • And it does not provide a detailed analysis of
    energy and charging infrastructure in Germany.           the changes in employment within the automotive
                                                             sector itself.
    • Germany’s main auto workers union
                                                             As such, the main result of this study is a broad
    • Three German NGOs for environmental and                overview of the likely impact of a structural change
    consumer protection                                      to German mobility whereby there is an increase
                                                             in efficiency; a change in vehicle technologies
                                                             and energy infrastructure for cars, and a shift from
                                                             imported oil to domestically produced electricity
                                                             and hydrogen.

3
Methodology

The modelling approach used in this project is                 The E3ME model embodies two key strengths
described in detail in the technical report, and               relevant to this project. The model’s integrated
is summarised in Figure 1. An expert panel was                 treatment of the economy, the energy system
convened to help construct a series of plausible               and the environment enables it to capture two-
technology deployment scenarios, considering                   way linkages and feedbacks between these
historic evidence of diffusion rates for low-carbon            components. Its high level of disaggregation
technologies, as well as the range of existing                 enables relatively detailed analysis of sectoral
projections for future technology diffusion. The               effects. E3ME delivered outputs on changes to
panel also advised on the most relevant input data             household budgets, the energy trade balance,
on mobility, vehicles, energy, infrastructure and              consumption, GDP, employment, CO2, NOx
economy. These are described in later chapters.                and particulates.

The agreed datasets were then fed into a stock
model, which determined changes to Germany’s
overall stock of capital assets and energy
consumption per sector on an annual basis under
each of the scenarios. Finally, the outputs from the
stock model were fed into the macro-economic
model E3ME.

      DATA INPUTS                                 EXPERT PANEL                                 STOCK MODEL
                                                                                            Calculates the stock of capital
   Data on volume of energy                                                                 assets & energy consumption
needed to provide mobility service                                                          per sector on an annual basis

   Data on cost & efficiency of
  energy-converting technology

                                                                                           SIMULATION MODEL

       Data on price of oil,                                                                            E3ME
        gas and electricity

                                                    Reviews:
                                                                                           MODEL OUTPUTS
      Economic projections
                                                    • Data
                                                                                          • Employment impact across sectors
                                                    • Scenarios                           • Impacts on household budgets
           +          +                             • Assumptions                         • Changes to consumption, GDP

           +
               €                                                                          • Changes to energy trade balance
                                                                                          • Changes to CO2 ,NOX, particulates

Figure 1. An overview of the modelling approach
                                                                                                                                4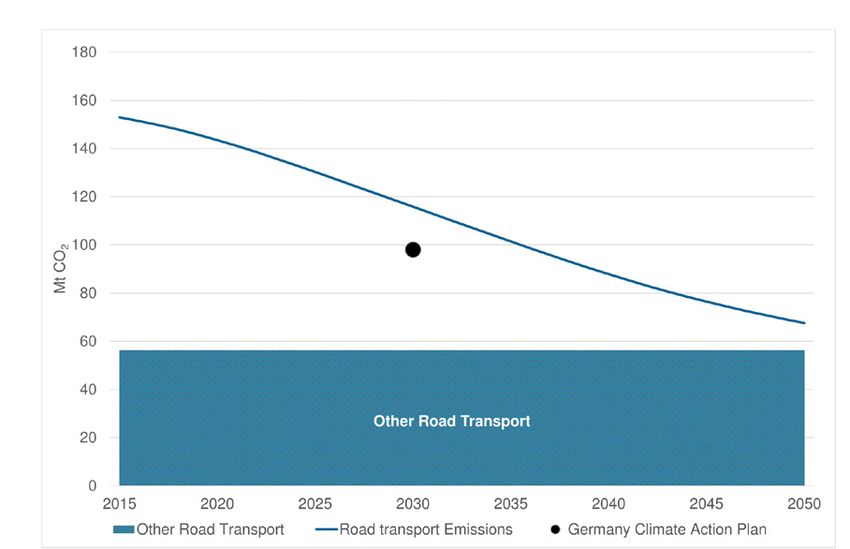
Environmental Impacts

    Question: To what extent can clean car                                    and the remainder are largely hybridised (both
    technologies contribute to meeting Germany’s                              mild- and full-hybrids). The deployment of ZEVs is
                                                                              consistent with the range of previous forecasts and
    40-42% CO2 reduction goal for transport?
                                                                              takes account of historical diffusion rates for new
                                                                              automotive technologies.
    There is a wide range of uncertainty about future
    deployment of zero-emissions technologies, which will                     In our central TECH scenario, CO2 emissions from
    be impacted by changes to technology costs, energy                        cars are reduced from around 99 MT per annum in
    costs, the level of taxes and incentives, and consumer                    2017 to about 12 MT per annum in 2050 (Figure
    preferences. However, this expert panel has agreed a                      3). At the same time, a substantial co-benefit is
    central vehicle technology scenario that is considered                    achieved: Emissions of particulate matter from
    plausible, achievable and broadly in line with the                        vehicle exhausts would be cut from around 5,000
    goals of the Paris Agreement, when combined with                          tonnes per annum in 2017 to below 500 tonnes
    other measures to reduce transport CO2.                                   in 2050. This is achieved via a combination of
                                                                              increased efficiency and switching the energy source
    In this central scenario TECH (Figure 2) the German                       from diesel and gasoline to low-carbon electricity
    car fleet changes from one that is dominated by diesel                    and hydrogen. While this trajectory achieves a very
    and gasoline vehicles in 2017 to one in which by                          substantial reduction in CO2 by 2050, it does not
    2030 nearly 40% of new cars sales are Zero Emissions                      on its own achieve Germany’s goal of reducing
    Vehicles (namely plug-in hybrid electric vehicles,                        transport CO2 by 40-42% by 2030.
    battery electric vehicles, fuel-cell electric vehicles)                   One reason for this is that while there is a rapid

    Figure 2. The central scenario for deployment of new vehicle technologies
    in new car sales represents an averaging of projections by the expert panel.

5
change to the technology mix in new vehicle sales,                   appear to be more challenging to implement
the technology mix in the overall fleet changes                      than our central TECH scenario, both in terms
comparatively slowly. Vehicle lifetimes in Germany                   of technology deployment rates and in terms of
are around 15 years, and the average age of                          socio-economic impacts. Typically, low-carbon
vehicles on the road today is 9 years. However,                      vehicle technologies have taken 15 years or more
previous analysis undertaken for the ECF indicates                   to diffuse (see Figure 7). The socio-economic
that this scenario is capable of meeting the goals                   implications are explored in later chapters.
of the Paris Agreement if combined with a range
of other measures to reduce transport CO2, such
as more efficient trucks and buses, advanced low-
carbon fuels etc.

Various commentators have argued that diesel
and gasoline engines should be eliminated from
new car sales by 2030 to achieve environmental
goals. In order to explore this issue further, a
scenario was developed that reached 100% plug-in
vehicles by that date. This scenario does achieve
Germany’s goal of decarbonising transport by
40-42% by 2030, without any other improvements
to the mobility sector. However, it does also

Figure 3. German road transport CO2 emissions in the TECH scenario

                                                                                                                        6
Consumer Impacts
Question: What is the range of possible The modelling of battery electric systems takes
into account the cost of cells, wiring harnesses,
impacts on consumers from changes to
containers and management systems, as well
vehicle purchasing costs; and overall vehicle as performance improvements over time. Our
running costs? baseline estimates are higher than some bullish
cost projections recently published. For example,
There is a wide range of views on the cost of our analysis is more conservative than GM’s
vehicle technologies to reduce CO2 emissions. recent estimate that the Chevrolet Bolt battery is
Projections of the cost of improving the efficiency $145/kWh at the cell level or GM’s roadmap
of diesel and gasoline cars vary widely (Figure 4). projection of a cell cost of $100/kWh by 2022.
At the top end of the range of estimates is work We are also more conservative than recent
undertaken by IKA, while at the bottom of the estimates that battery packs from the Tesla
range are estimates by the ICCT. A more central Gigafactory could reach $125/kWh by 2020.
view is provided by Ricardo-AEA in analysis
conducted for the European Commission in 2015.1 Fuel cell cost assumptions for fuel cell electric
We have chosen this Ricardo data for the central vehicles are based on discussions with car
assumptions on vehicle technology costs in our manufacturers and a review of published data
analysis, but we have also tested the impact if (such as the US Department of Energy data).
costs turn out to be higher or lower, in line with Costs are assumed to fall from the high values
the views of either the IKA or ICCT. in today’s low volume models to approximately
____________________________________________________________________________
1 “Improving understanding of technology and costs for CO2
reductions from cars, and LCVs in the period to 2030 and development
of cost curves,” 28 July 2015 draft version, Ricardo AEA (2015)
68 g/km
4,000 by 2025
Estimated additional manufacturing cost (EUR)
[IKA, 2015]
3,500
3,000
2,500 95 g/km
by 2020
[AEA, 2015]
upper bound
2,000 [IKA, 2012]
1,500 [ICCT, 2016]
130 g/km upper bound
by 2015 [TNO, 2011]
[AEA, 2015]
1,000 [ACEA, 2009]
[ICCT, 2013]
lower bound
[TNO, 2006] [ICCT, 2016]
500 [ICCT, 2016]
lower bound
[AEA, 2015]
0
0 10 20 30 40 50 60 70 80
g/km CO2 reduction in NEDC compared to 2010 baseline
Figure 4. Cost estimates for technologies to reduce CO2 from gasoline and diesel engines
7€100/kW in 2020, and €60/kW in 2030, subject central case, but not complete parity by 2030.
to strong increases in production volumes to Changes to the purchase costs are just one
hundreds of thousands of systems per year per element of the overall impact on consumers. It is
manufacturer. High- and low-cost scenarios have also important to look at the total cost of owning
also been modeled. a vehicle for the first owner, whose purchasing
decision will determine whether the low-carbon
The cost of technologies to reduce CO2 from technologies enter the German vehicle fleet or
cars will reduce over time as scale economies are not. To understand this requires that over the initial
achieved, but the aggregate costs will increase ownership period we also consider not only the
as more technologies are added to reach tighter purchase price, but also the costs of fuelling the
CO2 limits. Figure 5 shows how vehicle purchase vehicle, the financing costs, the charger cost if it
costs are likely to evolve in future to meet is an electric vehicle, and the amount for which it
climate objectives in our TECH scenario. In 2020, can be resold at the end of the ownership period.
battery-electric and fuel-cell electric vehicles are Figure 6 shows this perspective over a 4-year
projected to be significantly more expensive than ownership period, according to our central case.
diesel and gasoline vehicles and their hybrid
variants. But by 2030, the difference in price The main finding is that by 2030 there is strong
will be narrowed as diesel and gasoline cars get convergence in the cost of owning and running
more expensive to meet environmental goals all types of vehicles in our central case, and this
and as zero-emissions cars get cheaper as they convergence is much stronger than for the purchase
start being manufactured at scale. In the German price alone. However, it is also notable that there is
context, there is a convergence in costs in our a relatively wide range between the most optimistic
Figure 5. Aggregate capital and financing costs for mid-sized cars in the TECH scenario
8Consumer Impacts
and most pessimistic assumptions (high-case vs There is also uncertainty about how energy for
low-case). These high-case and low-case estimates mobility will be taxed in future. As government
reflect different projections of the cost of diesel, revenues from the taxation of diesel and gasoline are
gasoline, electricity and the low-carbon vehicle reduced, it seems plausible that the Treasury might
technologies, as well as the cost of borrowing to look to tax other energy sources for mobility, most
buy the vehicles. notably electricity and hydrogen. On the other hand,
the German government has set an ambitious CO2
It is important to note how these uncertainties reduction goal for the transport sector and German
might impact on consumer adoption of different car manufacturers are investing heavily in ZEVs. It
technologies. For example, if low-carbon therefore seems unlikely that taxes will be set in such
technologies for petrol and diesel cars are at the a way that significantly impedes the deployment of
high end of the range of uncertainty, and battery- these technologies.
electric cars turn out to be at the lower end of the
range, then the transition might happen rapidly. By Taxation and incentives are important policy levers
contrast, if innovation leads to cheap improvements for achieving the low-carbon transition. Our analysis
to gasoline and diesel vehicles, but battery cost assumes that these are deployed effectively, such that
reductions turn out to be slower than currently the low-carbon technology scenarios are successfully
forecast, this transition will prove more challenging. achieved. At the same time, we acknowledge the
And while we have presented average values in current uncertainty and we highlight the importance
Figure 6, it is often more relevant to focus on use of industry, government and civil society working
cases. Some use cases, such as inner-city deliveries together to find consensus on the optimal approach.
and taxis, will achieve cost parity between This study has calculated that a road tax of around
technologies comparatively early. Others, such as 2 cents per km would be needed to compensate for
time-sensitive motorway driving (e.g. corporate the loss of fuel duty revenues in the TECH scenario.
executives), will achieve cost parity much later.
Figure 6.
Total cost of owning
and running a mid-
size car with various
power trains in the
TECH scenario in
2020 and 2030
910
New Value Chains

     Question: How is Germany positioned                  mild-hybrid system. This supports the assumption
                                                          in this study that Germany’s share of the market
     to capture the value of future vehicle
                                                          for technologies to improve diesel and gasoline
     technologies, such as lightweight materials,         engines remains unchanged in the period studied.
     and batteries?
                                                          By contrast, one cannot automatically make the
     Germany is a world leader in producing diesel and    same assumption about Germany’s share of the
     gasoline vehicles. Figure 7 shows how German         market for some of the entirely new technologies
     companies led the charge towards stop-start          that will be needed during this transition. While
     systems and gasoline direct injection technologies   German companies are well established in
     due to their efficiency advantages. This is just     the production of electric motors, and several
     one of many similar examples, and it thus seems      are involved at the cutting edge of fuel-cell
     plausible that German companies could compete        development, there are questions about the future
     effectively in the deployment of the next wave of    location of production of batteries and lightweight
     fuel-efficient technologies, for example the 48V     materials. For lithium-ion battery cells in particular,

                                                                                  Figure 7. Diffusion of stop-start and
                                                                                  gasoline direct injection technology
                                                                                  by brand (source: ICCT)

11
Asian companies currently dominate the market. We then looked at the potential for German
The future evolution of market share has important companies to gain market share in cell production
implications for the impact of this transition on jobs in the future. This depends on factors such as future
and growth in Germany. labour costs and skillsets, energy costs, corporate tax
rates, borrowing costs etc. The broad conclusion was
In order to understand these issues more that when it comes to current battery cell chemistries,
clearly, we examined the value chains for vehicle incumbent cell producers in Asia have the advantage
battery production and for lightweight materials. because they can cheaply expand existing
Lightweight materials are expected to be an production sites. Opportunities emerge for Germany,
increasingly important part of a transition to low- however, when a switch is made to new battery
carbon mobility. Future car structures will have to chemistries, if a supportive policy environment can
be much lighter to compensate for the heavier be put in place. At this point, existing manufacturing
drive trains in hybrid and fully electric vehicles. sites can become more of a burden than an asset,
There will likely be multi-material designs, with and new market entrants might gain the competitive
aluminium, high strength steel, plastics, and advantage, if they can bring a product to market at
carbon-fibre reinforced plastics, all likely to play the required quality and price.
a role. The Energiewende will ensure low-carbon
electricity in Germany, which in future will help Given the uncertainty about future manufacturing
minimize the carbon footprint of lightweight of battery cells, we have had to model a range
materials. All these materials have a history of possible futures: 1) 100% of battery cells are
of production in Germany. With batteries the imported; 2) 100% of battery cells are produced
challenges are greater. in Germany; 3) 50% domestic and 50% imported.
This last scenario forms the central case for our
The battery value chain can be disaggregated economic modelling.
into various steps, the most important being cell
production; assembling cells into battery packs; The results of the modelling are presented later in
and assembling packs into modules and then this report (Figure 12), but for now it is sufficient to
integrating them into the vehicles. By examining note that the location of battery cell manufacturing
the competitive strengths of German companies, has some impact on Germany’s GDP. If Germany
we found they were relatively well placed to wants to maximise the value from the transition to low-
capture the value of these last 2 steps. However, carbon mobility, it should seek to maximise domestic
cell production currently comprises around 60% of battery cell production by providing a supportive
the overall value in a vehicle battery (Figure 8), policy environment. However, the production of
and it is this area that is currently dominated by battery cells is highly automated, so the impact on
Asian producers. employment from the location of cell manufacturing
is less significant than the impact on GDP.
2014 Best-in-Class PHEV LIB Value Chain
Raw Processed Battery
Electrodes Cells
materials Materials Pack
TOTAL
Share N/A 29% 5% 26% 40% 100%
Currently
GLOBALLY GLOBALLY REGIONALLY GLOBALLY LOCALLY
Shipped
• Indigenous • Critical to quality • Critical to • Critical to • End-product
resources quality quality knowledge and
• Demand
integration
• Low export assurance • Processing • Processing
know-how
restrictions or know-how: eg. know-how: eg.
• Cost of capital
Success limitations coating thickness stack uniformity, • Proximity to
Factors • Production uniformity, drying, formation, customers:
cost inputs: e.g. solvent & electrolyte shipping costs,
regulatory, energy moisture content additive exchange of
technical
Figure 8. A disaggregated view of the vehicle battery value chain
12Infrastructure Costs
Question: How much would Germany queues during peak times. It should be noted that
need to invest in charging infrastructure for these rapid charger assumptions are based on the
arrival of relatively high range vehicle (300km and
the agreed vehicle technology scenarios,
500km for medium and large cars respectively),
including reinforcing the electricity grid? and the use of home or destination charging where
possible in preference to en-route rapid charging.
To try to understand the infrastructure investment
needs for this transition in Germany, we start by Having calculated the infrastructure density
assuming that each EV sold has, on average, either required, we have multiplied this by the projected
a residential wall box or a workplace charging cost for installing each type of charger. The main
post installed. In addition, we have consulted finding is that up to around €8 billion of cumulative
widely with companies investing in this area and investment in EV charging infrastructure could be
concluded that there will be roughly two public required in Germany by 2030 in our TECH scenario
charging posts in urban areas for every 10 EVs (Figure 9), although the figure might be lower if
on the road. more efficient business models are found. Under
the TECH RAPID scenario, where gasoline and
For rapid charging, there are two elements that diesel cars are phased out by 2030, this reaches
impact the required number of charging points. €20 billion of cumulative investment.
The first is the minimum geographic coverage Such numbers can appear prohibitively high,
needed to provide full mobility to EV drivers on but to put them in context, Germany’s new
long journeys. For reference, there are 12,645 km national infrastructure plan foresees €270 billion
of autobahn in Germany, and to provide rapid of investment by 2030. It is also notable that the
charging sites on each side of the autobahn, with German government’s commitment to spending
a spacing of 50km, this implies that around 504 on charging infrastructure (the Ladeinfrastruktur
rapid charging sites are needed. This compares project) falls short of the public infrastructure
to approximately 390 motorway service areas in investment requirements in the long term under
Germany today. In addition to motorways, there both the TECH and TECH RAPID scenarios.
are approximately 40,000km of national roads,
implying a need for approximately 800 sites at a Investments in hydrogen refuelling stations
spacing of 50km. On this basis we assume that are based on the deployments announced by
around 1,300 rapid charging sites will be needed. Hydrogen Mobility Germany, which expects 100
refuelling stations to be deployed by 2018, 400
It should also be considered that the rapid charge before 2025 and c. 1000 by 2030 (subject to
network should also serve sufficient vehicles per the speed of the vehicle rollout). The number
day without unacceptably long queues. The details of stations in 2040 and 2050 uses a similar ratio
of our calculations are included in the technical of vehicles to stations as 2030 and scales this in
report for this study, but in summary we assume proportion to the fuel cell vehicle fleet.
that after an initial deployment of 1000 rapid
charge points before 2020, the number of rapid Understanding the investment needs in
charge points is in proportion to the number of infrastructure also requires an exploration of the
battery electric vehicles in the fleet, with a ratio upgrades that will be needed to the electricity
of approximately 200 battery electric vehicles per system. Previous analysis has shown that there is
charging point. This takes into account peaks in a large difference between a situation in which
traffic flows both during the day and in holiday EVs are charged immediately when they arrive at
versus non-holiday periods to avoid significant their destination and a situation where charging
13is managed to avoid creating excessive loads Though there are costs to implementing smart
on the system. If EV owners charge on arrival charging, these can in theory be more than offset
at home or at work (unmanaged charging), this by the value created by connected EVs providing
would significantly increase evening electricity services to the network operator. Such services
peak demand, resulting in increased network involve remotely switching EV charging on and off
and generation capacity requirements, as well to help manage peaks and troughs in electricity
as high electricity production costs to meet the supply, and to help maintain a stable frequency of
additional EV charging demand. On the other electricity. These services will become increasingly
hand, smart charging strategies could largely important as Germany makes the transition to a
avoid these impacts and enable EVs to deliver renewables-led electricity system. It should also be
valuable services for balancing out variability in the noted that these services can be achieved through
electricity system. normal, uni-directional charging, and capturing
many of the benefits does not necessarily need
The level of EV deployment in our TECH scenario bi-directional “vehicle-to-grid” capability. The
is 5.7 million EVs in 2030, rising to 25.4 million in modelling shows that smart charging can largely
2050. With unmanaged charging, this leads to an prevent any increase in peak demand in 2030. By
increase in peak demand of 5.5GW in 2030 and 2050, instead of an increase in peak demand of
21GW in 2050, which is significant compared to 21GW, smart charging can limit the increase to just
a typical system peak demand of approximately 3GW. This has important implications for the cost
65GW without EV charging. of the electricity system.
Figure 9. Cumulative investment needs for chargers to service the
vehicle fleet defined by our TECH scenario
14Infrastructure Costs
According to the analysis undertaken in this project, However the value is diluted over time as more EVs
under an unmanaged approach to vehicle charging, connect to the grid and start saturating demand
Germany’s grid operators would need to spend for grid-balancing services. By 2030, the smart-
€350 million per year by 2030 to reinforce the charging benefits per EV would be around €100
network (Figure 10). By contrast, if uni-directional per year, reducing to around €80 per year in 2050.
smart charging were implemented, the benefits In order to develop this opportunity, transaction
provided to the grid would outweigh the costs costs will need to be kept to a minimum and
of additional hardware, communications and therefore efficient commercial models will be vital.
telemetry, leading to a net benefit across the system As Germany engages in this transition, further
of €140 million per year in 2030. By 2050, the net analysis and dialogue on the optimal approach to
benefit of smart charging would be around €110 grid reinforcement would be beneficial.
million per year, compared to an EV system cost of
€1,350 million per year for unmanaged charging. Another solution for maximising this opportunity
could be through bi-directional, or vehicle-to-grid,
A note of caution should be made at this point, charging. This is because bi-directionally charged
because the value of smart-charging can only be EVs are able to offer their full charge capacity for
realised if EV owners can be convinced to hand the duration of their available charge window,
over control of charging their vehicle to the grid subject to the constraint of being fully charged at
operator. For that they will likely require some departure time. According to this analysis, a 3kW
financial incentive. We can gain an indication of bi-directional charger could generate revenues of
the size of financial incentive that is possible by around €390 per electric vehicle per year, which
calculating the value of smart charging on a per- after accounting for the costs would lead to a
vehicle basis. At the start of the transition, such benefit of around €140 per vehicle per year. Higher
services to the grid are scarce and this value can be charging power of 7-10 kW could create even
worth several hundred euros per vehicle per year. greater opportunities.
300
200
Generation capacity
100 Network reinforcement
million €/yr
Smart charging costs
0
Generation production saving
-100 Ancillary services
Net EV system benefit
-200
-300
-400
PASSIVE CHARGING SMART CHARGING
Figure 10. Investment needs for reinforcing the German electricity grid
under both smart-charging and un-managed charging scenarios
1516
Economic Impacts

     Question: What is the likely range of overall          Secondly, the shift away from petroleum, which
     impacts on German GDP and employment?                  is imported from outside Germany, towards
                                                            electricity and hydrogen, which are largely
                                                            produced domestically, means that Germany
     While there is uncertainty about many of the factors   captures a greater share of the value from energy
     within this transition, we have tried to capture       used in mobility. Figure 11 shows the evolution of
     this uncertainty within the range of assumptions       energy use in the TECH scenario. Petrol and diesel
     used for the macro-economic modelling. This has        consumption is strongly reduced during the 2020s as
     allowed us to identify the main shifts in value that   a result of existing EU CO2 standards, and after that
     would occur within the German economy during           as a result of anticipated climate policies to meet the
     the transition to low-carbon mobility.                 Paris Agreement, as foreseen in our TECH scenario.

     Firstly, the shift towards hybrids, plug-in hybrids    The third main economic impact is that the vehicle
     and fuel-cell vehicles during the 2020s generates      fleet becomes increasingly efficient, due to more
     additional value for Germany, both from cars sold      hybrids, and because electric motors are inherently
     domestically and from exports to other countries       efficient in their own right. This occurs both as a
     pursuing the decarbonisation agenda. Investment        result of existing climate policies (CPI scenario),
     in charging infrastructure also creates value. This    and as a result of increasing electrification and
     is offset by the increasing penetration of battery-    hybridisation to meet future climate policy goals.
     electric vehicles, which are likely to generate        This leads to lower mobility costs for German
     slightly less value for Germany than the petrol and    households, allowing them to shift their spending
     diesel cars they replace, depending on the degree      away from mobility budgets towards other areas that
     to which battery cells are imported.                   typically have more domestic value-added.

                                                                                                          Figure 11.
                                                                                                          Energy expenditure
                                                                                                          for mobility under our
                                                                                                          TECH scenario

17
Using the macro-economic model E3ME, we goals, equivalent to an additional 0.4% of total
have measured the net economic impact of this GDP in 2030 (CPI vs REF). Further innovation to
transition, compared to a reference case in which meet future climate goals would start to further
cars remain unchanged from today. The economic increase national GDP after 2025, equivalent to
impact is sensitive to the location where battery a further 0.1-0.2% of GDP in 2030 (TECH vs CPI),
cells are produced in future, as shown in Figure depending on the assumptions used. The GDP
12. It is also sensitive to changes in the future oil impact is greater if we assume climate policies are
price, because this alters how much the avoided implemented globally, leading to lower global oil
spending on oil imports is worth. prices than in the Reference case.
It is also logical that a global transition away The impact on employment, while linked to the
from oil will lead to lower oil prices globally, and overall economic impact, is somewhat different.
thus oil prices will be higher in a high-carbon To measure the impact on employment, we also
world than in a low-carbon world. This would need to take account of the different employment
increase the value that Germany could capture by intensities in the various sectors that are affected.
switching from imported oil to domestic energy There is a trend for increasing automation of
sources. Thus, a global transition to a low-carbon the auto industry, leading to lower jobs overall,
economy, as foreseen in the Paris Agreement, regardless of the low-carbon transition. Building
delivers a greater GDP benefit for Germany battery-electric vehicles is expected to be less
than a national transition. This is also reflected labour-intensive than building the gasoline and
in Figure 12. Overall, there is a net increase in diesel vehicles they will replace. Meanwhile,
German GDP as a result of making the fleet of building hybrids and plug-in hybrids is expected
cars more efficient to meet current climate policy to be more labour intensive. Our modelling shows
Figure 12.
The impact on
Germany’s GDP
of a transition to
low-carbon cars
18Economic Impacts
that the net employment impact for the auto sector hybrids and fuel-cell vehicles, which also contain
from this transition will depend on the balance increasing technological complexity. However, by
achieved between these various technologies, 2050, the net impact on jobs starts to enter negative
and the degree to which they are imported or territory in our TECH scenario, because hybrids are
produced in Germany. increasingly replaced by battery-electric vehicles,
which are more simple to build and therefore
Figure 13 shows the evolution of jobs in Germany generate less jobs.
as a result of the transition to low-carbon cars in
2030 and 2050 under our central TECH scenario, We have also explored a scenario in which plug-in
relative to the Reference case. As a result of the hybrids remain dominant for longer (TECH PHEV).
economic shifts described above, there is a net In such a case, German workers continue to benefit
increase in employment in the following sectors: from building more complex vehicles for longer,
construction, electricity, hydrogen, services and and the net employment impact in the auto sector
most manufacturing sectors. Employment in remains positive in 2050. While it is tempting to
the fuels sector is reduced. Employment in the conclude that this indicates that Germany should
automotive manufacturing sector is increased prioritise plug-in hybrids to maximise employment,
until 2030, but decreases thereafter in our central this should be evaluated carefully. If Germany were
TECH scenario. to place a major industrial bet on plug-in hybrids, but
then car-buyers in Germany and its export markets
In our TECH scenario, net auto sector jobs are were to favour battery electric vehicles, this would
increased in 2030, because diesel and gasoline create risks of stranded assets. Nonetheless, the
engines are built to greater levels of sophistication analysis does support the assertion that a transition
and efficiency to meet climate goals; and because to plug-in hybrids, if embraced by consumers, is
of the increasing deployment of hybrids; plug-in beneficial for German auto sector employment.
Figure 13.
The employment impact
per sector in Germany
of the transition to low-
carbon cars (thousands)
19Employment impacts within the German auto While economic modelling shows this to be the
sector are an important issue and deserve further case, it is unlikely to be so clear from the perspective
analysis. The benefit of using a macro-economic of the German treasury, which will simply observe
modelling approach is that it allows us to assess the dwindling fuel tax revenues. Nonetheless, it is
economy-wide impacts of this transition, but there worth noting these two important trends during
are limits to the level of detail that can be provided. the transition to low-carbon mobility. And as stated
For the low-carbon transition to be successful, care earlier, this highlights the importance of industry,
will need to be taken of those who will lose their government and civil society working together to
jobs in technologies that become redundant. We find consensus on the optimal approach.
thus recommend further analysis to explore how a
“just transition” can be achieved in the auto sector,
where these changes will take place against an
overall background of increasing automation, which
causes progressively lower employment.
Another important issue brought to light in this
analysis is the reduction in future fuel tax revenues
in Germany. This will firstly be caused by improved
vehicle efficiency – The agreed EU CO2 targets
for 2021 will lead to a fuel tax revenue shortfall of
around €6 billion in Germany by 2030. And the
deployment of ZEVs, as foreseen in our TECH
scenario would reduce fuel tax revenues by a
further €7 billion. However, as described above,
the structural shifts created by this transition
lead to an economic boost, and taxation of this
additional economic activity will entirely offset the
accompanying reduction in fuel tax revenues by
2030, according to the analysis conducted in this
project (Figure 14).
Figure 14.
German government tax
revenues in 2030 in our
REF and TECH scenarios
20Contact European Climate Foundation Rue de la Science 23, 1040 Brussels T +32 2 894 9302 M +32 478 34 00 51 www.europeanclimate.org
You can also read