Analysis of the Top 200 firms and Top 10 Māori businesses - Productivity Commission April 2020 - Deloitte
←
→
Page content transcription
If your browser does not render page correctly, please read the page content below

Analysis of the Top 200 firms
and Top 10 Māori businesses
Productivity Commission
April 2020

Table of contents

  Section                                                                              Page #

  This report                               Purpose, scope and background to inquiry     2

  Deloitte Top 200                          Highlights                                   5

                                            Where are Top 200 companies located?         6

                                            What is the ownership of Top 200
                                                                                         8
                                            companies?

                                            What do Top 200 companies do?                13

                                            How big are Top 200 companies?               25

  Top 10 Māori Businesses                   Highlights, key characteristics              30

                                            About Fisher & Paykel Healthcare and
  Fisher & Paykel Healthcare – Case Study                                                35
                                            Lessons Learned

                                            List of Top 200 businesses and Top 10
  Appendix                                                                               42
                                            Māori Businesses

  References                                Reference list                               44

  Contacts                                  Contacts and key contributors                46

© 2020 Deloitte Touche Tohmatsu                                                                 1
This report
Overview
Purpose                                                                                  Scope of this report
Deloitte Access Economics was commissioned by the New Zealand Productivity               This report provides analysis and insights on the characteristics of New Zealand’s
Commission (the Commission) to analyse the characteristics of New Zealand’s Top          largest firms using the Deloitte Top 200 data set and the Top 10 Māori Business
200 firms.                                                                               Index.

Context                                                                                  The report focuses on the following dimensions from 2000 to 2019:
New Zealand’s economy has performed well on some dimensions in recent years,
relative to other Organisation for Economic Cooperation and Development (OECD)           •   Spatial distribution
countries (Ministry of Business, Innovation & Employment (MBIE), 2016). However,         •   Clusters of firms across sectors and industries
our productivity performance continues to lag behind our OECD peers. 78% of New          •   Size and trends in terms of revenue, assets and profit
Zealand firms established in 2001, which remained active in 2015, continued to have      •   Composition in ownership type
fewer than one employee. Growth in the capital labour ratio has been close to zero,      •   Characteristics of firms with Māori ownership.
and labour inputs continue to account for a larger share of total inputs (New Zealand
Productivity Commission, 2019). On average New Zealand’s frontier firms are less         Out of scope
productive than their international counterparts (Conway, 2018). As such, the            The following dimensions are not included in this report, as the Top 200 data set
diffusion of new technology and business practices appears to be slow.                   does not include the relevant data.

The Government has asked the Commission to undertake an inquiry to identify              •   Exports
policies and interventions that could maximise the economic contribution of New          •   Activities related to research and development
Zealand’s Frontier Firms (the Frontier Firm inquiry).                                    •   Age and maturity of the firm
                                                                                         •   Employment.
The Frontier Firm inquiry into the performance of New Zealand’s Frontier Firms will
focus on:                                                                                Deloitte Access Economics recognises these dimensions are important to informing
• Unlocking the potential of New Zealand’s Frontier Firms against their international    the characteristics of a Frontier firm. In particular, the nature of employment in Top
   counterparts                                                                          200 firms warrants further investigation.
• Identifying opportunities to build comparative advantage
• How innovations of knowledge and technology can diffuse more effectively from          Structure of the report
   Frontier Firms to other New Zealand-based firms (New Zealand Government,              The report is organised in two parts:
   2019).
                                                                                         •   Part 1: Analysis of Top 200 firms
This report will be used to inform the Commission’s inquiry into Frontier Firms.         •   Part 2: Analysis of Top 10 Māori firms.
Although the report will be used as an input to the Frontier Firms inquiry, the report   •   Part 3: Case study on Fisher & Paykel Healthcare.
itself does not focus on Frontier Firms. Further research is required to assess the
relationship between Frontier Firms and large businesses.                                Note: all figures are in real 2019 dollars unless otherwise stated.
© 2020 Deloitte Touche Tohmatsu                                                                                                                                               2
This report
Approach

 We explore characteristics of New Zealand’s largest firms based on                       How do we identify Māori businesses?
 Deloitte’s Top 200 index.
                                                                                          Māori businesses have many dimensions. The report analyses Deloitte’s Top 10
 This report uses Deloitte’s The Top 200 data set to investigate the characteristics of   Māori Business Index from 2014 to 2019, to understand the characteristics of top-
 New Zealand’s largest firms over 2000 to 2019. The Top 200 index ranks New               performing Māori businesses.
 Zealand’s largest for-profit entities by revenue.
                                                                                          For a business to qualify as a Māori business:
 This report is based on the aggregate data for the Top 200 firms. We cannot reveal
 the names of the Top 200 firms in this report. However, details on the individual        •   First, the business needs to identify themselves as Māori
 firms can be viewed on Deloitte’s Top 200 webpage:                                       •   How much of the business is owned by Māori individuals, iwi and other Māori
 https://www.top200.co.nz/analytics/                                                          groups or entities?
                                                                                          •   How does the entity demonstrate it follows Māori kaupapa?
 We make comparisons between the Top 200 firms and the general business                   •   Are the results – the purpose and profits – of the business predominantly to
 population.                                                                                  benefit or promote Māori initiatives?

 This report uses Statistics New Zealand’s Annual Enterprise Survey (AES) to
 compare Top 200 firms to the general business population. The AES includes around
 400,000 New Zealand businesses. In relative terms, the Top 200 firms is a small
 sample.

 Māori businesses have many dimensions – we explore some of the
 dimensions based on Deloitte’s Top 10 Māori Businesses index.

 In the Minister of Finance’s brief on the Productivity Commission’s inquiry into
 Frontier Firms, he asked the Commission to investigate the economic contribution of
 Māori Businesses, and to understand the characteristics of Māori businesses at the
 frontier.

 To inform the inquiry into Frontier Firms, this report explores the characteristics of
 New Zealand’s largest Māori businesses based on Deloitte’s Top 10 Māori Business
 Index. Māori entities are ranked based on total asset value within a particular year.

© 2020 Deloitte Touche Tohmatsu                                                                                                                                               3
Deloitte Top 200

                   4
Deloitte Top 200
Highlights – A comparison between Top 200 firms and the general business community

 Dimensions                       Top 200                                                                General business community

 Spatial distribution             Top 200 businesses are distributed across the country, but are         The majority of businesses are concentrated in regions where the
                                  clustered around major cities, including Auckland, Hamilton,           main centres are located, including Auckland, Waikato, Wellington
                                  Wellington, and Christchurch. There is some evidence of regional       and Canterbury. Regional specialisation has fallen over time.
                                  specialisation in Waikato.

 Industry distribution            High representation in the Manufacturing sector (30%) and Retail       High proportion in Rental, Hiring and Real Estate and Professional,
                                  Trade and Accommodation Sector (18%) based on the number of            Technical, Administrative and Support services.
                                  firms in the Top 200 data set. By revenue, Manufacturing and Retail
                                  Trade made up 25% of total revenue.

 Revenue                          Total revenue was $192 billion in the year to June 2019. Growth        Total revenue in the year to February 2018 was $691 billion. Growth
                                  averaged 2% per annum between 2014 and 2018.                           averaged 5% per annum between 2014 and 2018.

                                  Revenue is more volatile compared to the general business
                                  population, but this may reflect the changing composition of
                                  businesses within the Top 200.
 Assets                           Total asset growth was less than 1% between 2014 and 2018. The         Total asset growth was 5% between 2014 and 2018.
                                  Top 10 businesses contribute about 25% of total asset value.

 Equity                           Equity fell 1% on average between 2014 and 2018.                       No comparison in this report.

                                  Total equity was $111 billion in 2019.

 Profit                           Average growth in total profit after tax (for all Top 200 firms) was   Profit grew by an average of 14% per annum between 2014 and
                                  15% per annum between 2014 and 2018. Throughout the Global             2018.
                                  Financial Crisis (GFC), Top 200 firms struggled to maintain profit
                                  levels. Profit after tax has since recovered to just above pre-GFC
                                  levels.

© 2020 Deloitte Touche Tohmatsu                                                                                                                                                55
Where are Top 200 companies
located?

                              6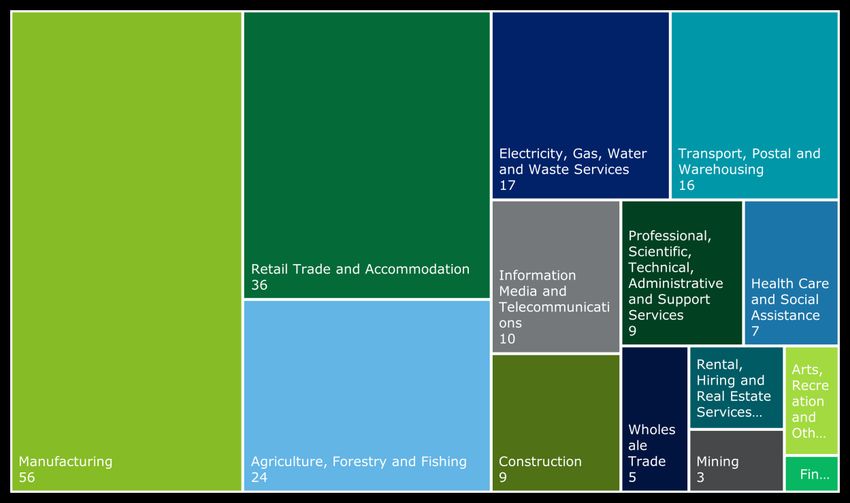
Where are Top 200 companies located?
Top 200 firms are concentrated in major cities
Clusters in main urban centres                                                          Figure 1 – Location of firms in 2019 based on their head office location
Top 200 businesses are distributed across the country, but are clustered around
major cities, including Auckland, Hamilton, Wellington, and Christchurch. Upper North
                                                                                                                                                    1 Whangarei
Island firms contribute the most to the total revenue of Top 200 businesses, at 74%
of the total $173 billion in 2019. Lower North Island and South Island firms                                                                                            Auckland
respectively contribute 14% and 12% ($25 billion and $20 billion).                                                                            123           The majority of Auckland firms are
                                                                                                                                                           in manufacturing, retail,
                                                                                                                                     Morrinsville   Waitoa
Several businesses are located in cities near New Zealand’s largest ports, including                                         Hamilton                      agriculture, and transport.
                                                                                                                                                1 1
Auckland, Tauranga, Wellington, Napier, Otago and Lyttelton (Champion Freight,                       70% of firms in the Waikato region           5     3 Tauranga
2018). Close proximity to ports helps to facilitate access to overseas markets for                   are in the manufacturing sector,
                                                                                                     with the remainder in agriculture
export lead businesses.                                                                              and electricity.

Regional sectorial divergence
                                                                                                                                  New Plymouth     3
Top 200 businesses operate across a range of industries, particularly in Auckland,                                                                                     1 Napier
Wellington, and Christchurch. While there does not appear to be regional
                                                                                                                                                              2
specialisation in these centres, Hamilton has a cluster of manufacturing firms.                                                         Palmerston North
                                                                                                                                                 Porirua
Businesses outside of the main population centres had a stronger presence in the                                                                   1
                                                                                                                                                                         Wellington
                                                                                                                                  Nelson 2       2
manufacturing sector, perhaps reflecting a need for more and cheaper land to                                                            Lower Hutt 20                    Firms in the Wellington region are
                                                                                                                                                                         present in retail trade and
undertake their operations.                                                                                                                                              accommodation, professional
Comparison to the general business population                                                                                     New Zealand                            services, information media and
                                                                                                                                                                         telecommunications, and
                                                                                                                   Hokitika   1                                          electricity.
The spatial distribution of Top 200 firms was broadly similar to that of the general
business population in the AES. The majority of businesses are concentrated in                                                                         Christchurch

regions where the main centres are located, including Auckland, Waikato, Wellington                                                 1
                                                                                                                                         12            Christchurch firms operate across
                                                                                                                                                       agriculture, manufacturing, electricity,
and Canterbury. However, firms in Auckland reflected 61% of the Top 200 data set,                                                       Rakaia         health care, and construction.
but only 34% of the AES data set.                                                                                             1 Timaru

Note: the latest AES data available is from 2018 and splits business units by region,       Queenstown         1
rather than head office location. Top 200 data is based on head office location.
                                                                                                                          2 Dunedin

                                                                                            Invercargill   2

                                                                                                                                                                      Source: Deloitte

© 2020 Deloitte Touche Tohmatsu                                                                                                                                                                               7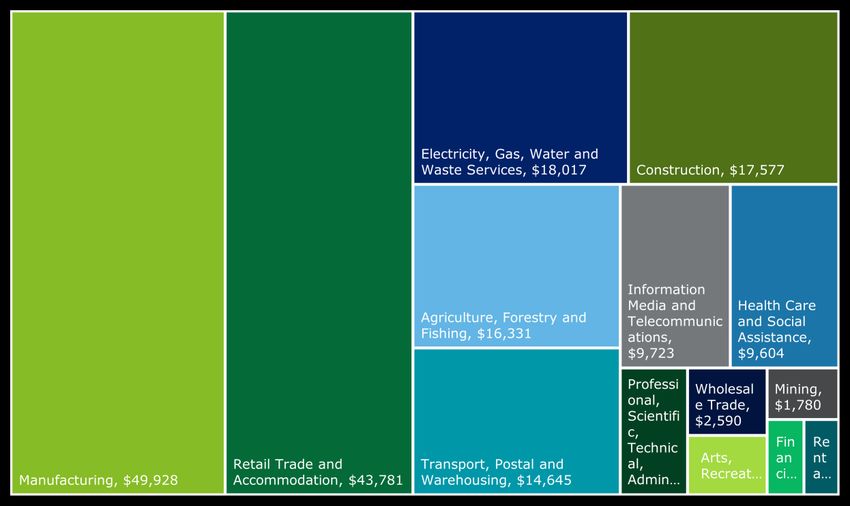
What is the ownership of Top 200
companies?

                                   8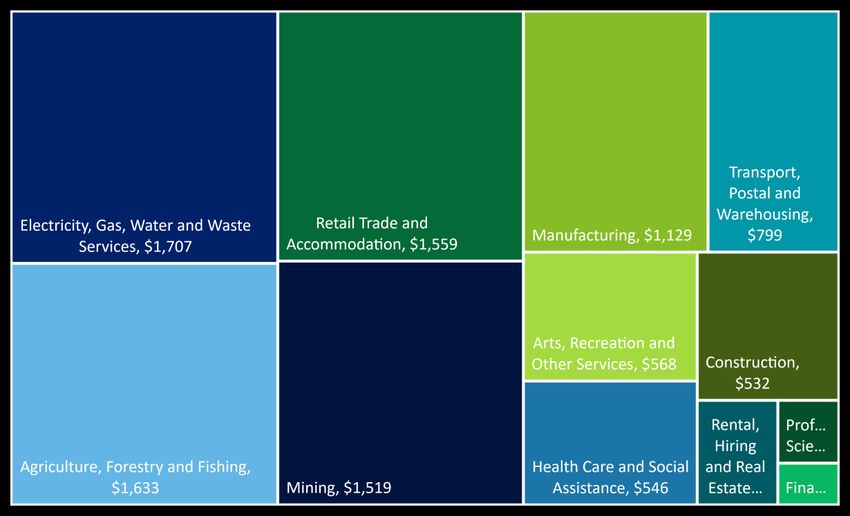
What is the ownership of Top 200 companies?
The presence of overseas owned firms has increased between 2000 and 2019, while
the number of NZX listed businesses remained below 30%
                                    Figure 2 – Ownership structure of Top 200 businesses, 2000, 2009, 2019, number of firms
                                                 6%                                                                         2% 4%
                                            4%                                      2% 5%
                                                                                                                                                 (COE) Council-
                                  2000                               2009                                2019                                    owned entity
                                                              29%
                                                                                                                                          23%    (SOE) State-
                                                                                                 25%
                                                                                                                                                 owned entity
                                                                                                                                                 NZ listed company

                                                                    55%
                                                                                                                                                 NZ private
                                   43%                                                                                                           company
                                                                                                          56%
                                                                                                                                                 Overseas owned
                                                                                              13%                                      15%
                                                           18%
                             Source: Deloitte

Top 200 businesses are categorised into five ownership structures: council-owned entity (COE), state-owned entity (SOE), New Zealand listed company, New Zealand private
company, and overseas owned. Farmer owned cooperatives are either classified as New Zealand listed or New Zealand private companies.
Overseas owned firms increasingly make up the bulk of the Top 200 index, with New Zealand listed companies the second largest category. COEs and SOEs comprise a small
percentage of Top 200 firms.
The presence of New Zealand Stock Exchange (NZX) listed businesses has remained low between 2000 and 2019. Approximately a quarter of Top 200 firms are
listed on NZX. However, the percentage of Top 200 listed firms is falling. This reflects a general decrease in the presence of NZX listed firms over time; there were 217 listed
companies in 1990, but only 132 in 2019. This decrease has been driven in part by the growing presence of the Australian Stock Exchange (ASX) in New Zealand, with an
Auckland office set up in 2019 to encourage unlisted New Zealand businesses to list on the ASX (ASX, 2019). Other New Zealand businesses have also turned to private
equity companies or cheap bank lending to fund growth, instead of listing on the NZX. There has been considerable movement in the composition of listed firms in the Top
200 index, with just 11% of businesses listed across 2000, 2009 and 2019. 14% of these businesses were listed in two out of the three years selected for review.

A question that warrants further investigation is whether the overseas owned firms were overseas firms entering New Zealand or whether the firms were New Zealand firms
who had a change in ownership.

© 2020 Deloitte Touche Tohmatsu                                                                                                                                                9
What is the ownership of Top 200 companies?
NZX listed firms previously made up the bulk of profit, but were overtaken by overseas
owned firms in 2019
Figure 3 – Ownership structure of Top 200 businesses, 2000, 2009, 2019, profit after tax (2019 dollars)
5% 2% 2% 2%
7%
21% 9% (COE) Council-owned
2000 2009 2019 entity
35% (SOE) State-owned
entity
48% 38% NZ listed company
12%
NZ private company
Overseas owned
4% 52%
Source: Deloitte 53%
10%
Despite the relatively low presence of NZX listed firms in the Top 200, they made up the largest share of profit after tax in 2000 and 2009, at 53% and 52%, respectively.
However, this contribution fell to 38% in 2019, driven by the increasing contribution of overseas owned firms to profit, more than doubling from 21% in 2000 to 48% in
2019. This reflects the rising number of overseas owned firms in the Top 200.
Profit after tax for privately owned New Zealand comprised 12%, 4% and 10% across the three years. The small share of profit generated by COEs and SOEs reflects the low
number of these organisations in the Top 200.
© 2020 Deloitte Touche Tohmatsu 10What is the ownership of Top 200 companies?
New Zealand listed companies show some of the highest revenue in the Top 200
In 2009 and 2019, average revenue was highest for NZ listed companies at $1.4 billion and $1.8 billion respectively. This reflects a change from 2000, where revenue was
highest for New Zealand private companies.
COEs have the lowest average revenue across all three years.
Figure 4 – Average revenue across ownership forms, 2000, 2009, 2019 (2019 dollars, $’000)
2,000
1,800
1,600
Average Revenue, $’000
1,400
1,200
1,000
800
600
400
200
0
(COE) Council-owned entity (SOE) State-owned entity NZ listed company NZ private company Overseas owned
Source: Deloitte 2000 ownership structure 2009 ownership structure 2019 ownership structure
© 2020 Deloitte Touche Tohmatsu 11What is the ownership of Top 200 companies?
Each ownership type has volatile revenue growth over time – some more than others
Figure 5 – Growth across ownership forms, by revenue, annual % change (2019 dollars)
60%
50%
40%
30%
20%
Growth rate
10%
0%
-10%
-20%
-30%
-40%
-50%
2001 2002 2003 2004 2005 2006 2007 2008 2009 2010 2011 2012 2013 2014 2015 2016 2017 2018 2019
(COE) Council-owned entity (SOE) State-owned entity NZ listed company NZ private company Overseas owned
Source: Deloitte
© 2020 Deloitte Touche Tohmatsu 12What do Top 200 companies do?
13What do Top 200 companies do?
The Manufacturing, Retail, and Primary Sectors made up over half of Top 200 firms in
2019
High level representation of Top 200 firms in three industries By total revenue, the Manufacturing and Retail Trade industries made up 49%, at $50
billion and $4 billion, respectively.
In 2019, 58% of Top 200 businesses were in three ANZSIC Level two industries
(level 2 industry) in 2019. Close to 30% of the Top 200 were in the Manufacturing The third largest industry by total revenue was Electricity, Gas, Water and Waste
industry, or 56 firms. The Retail Trade and Accommodation, and Agriculture, Forestry Services, with total revenue of $18 billion in 2019. Close behind was Construction
and Fishing industries had 18% and 12% of businesses in the Top 200, respectively. with just under $18 billion.
Figure 6 – Level 2 industry distribution of Top 200 firms, 2019, number of Figure 7 – Level 2 industry distribution of Top 200 firms, 2019, by revenue
firms (2019 dollars) ($ millions, 2019 dollars)
Source: Deloitte Source: Deloitte
© 2020 Deloitte Touche Tohmatsu Note: Used the MS-16 classification but not all MS-16 industries are represented in the Top 200 data set.
14What do Top 200 companies do?
Four industries made up the bulk of profit of Top 200 firms in 2019
In 2019, four industries made up the 63% of the profit of Top 200 firms: Electricity, Figure 8 – Level 2 industry distribution of Top 200 firms, 2019, by profit ($
Gas and Waste Services, Retail Trade and Accommodation, Agriculture, Forestry and millions, 2019 dollars)
Fishing, and Mining.
While Electricity, Gas, Water and Waste Services is the fourth largest in terms of the
number of firms and third largest by revenue, it makes the largest contribution to
profit, at $1.7 billion. Similarly, the Mining industry’s profit share is much larger than
its number of firms and revenue. In contrast, Manufacturing is the largest industry by
number of firms and revenue, but the fifth largest by profit.
There are some differences in profits compared to the number of firms and revenue
for smaller firms; for example, Arts, Recreation, and Other Services comprised 6% of
profit but just 1.5% of firms and 1.2% of revenue.
Source: Deloitte
Source: Deloitte
© 2020 Deloitte Touche Tohmatsu 15What do Top 200 companies do?
The industry composition of Top 200 firms remained relatively stable between 2009
and 2019
Figure 9 – The number and % growth of Top 200 businesses in ANZSIC Level 2 industries, 2009 and 2019 (2019 dollars)
70
60 -14% Overall, the distribution of Top 200 firms across sectors
has remained relatively stable over time. However, they
50
Number of firms
have become less concentrated in the two largest
industries – Manufacturing and Retail Trade and
40 -20% Accommodation.
30
+50%
20 +21% +60%
-17% +29% +29%
10 +17%
-29% +33% -25% +200%
-67%
0
Source: Deloitte, Statistics New Zealand ANZSIC Level 2 industry
2009 2019
© 2020 Deloitte Touche Tohmatsu 16What do Top 200 companies do?
Key industries for Top 200 firms are significantly different to the general business
community
Figure 10 – Comparison of the proportion of Top 200 firms and New Comparison of the Top 200 make up with all New Zealand business units
Zealand Business units in ANZSIC Level 2 industries, 2019, % of firms
Although Top 200 businesses are represented in all industries (at Level 2 industry),
they are concentrated in only a handful. This distribution is not reflected by the
Arts, Recreation and Other Services
Top 200
industry composition of overall New Zealand business units.
All business units
Health Care and Social Assistance In the year to June 2019, close to 30% of Top 200 firms were in the manufacturing
Professional, Scientific, Technical, Administrative and sector, compared to 4% of all New Zealand businesses. This is unsurprising, given
Support Services the industry has a number of very large firms generating $1 billion of revenue or
Rental, Hiring and Real Estate Services
more per year. According to the AES, the industry produces around 15% of total
private sector revenue in the year to February 2019.
Level 2 ANZSIC Industry
Financial and Insurance Services
Similarly, Top 200 businesses are over represented in the Retail Trade and
Information Media and Telecommunications Accommodation Sector at 18%, compared to 8% overall in New Zealand. This
industry includes large retail chains, supermarket chains, and hotels. The total New
Transport, Postal and Warehousing
Zealand Retail trade and Accommodation sector has a number of very large and
Retail Trade and Accommodation
small firms – reflected in the higher number of business units compared to the
manufacturing sector.
Wholesale Trade
The Agriculture, Forestry and Fishing sector is similar in the Top 200 Index as it is
Construction for the general business population – with the industry contributing 11% and 12%
of the Top 200 and New Zealand Business units, respectively.
Electricity, Gas, Water and Waste Services
In contrast, Rental, Hiring and Real Estate, and Professional, Technical,
Manufacturing
Administrative and Support services had a lower proportion of Top 200 businesses
Mining than the overall business population, in 2019.
Agriculture, Forestry and Fishing
0% 10% 20% 30%
Source: Deloitte
% of firms
© 2020 Deloitte Touche Tohmatsu 17How big are Top 200 companies?
Revenue growth in the last five years has occurred primarily in Health Care, Wholesale
Trade, and Financial and Insurance Services
Figure 11 – Revenue distribution across ANZSIC Level 2 industries and Average revenue per entity lifted across most industries in the 10 years to 2019.
growth rate of Top 200 firms, 2019
Health Care and Social Assistance
This industry saw average revenue growth of 221% between 2009 and 2019. This
+32%
growth may be a combination of individual growth in revenue along with a change in
Financial and Insurance Services
composition of the firms in the Top 200. Revenues includes Government purchases
Arts, Recreation and Other Services -24% of health services.
Mining +23%
Wholesale Trade
Rental, Hiring and Real Estate Services -38% Average revenue for businesses in The Wholesale Trade sector lifted by 75%
ANZSIC Level 2 industry
between 2009 and 2019. Revenue lifted from $288 million to $500 million.
Wholesale Trade +75%
Health Care and Social Assistance +221% Financial and Insurance Services
Average revenue for businesses in the Financial and Insurance services sector lifted
Professional, Scientific, Technical, Administrative and
Support Services
+24% by 32% between 2009 and 2019. Revenue lifted from $1.0 billion to $1.3 billion.
Construction
+6% Construction industry
Information Media and Telecommunications -12% Between 2009 and 2010, the number of businesses in the Top 200 in the
-22% construction industry lifted by 29%, with average revenue of these businesses rising
Transport, Postal and Warehousing
by 6%.
Electricity, Gas, Water and Waste Services +3%
There are fewer than 10 Top 200 businesses in the construction industry between
Agriculture, Forestry and Fishing -5%
2009 and 2019, but the average revenue per construction firm has almost
Retail Trade and Accommodation +20% consistently been the highest. The two largest entities, with revenue of up to four
times the industry average, have been in the Top 200 since 1997. Two others have
Manufacturing +15% been in the index for 15 years, while the next three largest have been in the index
for three years or less.
$0 $500 $1,000 $1,500 $2,000
Average revenue, $m
Source: Deloitte
2009 2019
© 2020 Deloitte Touche Tohmatsu 18How big are Top 200 companies?
Average profit after tax generally grew across most industries between 2009 and 2019
Figure 12 – Profit after tax distribution across ANZSIC Level 2 industries Average profit after tax fell across the Wholesale Trade, Information Media and
and growth rate of Top 200 firms, 2019 Telecommunications, and Transport, Postal and Warehousing industries between
2009 and 2019.
+502% Health Care and Social Assistance
Financial and Insurance Services
As with revenue, profit after tax has increased substantially from -$3 million in 2009,
Arts, Recreation and Other Services +40% to $78 million in 2019.
Mining +746%
Financial and Insurance Services
Rental, Hiring and Real Estate Services +202% Average revenue for businesses in the Financial and Insurance services sector lifted
grew by 502% in the 10 years to 2019, up from -$16 million in 2009 to $64 million.
ANZSIC Level 2 industry
Wholesale Trade -150%
Health Care and Social Assistance
+2945% Mining
The mining industry saw the second largest increase in profit, rising from $60 million
Professional, Scientific, Technical, Administrative and 0%
Support Services in 2009 to $506 million in 2019.
Construction +184%
Retail Trade and Accommodation
Information Media and Telecommunications -118% This industry has also seen substantial growth, rising from $7 million in 2009 to $43
-24% million in 2019.
Transport, Postal and Warehousing
Electricity, Gas, Water and Waste Services +21%
Agriculture, Forestry and Fishing +242%
Retail Trade and Accommodation +504%
Manufacturing +5%
-$100 $0 $100 $200 $300 $400 $500 $600
Average profit after tax, $m
Source: Deloitte
2009 2019
© 2020 Deloitte Touche Tohmatsu 19What do Top 200 companies do?
Manufacturing industry
Manufacturing sector firms are decreasing, but remain the largest Top 200 Figure 13 – The proportion of Top 200 firms and New Zealand Business
industry units by ANZSIC Level 2 industries, 2009 and 2019, number of firms
The manufacturing industry has consistently had the largest number of Top 200 2009
businesses since 2009. This is despite the number of Top 200 businesses in the Beverage and Tobacco
industry falling by 14% between 2009 and 2019.
Fruit, Oil, Cereal and Other Food
The three largest manufacturing businesses in the Top 200 have remained in the
index since 2000. In 2019, around 40% of total manufacturing industry revenue in
the Top 200 were made up by three businesses. These firms are in industries which Dairy
are heavily reliant on exports, including dairy or meat product manufacturing.
Polymer Product and Rubber
Businesses manufacturing agriculture products have enjoyed strong growth in
exports from late 2016 through to 2019. High export prices boosted the terms of Meat and Meat
trade near record highs and volumes were sustained by strong international
demand. In particular, Dairy, Forestry and Fruit benefited from strong demand
Primary Metal and Metal
offshore, feeding into regional growth.
2019 Wood
Fertiliser and Pesticide
Source: Deloitte
© 2020 Deloitte Touche Tohmatsu 20How big are Top 200 companies?
Average revenue of the seven largest Manufacturing level four industries over time
Manufacturing sector revenue growth broken down by sub sectors
The Dairy Product Manufacturing industry has the highest average annual revenue, at around $3 billion in 2019, 15% higher than in 2009.
Meat and Meat Product manufacturing, and Electric and Electrical Equipment manufacturing each had revenue of above $1 billion in 2019. Electric and Electrical Equipment
manufacturing average revenue has lifted quickly from 2016. Primary Metal was slightly negative and Fabricated Metal was relatively flat, but all the other industries have
seen positive growth, especially in recent years.
Figure 14 – Average revenue of Top 200 manufacturing firms in ANZSIC Level 4 industries, 2019 ($ millions)
Revenue for the Dairy Product Manufacturing is on the right axis, and all other industries are measured by the axis on the left hand side (2019 dollars)
1,600 8,000
1,400 7,000
Average Revenue, $m
1,200 6,000
1,000 5,000
800 4,000
600 3,000
400 2,000
200 1,000
0 0
2000 2001 2002 2003 2004 2005 2006 2007 2008 2009 2010 2011 2012 2013 2014 2015 2016 2017 2018 2019
Meat and Meat Product Manufacturing Electronic and Electrical Equipment Manufacturing
Fertiliser and Pesticide Manufacturing Pulp, Paper and Converted Paper Product Manufacturing
Primary Metal and Metal Product Manufacturing Fabricated Metal Product Manufacturing
Source: Deloitte
Dairy Product Manufacturing (RHS)
© 2020 Deloitte Touche Tohmatsu 21What do Top 200 companies do?
Retail Trade and Agriculture sector firms
Retail Trade and Accommodation Agriculture, Forestry, and Fishing
The number of Retail Trade and Accommodation firms in the Top 200 has fallen by The Agriculture, Forestry, and Fishing industry had the third largest number of
20% in the 10 years to 2019. Six of the 10 largest entities within this industry firms in 2019. It saw growth of 50% in the number of firms making the Top 200
have remained in the Top 200 for the last 10 years. These entities are primarily in from 2009.
the Supermarkets and Specialised Food Retailing, Motor Vehicle and Motor Vehicle
Parts and Fuel Retailing industries. Average revenue lifted by just 11% over the 10 year period to 2019.
We note that there may be a reduction in the firms in this industry, but the
remaining firms may have grown larger. This is an area that requires further
investigation.
Figure 15 – Largest five Level 4 Retail Trade and Accommodation Figure 16 – Largest four Level 4 Agriculture, Forestry, and Fishing
industries, number of firms industries, number of firms
8
16
14 7
12 6
10 5
8 4
6 3
4 2
2 1
0 0
2009 2014 2019 2009 2014 2019
Motor Vehicle and Parts Retailing Furniture, Electrical and Hardware Retailing Agriculture, Forestry and Fishing Support Services
Supermarket and Grocery Stores Food and Beverage Services Forestry and Logging
Fuel Retailing Horticulture and Fruit Growing
Source: Deloitte Source: Deloitte Sheep, Beef Cattle and Grain Farming
© 2020 Deloitte Touche Tohmatsu 22What do Top 200 companies do?
Export intensive industries-Revenue
In general, industries that rely heavily on exports include the Agriculture sector and those relient on Tourism exports, such as Accomodation and Retail Trade.
Some of the key industries in the Top 200 data set are also exposed to exports. For example, the Dairy Product Manufacturing sector generated around $25 billion in
revenue in 2019. Horticulture and Fruit Growing generated approximately $6 billion in revenue in the same year.
Figure 17 – Revenue by selected industries more likely to export, 2019 ($’000)
30,000
25,000
Revenue, $’000
20,000
15,000
10,000
5,000
0
Dairy Product Horticulture and Fruit Meat and Meat Product Forestry and Logging Agriculture, Forestry Accommodation and Wood Product
Manufacturing Growing Manufacturing and Fishing Support Food Services Manufacturing
Services and Hunting
Source: Deloitte
© 2020 Deloitte Touche Tohmatsu 23What do Top 200 companies do?
Export intensive industries- Profit after tax
Forestry and Logging generated the largest profit after tax in 2019, at roughly $1.3 billion. This was much higher than the profit generated by other industries. While Dairy
Product Manufacturing produced the most revenue across these industries in 2019, it did not return a profit in the same year.
Figure 18 – Profit by selected industries more likely to export, 2019 ($’000)
1,600
1,200
800
Profit, $’000
400
0
-400
Forestry and Logging Horticulture and Fruit Accommodation and Wood Product Agriculture, Forestry and Meat and Meat Product Dairy Product
Growing Food Services Manufacturing Fishing Support Services Manufacturing Manufacturing
Source: Deloitte and Hunting
© 2020 Deloitte Touche Tohmatsu 24How big are Top 200 companies?
25How big are Top 200 companies?
Revenues and profits are clustered around the lower end, but there are some large
firms in the New Zealand market
Figure 19 – Revenue distribution of Top 200 firms, by number of firms ($ Figure 20 – Profit distribution of Top 200 firms, by number of firms ($
millions, 2019 dollars) millions, 2019 dollars)
2008 2019 2008 2019
80 60
Number of firms
Number of firms
60
40
40
20 20
0
0
Revenue range ($m) Profit range ($m)
Source: Deloitte Source: Deloitte
Most Top 200 businesses are concentrated at the lower end of the revenue distribution spectrum, with revenues lower than $299 million. However, there are 40 firms with
revenues greater than $1 billion. This distribution is expected in the New Zealand market, given our largest businesses remain much smaller than large overseas firms, such
as those in the United States. Moreover, the concentration of businesses at the lower end of revenue reflects the large number of small and medium sized enterprises (SMEs)
in the New Zealand market.
The revenue distribution has changed at the lower end of the distribution but looks similar from the $600 million and above buckets. A higher proportion of Top 200
businesses were in the $100 – $199 million bucket in 2008 than in 2019. In 2019, there was one firm in this bucket, while most firms were in the $200 - $299 million bucket.
This is due to both the presence of new firms in the Top 200 index, and the growth of existing firms. The number of firms with mid-range revenues ($400 – $999 million) has
remained relatively constant between 2000 and 2019. There were 40 firms with revenue greater than $1 billion in 2019, up from 38 firms in 2008.
The profit distribution of Top 200 firms in 2008 and 2019 is similar to the revenue distribution, with most firms concentrated in the $0 - $9 million bracket. 39 businesses had
profits greater than $80 million in 2019, up from 34 in 2008.
© 2020 Deloitte Touche Tohmatsu 26How big are Top 200 companies?
Top 200 firms have shown steady growth over time
Top 200 revenue increased from $94 billion in 2000 to $193 billion in 2019. Average Figure 21 – Total revenue of Top 200 businesses ($ millions)
revenue increased from $527 million to $965 million over the same period. Although
individual business revenue has increased over this period, this growth also reflects a 250
change in the composition of the Top 200 as larger businesses enter the New
Total Revenue, $m
Zealand market. 200
Top 200 firms appeared resilient during the GFC
150
Revenue growth fell significantly during the GFC. Across all Top 200 firms, revenue
fell 3% in the year to June 2010. Average revenue for the Manufacturing, and 100
Information Media industries rose during this period, while Retail Trade and Energy
sectors saw average revenues fall. 50
Profit after tax increased from 2000 to its peak of $9 billion in 2007, before dropping
sharply to $4 billion in 2009 as the effects of the GFC set in.
2000 2002 2004 2006 2008 2010 2012 2014 2016 2018
Throughout the GFC, Top 200 firms were able to maintain revenue but struggled to Source: Deloitte
maintain profit levels. Profit after tax has since recovered to just above pre-GFC
levels. Figure 22 – Change in profit after tax, Top 200 compared with all businesses
Profit 100%
Growth in profit after tax for Top 200 firms has fluctuated significantly across this
period, and was negative around the GFC. Average profit after tax growth between
2014 and 2018 was similar for the general business population than Top 200 firms,
Growth rate
50%
at 14% and 15%, respectively.
0%
-50%
2000 2012 2015 2018
Profit after tax - top 200 Profit after tax - all firms
© 2020 Deloitte Touche Tohmatsu Sources: Deloitte, Statistics New Zealand 27How big are Top 200 companies?
Growth in asset base and equity varied between 2000 and 2019
Figure 23 – Total equity and assets of Top 200 firms
Asset base ($000 millions, 2019 dollars)
Total equity Total assets
The asset base of Top 200 businesses totalled about $243 billion in 2019, up from 300
$240 billion in 2014. The assets included are current and non-current assets,
investments, tangible and intangible assets, deferred tax assets and goodwill. 250
200
The largest 10 businesses in the Top 200 data set contribute about 25% of total
$m
asset value. 150
Asset growth for all New Zealand businesses averaged 4.5% between 2014 and 100
2018, while for Top 200 businesses average asset growth was less than 1%. Note 50
that only a small amount of data was available on the financial position of New
Zealand businesses from the AES. This data suggested that for years 2014 to 2018,
asset growth was smaller for Top 200 firms than the general business community. 2000 2002 2004 2006 2008 2010 2012 2014 2016 2018
Source: Deloitte
Equity
Figure 24 – Asset growth, June year % growth (2019 dollars)
Total equity has fluctuated circa $100 billion since 2010. In the 10 years to 2019,
total equity lifted at an annual average rate of 7%. Growth in equity largely followed Assets - top 200 Equity - top 200 Assets - all firms
asset growth.
30%
20%
Growth rate
10%
0%
-10%
-20%
-30%
2000 2003 2006 2009 2012 2015 2018
Source: Deloitte
© 2020 Deloitte Touche Tohmatsu 28How big are Top 200 companies?
Average return on investment fluctuated between 2000 and 2007, before dipping
following the GFC and recovering in recent years
Return on investment
Average return on assets (ROA) and return on equity (ROE) fluctuated between 2000 and 2007, with an average ROA of 4% per annum, and ROE of 9% per annum.
However, following the GFC, the average return on investment for Top 200 firms was lower. Between 2009 and 2013, ROA flat lined at 2% per annum, while ROE hovered
around the 4-5% mark. These metrics have since recovered and trended upwards since 2013. ROE has been consistently higher than ROA.
Figure 25 – Average ROA and ROE of Top 200 firms (2019 dollars)
16%
14%
12%
Average Return Rates
10%
8%
6%
4%
2%
0%
2000 2001 2002 2003 2004 2005 2006 2007 2008 2009 2010 2011 2012 2013 2014 2015 2016 2017 2018 2019
ROA ROE
Source: Deloitte
© 2020 Deloitte Touche Tohmatsu 29Top 10 Māori Business Index
30Firms with Māori ownership
What do our large Māori Businesses look like?
10
Broad trends we identify are:
• Top 10 Māori Businesses show continued growth in asset value. On average, the total asset value was $6 billion between 2014
Māori businesses and 2019. Māori businesses are diversified, making them more resilient.
• Although Māori businesses have a more holistic focus on iwi wellbeing and profit gaining investments to support iwi members,
the average profit after tax over the period 2014 and 2019 was 44%.
• The top five ranked Māori businesses are all affiliated to settled iwi. Four of these entities received the largest Treaty
$6b settlements to date ($170 million). Three of the Top 10 Māori Businesses settled during the 1990s (1992,-95,-97) providing
opportunity for their businesses to mature, with over 20 years to develop their business ventures and investments.
• A total of 16 businesses have made the Top 10 Māori Business Index between 2014 and 2019. During this period a variety of
Māori businesses have been ranked in the index, including:
• Iwi trusts
• Private companies
• Education organisations
Asset value • Pan-iwi organisations (organisations managed/owned by multiple iwi)
(Average 2014 to 2019)
• These Māori businesses, particularly those identified in the Top 10, have investments into other subsidiaries or Māori
businesses. Typically iwi trusts have diversified portfolios, as expressed in the Iwi Investment Report (TDB Advisory, 2019),
however, this is not always the case.
• Further investigation is needed into the nature of debt and leverage of Māori firms relative to Top 200 firms.
44%
Average profit after tax %
(Average 2014
© 2020 Deloitte Touche to 2019)
Tohmatsu 31Firms with Māori ownership
Where are they located?
The Top 10 Māori Businesses are concentrated in Te ika-a-maui.
Based on our research, the Top 10 Māori Businesses, defined on page three of this report are in fact iwi/hapū established or managed. This is not surprising given the
significant settlements made through Te Kāhui Whakatau (treaty settlements). Businesses are therefore mapped to the iwi regions or rohe1 through their known iwi
affiliations, or in cases of pan-tribal involvement, mapped to multiple regions or areas of the country.
Most of the Top 10 Māori Businesses operate across a diverse number of industries.
Figure 26 – Location of Top 10 Māori Businesses
Tokoroa
Te Waipounamu (South Island) Te ika-a-maui (North Island)
Tamaki Makaurau Te Arawa
• We identified two of the Top 10 Māori • We identified one out of the Top 10 businesses
Businesses have locations across Te Waikato-Tainui
has multiple locations across Te ika-a-maui.
Mātaatua
Waipounamu (light green area). While this business is not included on the map,
Ngāmotu Te Tai Rawhiti other firms are represented by a dot on the
• The lack of entities identified throughout Te
map and their respective link to an iwi region.
Waipounamu2 could also be influenced by local Whanganui nui tonu
iwi, as a single iwi occupies Te Waipounamu. • The Top 10 Māori Businesses are concentrated
within Te ika-a-maui, and even more so
• There is a strong focus on the Agriculture, Whakatū
within the Central-North Island area (dark
Forestry and Fishing industries in Te
green area).
Waipounamu.
• This concentration aligns with the overall
Porirua
geographical split of Māori Businesses.
According to Statistics New Zealand, over half
of all Māori business locations are in the Bay of
Plenty (Te Arawa/Mātaatua), Waikato (Waikato-
Tainui), and Gisborne regions (Te Tai Rawhiti).
• There is a strong focus in the Property
Services, Agriculture, Forestry and Fishing
1. Te Puni Kokiri: find iwi by map, http://www.tkm.govt.nz/map/
and Cultural and recreational industries.
2. Te Waipounamu. For the purposes of this analysis excludes Blenheim and the Source: Deloitte
Chatham Islands
© 2020 Deloitte Touche Tohmatsu 32Firms with Māori ownership
Continued growth in Top 10 Māori Businesses
Figure 26 – Total asset value for Top 10 Māori Businesses, 2014 to 2019 ($ Figure 27 – Average ROA and ROE for Top 10 Māori Businesses 2014 to
millions, 2019 dollars) 2019, % (2019 dollars)
8,000
12%
7,000
10%
Average Return Rates
6,000
Total Assets, $m
5,000 8%
4,000 6%
3,000
4%
2,000
2%
1,000
0 0%
2014 2015 2016 2017 2018 2019 2014 2015 2016 2017 2018 2019
Asset Value: Te ika-a-maui (North Island)
ROA ROE
Source: Deloitte Asset Value: Te Waipounamu (South Island) Source: Deloitte
There is continued growth in Top 10 Māori Businesses in terms of their asset value between 2014 and 2019.
The asset base of Top 10 Māori Businesses totals about $7 billion - an increase from about $5 billion in 2014. The proportion of asset values remained relatively consistent
between Te ika-a-maui and Te Waipounamu between 2014 and 2019, approximately 65% and 35%, respectively. The top five Māori businesses contribute about 85% of
total asset value. The first ranked business has consistently performed highly as first ranked for six years (2014 – 2019).
Total equity and asset value of the Top 10 Māori Businesses follows a similar trend. Both equity and asset values increased by 6% in 2015 and 12% in 2016. Since then,
equity has accelerated at twice the rate of assets, but reached relatively flat growth between 2018 and 2019.
ROA and ROE grew steadily between 2014 and 2019, but dropped in 2019. While total assets and total equity trended upwards beteween 2014 and 2019, profit after tax
fell significantly. The changes in ROA and ROE reflect this. In 2019, ROA was 3% and ROE was 4%.
© 2020 Deloitte Touche Tohmatsu 33Firms with Māori ownership
How big are our Top 10 Māori Businesses?
The Top 10 Māori Businesses were ranked according to multiple factors, including Figure 29 – Average profit after tax for Top 10 Māori Businesses 2014 to
revenue. 2019 ($ millions, 2019 dollars)
The average revenue of Top 10 Māori Businesses was $89 million in 2014, and $76
million in 2019. 60
Average Profit After Tax, $m
The kaupapa (purpose) of Top 10 Māori Businesses likely diverges from Top 200 50
Businesses. Businesses must demonstrate Māori kaupapa as part of a wider
criteria to be identified as a Māori business in the Top 10 index. This generally 40
means a more holistic focus for Māori businesses on iwi wellbeing and profit
gaining investments to support the prosperity of iwi members. 30
20
Figure 28 – Average revenue for Top 10 Māori Businesses 2014 to 2019 ($
millions, 2019 dollars) 10
120 0
2014 2015 2016 2017 2018 2019
100 Source: Deloitte
Average Revenue, $m
80 The kaupapa driven profit gaining is not necessarily evident in the profit after tax
metric for the Top 10 Māori Businesses. For example, even though the average
60 profit after tax was 89% for a Māori business in 2014, this is largely driven by
annual asset revaluations and tax benefits provided to Māori businesses.
40
20
0
2014 2015 2016 2017 2018 2019
Source: Deloitte
© 2020 Deloitte Touche Tohmatsu 34Fisher & Paykel Healthcare – Case
Study
35About Fisher
& Paykel
Healthcare
© 2020 Deloitte Touche Tohmatsu 36Introduction Driven by the needs of patients, Fisher & Paykel Healthcare continues be a market leader in respiratory care products About Fisher & Paykel Healthcare Fisher & Paykel Healthcare (F&P Healthcare or the Company) is a leading designer, manufacturer and marketer of products and systems for use in respiratory care, acute care, surgery, and the treatment of obstructive sleep apnea. F&P Healthcare is based in Auckland, New Zealand and its operations are run by over 4,800 staff in 39 countries. F&P Healthcare entered the respiratory care market in 1971. When it split from Fisher & Paykel Industries (F&P Industries) in 2001, the Company listed on the New Zealand Stock Exchange (NZX). F&P has built a strong and loyal base of investors through listing on the NZX, with many of the shares in the company New Zealand owned. F&P Healthcare estimated its products would be used by 15 million patients in 120 countries in FY2020, under normal operating conditions (F&P Healthcare, 2019). However, given the current COVID-19 outbreak these figures could be higher. F&P Healthcare also remains a critical essential service throughout New Zealand’s lockdown. Trailblazing design F&P Healthcare has remained at the cutting edge of innovation since its inception. The Company has invested over $750 million in Research and Development (R&D) since 2001, with 581 staff dedicated to R&D in 2019. Its R&D has also been supported by government grants and support, including the R&D tax credit (New Zealand Government, n.d.). The Company also encourages innovation through new talent, offering internships and a 12-month graduate programme (F&P Healthcare, 2019). F&P Healthcare recognises the importance of diversity and inclusion in encouraging innovation. After an internal study found room for improvement in gender diversity, Human Resources (HR) policies were changed to address this. Subsequently, 86% of employees responded positively to the statement ‘I feel F&P Healthcare values diversity’ (Diversity Works, 2019). © 2020 Deloitte Touche Tohmatsu 37
Ranking, revenue and profit
F&P Healthcare has steadily increased its ranking in the Top 200 index

F&P Healthcare has climbed from 94th place in 2002, to 38th place in 2019 in                                     Figure 2 – F&P Healthcare’s ranking in the Top 200 index over time
Deloitte’s Top 200 index.
                                                                                                                                                                                    38                    2019
Revenue and profit after tax have trended upwards, with profit after tax increasing
much faster than the Top 200 average since 2011. Average revenue growth was 8%                                                                                                 42                         2018
per annum (pa) between 2001 and 2019, while average profit after tax growth was
                                                                                                                                                                          48                              2017
31% pa. This average is skewed upwards by a huge jump in profit between 2001 and
2002. Excluding 2001 the average profit after tax is around 8% pa. This compares to                                                                                       47                              2016
Top 200 average annual growth rates of 3% for revenue and 14% for profit after tax.                                                                              58                                       2015

Profit after tax dipped slightly during the Global Financial Crisis (GFC), but quickly                                                                          60                                        2014
recovered.                                                                                                                                            69                                                  2013
                                                                                                                                                      69                                                  2012
  Figure 1 – Profit after tax, F&P Healthcare relative to Top 200 firms, 2019
                                     dollars                                                                                                            67                                                2011
                                                                                                                                                           65                                             2010
                                Profit after tax - F&P Healthcare   Average profit after tax - Top 200
                                                                                                                                                      69                                                  2009
                          250
                                                                                                                                   92                                                                     2008
   Profit after tax, $m

                          200                                                                                                      93                                                                     2007
                                                                                                                             98                                                                           2006
                          150
                                                                                                                 111                                                                                      2005
                          100                                                                                          105                                                                                2004
                                                                                                                             97                                                                           2003
                           50
                                                                                                                                  94                                                                      2002
                            0                                                                              120               100               80                    60             40               20
                                                                                                                                                       Rank
                                                                                                         Source: Deloitte Top 200 index
Source: Deloitte Top 200 index                                                                           Note: While F&P Healthcare was included in the Top 200 index in 2001, no ranking data was available.
© 2020 Deloitte Touche Tohmatsu                                                                                                                                                                                  38
Assets and equity
F&P Healthcare’s asset and equity levels have increased steadily since 2001, and the
Company offers a solid return on investment
F&P Healthcare’s total assets and total equity have increased steadily since 2002. F&P Healthcare has delivered a solid return on investment between 2002 and 2019.
The sharp drop in total assets between 2001 and 2002 was driven by F&P Healthcare The sharp rise in return on investment from 2001 to 2002 is again driven by the
splitting from F&P Industries in 2001, and no longer including assets from change in ownership from F&P Industries to F&P Healthcare. However, we note that
discontinued operations on its 2002 balance sheet (F&P Healthcare, 2002). return on investment appears to be lowering, with ROE falling from 37% in 2002 to
23% in 2019, and ROA dropping from 37% in 2002 to 17% in 2019.
Average total assets across all Top 200 firms were higher than F&P Healthcare.
However, F&P Healthcare is converging towards the Top 200 average, with both the F&P Healthcare’s return on assets (ROA) and return on equity (ROE), has
Top 200 average and F&P Healthcare’s assets at $1.2 billion in 2019. Similarly, F&P consistently been above the Top 200 average. Between 2001 and 2019, the average
Healthcare’s total equity remained below the Top 200 average till 2016, but has Top 200 ROA was 3% pa, while the average ROE was 8% pa. F&P Healthcare’s ROA
recently climbed above the Top 200 average. averaged 18% pa across the same period, while ROE was higher at 25% pa.
Figure 4 – Return on investment, F&P Healthcare relative to Top 200 firms,
Figure 3 – Asset and equity base, 2019 dollars
2019 dollars
Total assets - F&P Healthcare Total equity - F&P Healthcare ROA - F&P Healthcare ROE - F&P Healthcare
1600 Average ROA - Top 200 Average ROE - Top 200
1400 40%
Return on investment, %
35%
1200
30%
1000
25%
$m
800
20%
600
15%
400 10%
200 5%
0 0%
Source: Deloitte Top 200 index Source: Deloitte Top 200 index
© 2020 Deloitte Touche Tohmatsu 39Lessons
Learned
© 2020 Deloitte Touche Tohmatsu 40International reach, but strong Kiwi roots F&P Healthcare derives 99% of its revenue overseas, but continues to undertake R&D and manufacturing in New Zealand Globally connected F&P Healthcare is almost exclusively internationally focussed, with 99% of revenue generated offshore (F&P Healthcare, 2020). Its products cater towards the rapidly ageing populations in many countries, and more recently have been critical to the COVID-19 response. The Company contributes to New Zealand’s export diversification. To support global sales, F&P Healthcare has a wide-reaching distribution network, with distribution centres in countries such as the US, China, and Australia. Direct sales occur in multiple cities, supplemented by distributed sales with F&P Healthcare people (F&P Healthcare, 2019). The Company has continued to invest time and effort into this network, rather than simply establishing it and thinking the job is done. But New Zealand based Despite F&P Healthcare’s strong international focus, it undertakes most R&D in New Zealand, and 66% of manufacturing in its Auckland factory. Being based in New Zealand allows F&P Healthcare to benefit from a world-class healthcare system, supportive regulatory environment, an efficient and effective clinical trials process, and tight links between industry, universities, and hospitals (Technology Investment Network, 2019). Accordingly, 53.1% of employees are based in New Zealand, 32.8% in North America and 14.0% in the rest of the world (F&P Healthcare, 2019). F&P Healthcare also collaborates with the local communities and organisations which support them. For example, the Company has provided Counties Manukau District Health Board with $1.5 million over the next 10 years to support clinical research at Middlemore Hospital (Counties Manukau Health, 2020). © 2020 Deloitte Touche Tohmatsu 41
Appendix

           42
List of Top 200 and Top 10 Māori Businesses
Top 200 firms CPB Contractors Infratil Nestle Singapore Airlines Watercare
Dairy Goat Co-op Inghams Nissan Skellerup WEL Networks
A2 Milk Danone Ingram Micro Nobilo Sky TV Wesfarmers Industrial
Abano Healthcare Datacom Ixom Operations Northpower Skycity Westcon
Air NZ DB Breweries JB Hi-Fi NZ Post Skyline Enterprises Westland Dairy
Airways Delegat Group John Deere NZ Racing Board Spark Weyville Holdings
Alliance Group DHL Juken NZ Sugar Spotless Wilmar Gavilon
Allied Foods Downer Group Kaingaroa Timberlands NZME Steel & Tube Woolworths
ANZCO Foods EBOS Group Kathmandu NZPM Group Stuff WSP Opus
APHG NZ Investments Electrix Kerbside Papers Oceana Gold Sumitomo Chemical Xero
Apple Emirates Airlines Kia Motors Oceania Dairy Sumitomo Forestry Z Energy
Asahi EnviroWaste Kiwi Property OfficeMax Summit Forests Zespri
Asaleo Care ExxonMobil Kiwirail O-I Operations Synlait Milk
AsureQuality F&P Healthcare Kmart Oji Fibre Solutions T&G Global Top 10 Māori
Auckland Airport Farmlands Kura OMV Tasman Steel Businesses
AWF Madison Fletcher Building Landcorp Open Country Dairy Tatua Co-op Dairy
Ballance Agri-Nutrients Fonterra LIC Oregon Group Taumata Plantations Moana NZ
Beca Foodstuffs NI Linde Holdings Orion Tegel Ngāi Tahu
Bidfood Foodstuffs SI Lion Orora Tetra Pak Ngāti Porou
BP Ford Lotto NZ Pacific Aluminium TIL Logistics Ngāti Whātua ki Orākei
Bridgestone Freightways LWC Pact Group Toll Parininihi ki Waitotara
Briscoe Group Freshmax Mainfreight Pan Pac Forest Tourism Holdings Pukeroa Oruawhata
British American Tobacco Frucor Beverages Market Gardeners PGG Wrightson Toyota Te Wānanga o Aotearoa
Broadspectrum Fulton Hogan Mars NZ Philip Morris TR Group Toa Rangatira
Bunnings Genesis Energy Martin-Brower Holdings Port of Tauranga Trade Me Tuhoe Te Uru Taumatua
Bupa Glencore Agriculture Matariki Forestry Ports of Auckland Transpower Waikato Tainui
C B Norwood Goodman Fielder Mazda Powerco Trustpower
CablePrice GPC Asia Pacific McDonald's Ravensdown Turners Automotive
Caltex Green Cross Health Mediaworks Refining NZ TVNZ
CDC Pharma Haier Mercedes-Benz Restaurant Brands Two Degrees
CDL Hotels Hallenstein Glasson Mercury Ryman Healthcare Unilever
China Forestry Harvey Norman Meridian Energy Samsung Unison Networks
Chorus HEB Construction Methanex Sanford URC Holdings
City Care Heinz Metro Performance Glass Scales Corp Vector
Coca-Cola Holden Millstream Equities Scentre Vocus
Colonial Motor Honda Mitsubishi Motors Shell Vodafone
Compass Group IBM Mondelez Silver Fern Farms Warehouse Group
Contact Energy Imperial Tobacco Nelson Forests Sime Darby Motor Waste Management
© 2020 Deloitte Touche Tohmatsu 43References
44References
ASX. (2019). Our man on the ground in Auckland. Retrieved from https://www.asx.com.au/documents/resources/listed-at-asx-winter-18-at-the-close.pdf
Champion Freight. (2018). New Zealand’s Largest Ports. Retrieved from: https://www.championfreight.co.nz/largest-nz-ports
Conway, P. (2018). Can the Kiwi Fly? Achieving Productivity Lift-off in New Zealand. International Productivity Monitor, 34(2), 40-63.
Counties Manukau Health. (2019). Fisher and Paykel Healthcare announce clinical research partnership with CM Health. Retrieved from: https://countiesmanukau.health.nz/news/fisher-and-
paykel-healthcare-announce-clinical-research-partnership-with-cm-health/
Deloitte. (2019). Top 200 Index.
Deloitte. (2019). Top 10 Māori Business Index.
Diversity Works. (2019). Empowerment – Fisher & Paykel Healthcare. Retrieved from: https://diversityworksnz.org.nz/case-studies/2019-diversity-awards-nz/empowerment-fisher-paykel-
healthcare/
F&P Healthcare. (2002). FPH Annual Report 2002. Retrieved from: https://resources.fphcare.com/resources/corporate/media/resources/documents/investor/annual-reports/2002-fph-annual-
report.pdf
F&P Healthcare. (2019). FPH Annual Report 2019. Retrieved from: https://resources.fphcare.com/resources/corporate/media/resources/documents/investor/annual-reports/2019-fph-annual-
report.pdf
MBIE. (2018). Getting under the hood – Insights from Recent Firm-level Productivity Research in New Zealand. Retrieved from: https://www.mbie.govt.nz/dmsdocument/2981-getting-under-
the-hood-insights-from-recent-firm-level-productivity-research-in-new-zealand
New Zealand Government. (n.d.). Finding the future with R&D. Retrieved from: https://www.rdti.govt.nz/r-and-d-stories/f-and-p-healthcare.html
New Zealand Productivity Commission. (2019). Productivity by the numbers: 2019. Retrieved from: https://www.productivity.govt.nz/assets/Documents/productivity-by-the-numbers-
2019/42ead8d24d/Productivity-by-the-Numbers-2019.pdf
Statistics New Zealand. (2019). Annual enterprise survey: 2018 financial year (provisional). Retrieved from: https://www.stats.govt.nz/information-releases/annual-enterprise-survey-2018-
financial-year-provisional
TDB Advisory. (2020). Iwi Investment Report 2019. Retrieved from: https://www.tdb.co.nz/wp-content/uploads/2020/03/TDB-Investment-Report-2019.pdf
Technology Investment Network. (2019). Billion Dollar Businesses: F&P Healthcare. Retrieved from: https://tin100.com/billion-dollar-businesses-fp-healthcare/
Te Puni Kōkiri. (n.d.). Find Iwi by Map. Retrieved from: http://www.tkm.govt.nz/map/
© 2020 Deloitte Touche Tohmatsu 45You can also read