H.C. Wainwright Annual Global Investment Conference - (Nasdaq: OCDX) - Ortho ...
←
→
Page content transcription
If your browser does not render page correctly, please read the page content below

H.C. Wainwright
                 Annual Global
                 Investment Conference

(Nasdaq: OCDX)
© Ortho Clinical Diagnostics 2021

Forward-Looking Statements

This presentation and the oral remarks may contain “forward-looking statements” within the meaning of Section 27A of the Securities Act of 1933, as amended, and Section 21E of the Securities Exchange Act of 1934, as amended. Such
forward-looking statements reflect, among other things, our current expectations and anticipated results of operations, all of which are subject to known and unknown risks, uncertainties and other factors that may cause our actual results,
performance or achievements, market trends, or industry results to differ materially from those expressed or implied by such forward-looking statements. Therefore, any statements contained herein that are not statements of historical fact
may be forward-looking statements and should be evaluated as such. Without limiting the foregoing, the words as “anticipate,” “expect,” “suggest,” “plan,” “believe,” “intend,” “project,” “forecast,” “estimates,” “targets,” “projections,” “should,”
“could,” “would,” “may,” “might,” “will,” and the negative thereof and similar words and expressions are intended to identify forward-looking statements. Factors that might materially affect such forward looking statements and projections
include: the ongoing global coronavirus (COVID-19) pandemic; increased competition; manufacturing problems or delays or failure to develop and market new or enhanced products or services; adverse developments in global market,
economic and political conditions; our ability to obtain additional capital on commercially reasonable terms may be limited or non-existent; our inability to implement our strategies for improving growth or to realize the anticipated benefits of
any acquisitions and divestitures, including as a result of difficulties integrating acquired businesses with, or disposing of divested businesses from, our current operations; a need to recognize impairment charges related to goodwill,
identified intangible assets and fixed assets; our inability to achieve some or all of the operational cost improvements and other benefits that we expect to realize; our ability to operate according to our business strategy should our
collaboration partners fail to fulfill their obligations; risk that the insurance we maintain may not fully cover all potential exposures; product recalls or negative publicity may harm our reputation or market acceptance of our products;
decreases in the number of surgical procedures performed, and the resulting decrease in blood demand; fluctuations in our cash flows as a result of our reagent rental model; terrorist acts, conflicts, wars and natural disasters that may
materially adversely affect our business, financial condition and results of operations; the outcome of legal proceedings instituted against us and/or others; risks associated with our non-U.S. operations, including currency translation risks,
the impact of possible new tariffs and compliance with applicable trade embargoes; the effect of the United Kingdom’s withdrawal from the European Union; our inability to deliver products and services that meet customers’ needs and
expectations; failure to maintain a high level of confidence in our products; significant changes in the healthcare industry and related industries that we serve, in an effort to reduce costs; reductions in government funding and reimbursement
to our customers; price increases or interruptions in the supply of raw materials, components for our products, and products and services provided to us by certain key suppliers and manufacturers; our ability to recruit and retain the
experienced and skilled personnel we need to compete; work stoppages, union negotiations, labor disputes and other matters associated with our labor force; consolidation of our customer base and the formation of group purchasing
organizations; unexpected payments to any pension plans applicable to our employees; our inability to obtain required clearances or approvals for our products; failure to comply with applicable regulations, which may result in significant
costs or the suspension or withdrawal of previously obtained clearances or approvals; the inability of government agencies to hire, retain or deploy personnel or otherwise prevent new or modified products from being developed, cleared or
approved or commercialized in a timely manner; disruptions resulting from President Biden’s invocation of the Defense Production Act; results of clinical studies, which may be delayed or fail to demonstrate the safety and effectiveness of
our products; costs to comply with environmental and health and safety requirements, or costs related to liability for contamination or other potential environmental harm; healthcare fraud and abuse regulations that could result in liability,
require us to change our business practices and restrict our operations in the future; failure to comply with the anti-corruption laws of the United States and various international jurisdictions; failure to comply with anti-terrorism laws and
regulations and applicable trade embargoes; failure to comply with the requirements of federal and state laws pertaining to the privacy and security of health information; our inability to maintain our data management and information
technology systems; data corruption, cyber-based attacks, security breaches and privacy violations; our inability to protect and enforce our intellectual property rights or defend against intellectual property infringement suits against us by
third parties; risks related to changes in income tax laws and regulations; risks related to our substantial indebtedness; our ability to generate cash flow to service our substantial debt obligations; risks related to the ownership of our ordinary
shares, including the fact that we are a “controlled company” within the meaning of the corporate governance standards of Nasdaq; and other factors beyond our control. Unless legally required, we assume no obligation to update any such
forward-looking information to reflect actual results or changes in the factors affecting such forward-looking information. Actual results could differ materially from those described in any forward-looking statements contained herein or the
oral remarks made in connection herewith as a result of a variety of factors, including known and unknown risks and uncertainties, many of which are beyond our control including, but not limited to, the risks and uncertainties described in
the registration statement on Form S-1 filed with the SEC by Ortho Clinical Diagnostics Holdings plc.

Information contained in this presentation concerning our industry and the markets in which we operate, including our general expectations and market position, market opportunity and market size, is based on information from various
sources, on assumptions that we have made that are based on such information and other similar sources and on our knowledge of, and expectations about, the markets for our service offerings. This information involves a number of
assumptions and limitations and you are cautioned not to give undue weight to such estimates.

                                                                                                                                                                                                                                                           2
© Ortho Clinical Diagnostics 2021

Non-GAAP Financial Measures

This presentation contains financial measures, such as constant-currency growth rate, adjusted EBITDA, adjusted net income, adjusted diluted EPS and adjusted free cash flow, which are considered non-GAAP financial measures under
applicable U.S. Securities and Exchange Commission rules and regulations. These non-GAAP financial measures should be considered supplemental to, and not a substitute for, financial information prepared in accordance with U.S.
generally accepted accounting principles (GAAP). Adjusted EBITDA, adjusted net income, adjusted diluted EPS and adjusted free cash flow eliminate impacts of certain non-cash, unusual or other items that that we do not consider
indicative of our ongoing operating performance. Our definitions of these non-GAAP measures may differ from similarly titled measures used by others. We generally use these non-GAAP financial measures to facilitate management’s
financial and operational decision-making, including evaluation of our historical operating results, comparison to competitors’ operating results and determination of management incentive compensation. These non-GAAP financial
measures reflect an additional way of viewing aspects of our operations that, when viewed with GAAP results and the reconciliations to corresponding GAAP financial measures, may provide a more complete understanding of factors and
trends affecting our business. Because non-GAAP financial measures exclude the effect of items that will increase or decrease our reported results of operations, management strongly encourages investors to review our consolidated
financial statements and publicly filed reports in their entirety. Reconciliations of the non-GAAP financial measures to the most directly comparable GAAP financial measures are included in the tables in this presentation. For example, such
reconciling items include the impact of unrealized foreign currency exchange gains or losses, gains or losses that are unusual or nonrecurring in nature, as well as discrete taxable events. We cannot estimate or project these items and they
may have a substantial and unpredictable impact on our results presented in accordance with GAAP.

                                                                                                                                                                                                                                                   3
© Ortho Clinical Diagnostics 2021

    Deeply Experienced Leadership Team
    Including today’s presenters

Chris Smith                                                                  Joe Busky                               Michael Iskra
Chief Executive Officer                                                      Chief Financial Officer                 Head of Commercial Excellence
                                                                                                                     & Strategy

30+ years healthcare experience                                              30+ years public and private-equity     30+ years sales, marketing and
                                                                             company experience                      operations - diagnostics and healthcare
Formerly CEO Cochlear, Ltd. and Global                                                                               experience
Group President Gyrus Group PLC                                              Formerly CFO Vyaire Medical, Inc.
                                                                                                                     Formerly President Ortho North America
Previous senior leadership roles: KCI,                                       Finance leadership across global
Prism, and Cardinal Health                                                   diagnostics – Dade Behring, Siemens –   Previous senior leadership roles at
                                                                             as well as medtech, telecom and         Healthways and Bayer, Siemens
Multiple board and private equity advisory                                   marketing services                      Diagnostics
roles
                                                                                                                                                               4
OUR MISSION
We improve and save lives
with diagnostics.
We enable our customers to
optimize the long-term value for
patients through our innovative
IVD solutions and services.
© Ortho Clinical Diagnostics 2021

Our History and Future Focus

   75                                                              6                        75
     FIRST                                                         PAST                        NEXT

                 1939 – 2014                                                2014 – 2020                   2021 and Beyond

    YEARS                                                          YEARS                      YEARS

▪ Formed in 1939 within                                  ▪ The Carlyle Group sponsored    ▪ Went public on The Nasdaq
 Johnson & Johnson                                           the carve-out from Johnson    Stock Exchange in January
▪ Pioneered blood typing                                     & Johnson, June 2014          2021
 and testing                                             ▪ Recognized worldwide for       ▪ Enhance Lifetime Customer
▪ Acquired Kodak patented                                    trusted brand and service     Value
 dry slide technology                                    ▪ Invested >$500M in R&D         ▪ Reinforce Service leadership
▪ Leader in infectious disease                               over period                  ▪ Increase investment in
 testing including the first                             ▪ Launched novel instruments      product innovation, menu
 antibody tests for Hepatitis C                              and assays                    acceleration and commercial
 and HIV                                                                                   excellence

                                                                                                                            6
© Ortho Clinical Diagnostics 2021

                                        Investment Thesis

                                                Pure play IVD company in
                                    1           highly attractive, growing market

                                                  Clear differentiation that creates lifetime
                                        2         customer value and recurring revenue base

                                                     Strong momentum with renewed
                                            3        focus on profitable growth

                                                                                                7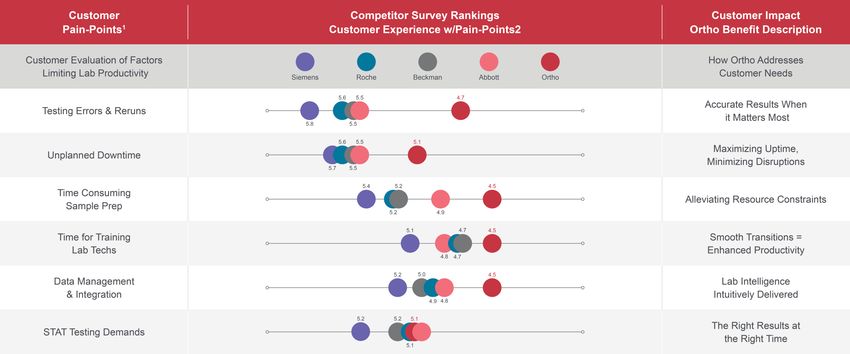
© Ortho Clinical Diagnostics 2021

Highly Differentiated in Two Key Markets
A pioneer of life-impacting diagnostic advances and a trusted brand
         Ortho plays in large markets with a TAM of ~$27bn, expected to grow at a 5-year CAGR of 5% from 2020 to 2025

Clinical Laboratories - $25bn TAM                                   Transfusion Medicine - $2bn TAM
Pioneer of infectious disease immunoassays and                      Global leader in hospital blood typing and screening and
dry-slide technology on our VITROS® analyzers                       significant new opportunities in blood donation testing
▪ Innovative dual slides                                            ▪ #1 in immunohematology globally
▪ A market leader in acute care and “STAT” labs with                ▪ Pioneered blood typing and infectious disease screening
  infectious disease immunoassays
                                                                    ▪ Cadence of ORTHO VISION® Swift platforms driving
                                                                      improved customer workflow and automation

                                                                                                                                8
© Ortho Clinical Diagnostics 2021

Ortho has Well-Diversified and Highly Recurring Revenue
Balanced global footprint in Clinical Labs and Transfusion Medicine

                Revenue by Business                                 Core Revenue by Region

        Transfusion                                             ASPAC 6%                        North
                                         Clinical Labs                                         America
         Medicine
                                              65%                                               53%
           33%
                                                               LATAM 7%

                                                                Japan 7%
          Non-Core
            2%
                                                                   China 13%
                                                                                    EMEA 14%

                  Core Revenue Mix                                         Core Revenue
                                                                   Developed vs. Emerging Markets

                                          Recurring             Emerging                       Developed
                                            93%                   30%                            70%

             Other
              7%

                                                                                                           9
© Ortho Clinical Diagnostics 2021

Three Strategic Priorities Driving Profitable Growth
Strong year-to-date momentum in the base business, bolstered by innovative
growth opportunities and operational efficiencies

         Product                                                               Global Commercial                             Operational
         Innovation                                                            Excellence                                    Efficiency
▪ Launched first quantitative COVID-19                            ▪ Expansion of Commercial Excellence            ▪ Reduced net leverage to 4.0x, ahead
  IgG spike antibody test and                                          program into emerging markets                of forecast
  nucleocapsid antibody test to help                                   accelerating growth                        ▪ Generated $131 million in FCF in 1H21,
  differentiate the cause of antibody                                                                               including the $75 million securitization of
  response                                                        ▪ Ranked #1 in 2021 ServiceTrak clinical
                                                                       laboratory survey for integrated systems     U.S. Accounts Receivables (AR)
▪ Launched Ortho OPTIX® Reader,                                                                                   ▪ Improved days sales outstanding (DSO)
  completed Transfusion Medicine portfolio                        ▪ 15% integrated system and 21%
                                                                       automated system installed base growth       by 22 days to 42 days (vs. 2Q 2020), an 8-
▪ Named Finalist in Fast Company's 2021                                year-over-year                               day improvement without AR
  World Changing Ideas Awards                                                                                       securitization
                                                                                                                  ▪ Assumed operation of third-party logistics
                                                                                                                    warehouse in Q2 to improve customer
                                                                                                                    experience

                                                                                                                                                                  10
© Ortho Clinical Diagnostics 2021
Focus on Increasing Lifetime Customer Value
Clinical Labs example: Razor-Razor Blade economics based on Closed Systems
+300%
3%-7% Annual Revenue
1
Avg. Annual Recurring Revenue
Growth
Recurring Revenue
+65%
Automation
Annual Revenue Menu Expansion & (1% of installed base)
Utilization
Integrated Placement
(24% of installed base)
Standalone Placement
(75% of installed base)
Customer Tenure 13 Years (average) +15 Years
1. 300% increase represents cumulative change in annual recurring revenue from the median customer running an integrated instrument to the same customer running an automated solution 11© Ortho Clinical Diagnostics 2021
Extensive and Balanced Global Footprint
~2,100 direct global teammates focused on commercial sales and service
EMEA
Canada 362
50
Prague, Czech Republic
Pencoed, Wales Japan
Waltham, MA Strasbourg, France
188
Rochester, NY
US
690 Raritan, NJ Tokyo, Japan
Pompano, FL Shanghai, China
Mexico City, Mexico
Mumbai,
China
India 312
Singapore
Commercial Headcount
ASPAC
Direct Sales LATAM 246
244 Sao Paulo, Brazil
Indirect Sales
Key Operations
15© Ortho Clinical Diagnostics 2021
Strong Growth in Core Business Continues into FY21
Core Revenue % Growth (Excl. local HCV)1
25%
21% Core Excl. HCV %
7% CoV-2
30%
10%
6% 5% 4%
4% 4% 6% 14% Core Excluding
1% 1% 6% 5% Local HCV/CoV-2
4%
(5%)
(3%)
(18%)
(12%)
2017 2018 1Q19 2Q19 3Q19 4Q19 1Q20 2Q20 3Q20 4Q20 1Q21 2Q21
Installed Base Growth
16% 15% 15%
15% 15%
14% 14%
13% 13%
11% 11%
9%
Integrated
Installed Base2
5% 6% 6% 5%
4% 4% 4% 4% 4% Total
2% 2% 3% Installed Base
2017 2018 1Q19 2Q19 3Q19 4Q19 1Q20 2Q20 3Q20 4Q20 1Q21 2Q21
Note: core revenue growth rates shown in constant currency.
1. Reference non-GAAP reconciliation slide for details 13
2. Integrated installed base includes VITROS 5600 and XT7600 Clinical Labs InstrumentsClinical Laboratories
© Ortho Clinical Diagnostics 2021

         Clinical Labs Sweet Spot in Mid to Very High-Volume Labs
         Projected to grow at 5% CAGR1
                                                                                                                                                    Projected
                                                                                                                                                  5-Year CAGR
                                                                                                                                                  (2020 – 2025)

                                                                                                                          2025E                       5%
                            Clinical Labs Market
                          Instrument Throughput
                                                                                                                           16%                        14%
                                                                                      2020E

                                  Ultra High                                             12%

                                   Ortho’s                                                                                            >70%            5%
                                                                                                                                                         1
                                                                                                                          73%
                                   Sweet                                                                                          of the market
                                                                                         76%
                                    Spot

                                       Low                                               12%                              11%                         1%
Source: IQVIA Medtech and management estimates.
Note: Market distribution and CAGRs shown by platform throughput exclude Homogenous immunoassay (HIA) and open reagents                                           15
1. Represents weighted-average growth across Mid, High and addressable portion of Very High-volume segments.
© Ortho Clinical Diagnostics 2021
Clinical Labs Covers Range of Customers and Disease States
Including COVID-19 Antigen and Four COVID-19 Antibody Tests
Automation
Menu supports ~90% of typical lab menu needs
VITROS® Automation
Solutions and Middleware
(informatics) Infectious Bone General
Cardiac Disease Diabetes Disease Thyroid Chemistry
E-Connectivity® Technology
LIFETIME CUSTOMER VALUE
Integrated
Therapeutic Nutritional
XT MicroSlides
Renal Drug Monitoring Oncology Assessment Prenatal Hepatic
VITROS® 5600 VITROS® XT 7600
Integrated System Integrated System MicroWells
Standalone Drugs of Abuse
Inflammatory Anemia Respiratory Spinal (Urine) Lipids
VITROS® 350 VITROS® 4600 VITROS® XT 3400
Chemistry System Chemistry System Chemistry System
Reproductive Immunosuppressant
Pancreatic Toxicology Endocrinology Urine Drugs Sepsis
VITROS® ECiQ VITROS® 3600
Immunodiagnostic System Immunodiagnostic System
Focus on strengthening infectious disease and
Ortho services mid to very high-volume labs with projected
acute care differentiation;
’20-’25 CAGR of 5%
Launched new customer controls and 5 new assays YTD
16© Ortho Clinical Diagnostics 2021
Clinical Labs Opportunities for Immunoassay Growth Through
Integrated System Upgrades and Placements
Integrated Instruments Percentage of
Clinical Lab Installed Base
2020 Ortho CL Revenue1 2020 Market Data2 EMEA China
Americas 14% 31%
33%
ASPAC/Japan
Immunoassay Clinical 16%
38% Chemistry
32%
Clinical
Chemistry Immunoassay
62% 68%
Integrated Penetration
of Clinical Lab Installed Base
Strength in Clinical Opportunity in larger, faster
Chemistry underpinned by growing Immunoassay
benefits in dry technology market with growth in 24% 25%
integrated installed base 16% 19%
6% 11% 12%
2008 2010 2012 2014 2016 2018 2020 1H21
1. 2020 Ortho revenue excluding COVID-19 assays
17
2. Sourced from 2021 IQVIA Market Book to exclude COVID-19 assay revenue© Ortho Clinical Diagnostics 2021
Ortho is Focused on Top Customer
Pain Points and Offers More
Differentiated Solution
Ortho Wins on… Ortho consistently delivers results with highest 1st pass yield
1. Test Performance
84% 96%
Reliable, accurate, environmentally-
friendly VITROS® Dry Slide Technology
2. System Reliability
Non VITROS® Systems VITROS® Systems
Designed to deliver high reliability
with a 98% uptime guarantee for
US customers
Fastest turnaround time for panel of common assays1
3. Broad Menu Offering
covering 90% of most lab needs across
Acute Care and Infectious Disease
SIEMENS ABBOTT BECKMAN ROCHE ORTHO
®
ATELLICA ARCHITECT AU/DXi 6000 VITROS XT7600
1. TAT to complete the panel of these tests: Glucose, Calcium, Albumin, Total Protein, Sodium,
Potassium, CO2, Chloride, BUN, Creatinine, ALP, ALT, AST, Bilirubin.
18© Ortho Clinical Diagnostics 2021
How Ortho Differentiates In the Market
Ortho Delivers Solutions That Address Customers’ Most Pressing Pain-Points
2
5.0
1. IQVIA, Clinical Labs Voice of Customer Study (Jan. 2020)(Double-blinded, worldwide survey of 232 laboratory professionals and economic stakeholders).
2. Defined as average ‘scale of pain’ experienced by customers of vendor for each pain-point in IQVIA, Clinical Labs Voice of Customer Study (Jan. 2020)(Note: initial ‘scale of pain’ score from 1-10 represented here as 4-6 to facilitate 19
visualization).Transfusion Medicine
© Ortho Clinical Diagnostics 2021
Transfusion Medicine Ensures Safe & Compatible Blood
Products are Delivered from Donor to Patient – Vein to Vein
CROSS
TRANSFUSION
MATCH
+
QC Controls
Blood Grouping
Antibody Screen QC Controls
ID Serology Blood Grouping
Anitgen Testing Anitbody Screen
Anitbody Identification
Specialty Patients
DONOR PATIENT
Donor Screening Immunohematology
Donation Centers 85%© Ortho Clinical Diagnostics 2021
Moving Customers From Manual Testing By Providing a
More Efficient Option with Automation
Customer Size Lifetime Customer Value Ortho Immunohematology
Manual Semi-Automated Automated
Launched 2021 +90%
Immunohematology
Test Utilization + Upgrades
Automated
Manual Blood ORTHO® ORTHO ORTHO ORTHO VISION® +600%
Bank WorkStation Optix ® VISION® MAX Swift
Reagents Swift
Semi-Automated
Donor Screening
Manual
Contract Duration
ORTHO VITROS® ORTHO Verseia
3600 Integrated
Pipettor®
WORKFLOW EFFICIENCY IMPROVEMENT
Ex-US Markets
US Market MANUAL SEMI-AUTO MA TE D AUTOMA TED
-- 70% 90%
Legacy Ortho AutoVue® and Ortho ProVue® instruments gradually being replaced by ORTHO VISION® family of instruments 22Commercial Excellence
© Ortho Clinical Diagnostics 2021
Customer Excellence Enables Retention, Promotes Growth
Service is critically important and highly valued by our customers
ServiceTrak™ Integrated System Comparison ORTHO CARE™ Key Drivers
People Reliability
2015 2016 2017 2018 2019 2020 2021
Ortho 4 1 1 1 1 1 1 100% >30%
Ortho teams trained in Decrease in service
Customer Excellence interventions*
Abbott 1 4 5 5 5 5 4
Closed Loop
Speed of Response
Beckman 2 5 3 4 2 1 3 Process Improvement
82%
Roche 5 2 2 3 3 3 2
Improvement 89%
in Global NPS Score Same Day Fix
(2015 – 2020)
Siemens 3 3 4 2 4 4 5
*Measured from Q2 2014 through Q2 2021
24© Ortho Clinical Diagnostics 2021
e3 U.S. Commercial Excellence Program
Focus, discipline, and specialization have led to improved commercial execution
Customer Touchpoints
+183%
2018 to 2020
+18%
1. Market Assessment: 1H 21 vs 1H 20
Where Ortho best competes
Q1 18 Q2 18 Q3 18 Q4 18 Q1 19 Q2 19 Q3 19 Q4 19 Q1 20 Q2 20 Q3 20 Q4 20 Q1 21 Q2 21
2. Commercial Org Assessment:
Our structure, capabilities and deployment today
26.0%
NA Recurring Core Revenue
3. Segment and capitalize target: 20.5%
Identify and classify every customer
14.5%
11.1%
4. Expand and Enable: 7.0%
Restructure resource, build support tools, improve process 2.6%
3.8% 3.5%
2.0%
(0.5%) (2.7%) (1.3%) 0.0%
5. Execute the Experience: 2016 2017 2018 Q1 19 Q2 19 Q3 19 Q4 19 Q1 20 Q2 20 Q3 20 Q4 20 Q1 21 Q2 21
Increase touchpoints, more proactive engagement
e3 Implementation COVID-19 Pandemic
25© Ortho Clinical Diagnostics 2021
Ortho China Is Key Driver and Platform for Emerging Market Expansion
STAT Lab Leadership Chang’E Commercial Excellence Program
Coverage Expansion
Enhanced Customer Retention
Service Excellence
Better Distributor Management
Expansion Opportunities Lifetime Customer Value
Market Expansion
Share Capture Routine Lab
• Menu expansion
New Hospital
• IA cross-sell in STAT Lab
STAT
• Low-volume CC for smaller hospitals CC
Leader-
• Expand Tier 2 distributors ship
Segments
Source: Ortho internal data, hospital interviews, Bain analysis
26© Ortho Clinical Diagnostics 2021
Extending e3 and Chang’E CEx Framework Globally
Market Specific & Focused &
Insight Driven Digitally Enabled
Globally Connected Disciplined
Phase 01 Phase 02 Phase 03
ASPAC, Japan, LATAM,
Distribution Markets
China, Western Europe
North America
Commercial Edge Commercial Evolution Commercial 360
▪ Define sweet spot through market and ▪ Increase sales efficiency through ▪ Enhance customer value by digitally
customer segmentation strategy optimization aligning and integrating customer
▪ Establish growth equation ▪ Introduce and align new customer touchpoints
▪ Focused commercial KPI’s that drive engagement channels (non sales) ▪ Optimize customer engagement
strategy effectiveness ▪ Identify additional growth opportunities channels to accelerate revenue
▪ Expanding customer facing resources ▪ Expand market reach
i.e. laboratory specialists 27Financial Results
© Ortho Clinical Diagnostics 2021
Core Revenue Core Revenue
Grew to Increased
$488M 22.5%1
2Q 21 In Review: Adjusted EBITDA2
Strong Momentum Operating Income
of $128.1M
Increased Represented an
▪ Core Revenue growth of 27.0%,
excluding COVID-19 headwind
104.7% Increase of
27.0%
▪ Americas up 21.3%, driven by
Commercial Excellence program net loss per diluted share was ($0.09),
adjusted earnings per share was $0.162
▪ Emerging markets up 47.8% as
strong rebound continues
1. Growth rate shown on a constant currency basis 29
2. Reference non-GAAP reconciliation slide for details© Ortho Clinical Diagnostics 2021
2Q21 Revenue Mix
Clinical Labs strength drives double-digit growth Transfusion
Medicine
33%
Clinical
Labs
66%
Clinical Labs
Non-Core
▪ Clinical labs growth ex-CoV-2 up 28% 1%
▪ CoV-2 revenue of $17 million
▪ Strong growth across all geographies driven
by recovery from initial pandemic impacts in
$ millions Jul 4, 2021 Jun 28, 2020 in constant
as reported
2020 currency (a)
Clinical Labs $325.1 $260.3 24.9% 21.1%
Transfusion Medicine
▪ Strong growth worldwide due to base business Transfusion Medicine $162.4 $125.9 29.1% 25.3%
strength, compared to pandemic impact in
Core Revenue $487.5 $386.2 26.2% 22.5%
2020
▪ CTS customer acquisition contributes to Other Product $1.3 $0.3 n.m. n.m.
revenue growth in Americas
Collaboration and Other $3.7 $4.0 (8.2%) (8.2%)
Non-Core
Non-Core Revenue $4.9 $4.3 14.0% 14.0%
▪ Contract manufacturing business and
contractual collaboration revenue steady Net Revenue $492.5 $390.5 26.1% 22.4%
Unless otherwise noted, dollars and growth rates are at actual foreign exchange rates
(a) The term “constant currency” means we have translated local currency revenues for all reporting periods into U.S. dollars using the same comparable foreign currency exchange rates. This additional non-GAAP financial information is
30
not meant to be considered in isolation from or as substitute for financial information prepared in accordance with GAAP. See reconciliation of non-GAAP measures included in Appendix.© Ortho Clinical Diagnostics 2021
2Q21 Segment Results Other
14%
Commercial Excellence programs continue to show strong returns China
12%
Americas
60%
EMEA
Commercial Excellence programs 14%
continue to show strong returns
▪ America’s performance driven by pronounced
growth in CL and TM, despite drop in CoV-2 $ millions Jul 4, 2021 Jun 28, 2020
in constant
revenues as reported
currency (a)
▪ EMEA delivered strong growth, led by Western
Europe Americas $296.3 $241.1 22.9% 21.3%
▪ China growth boosted by integrated instrument
installations and menu expansion EMEA $67.8 $51.0 33.0% 24.3%
▪ Growth in Other driven by key markets in
ASPAC
Greater China $58.5 $43.3 35.0% 23.2%
Other(b) $69.9 $55.2 26.7% 24.7%
Net Revenue $492.5 $390.5 26.1% 22.4%
Unless otherwise noted, dollars and growth rates are at actual foreign exchange rates
(a) The term “constant currency” means we have translated local currency revenues for all reporting periods into U.S. dollars using the same comparable foreign currency exchange rates. This additional non-GAAP financial information is
not meant to be considered in isolation from or as substitute for financial information prepared in accordance with GAAP. See reconciliation of non-GAAP measures included in Appendix.
31
(b) Other includes Japan and ASPAC regions© Ortho Clinical Diagnostics 2021
Balance Sheet, Cash Flow & Liquidity
Net IPO proceeds and improved annual Free Cash Flow
have positioned balance sheet to support growth
4.0x $200.9 Million
Net Debt to LTM
Cash at 7/4/21
EBITDA Ratio2
244 Million $144.1 Million
Diluted Weighted Average Shares 2Q 21 Adjusted
Outstanding2 Free Cash Flow1
$1.4 Billion $466.8 Million
Debt Reduction3 Borrowing Capacity
1. Reference non-GAAP reconciliation slide for details.
2. As of Q2 2021
3. Debt reduction is 2021 year-to-date 32© Ortho Clinical Diagnostics 2021
>$200M of Savings Generated by Culture
of Business Efficiency since 2016
Productivity and cost saving initiatives create value across all functions and regions
▪ Manufacturing driving majority
of savings through sourcing changes,
Value Capture Savings – Cumulative
$ in Millions relocations and strategic operating
investments
▪ G&A and other functions streamlined
to drive YoY savings
210
175 ▪ Strong investment and focus
131 on productivity initiatives
99
59
2016 2017 2018 2019 2020E
Annual
$32 $41 $31 $45 $35
Savings
33
2016 Cumulative savings includes 2H2014-FY2016© Ortho Clinical Diagnostics 2021
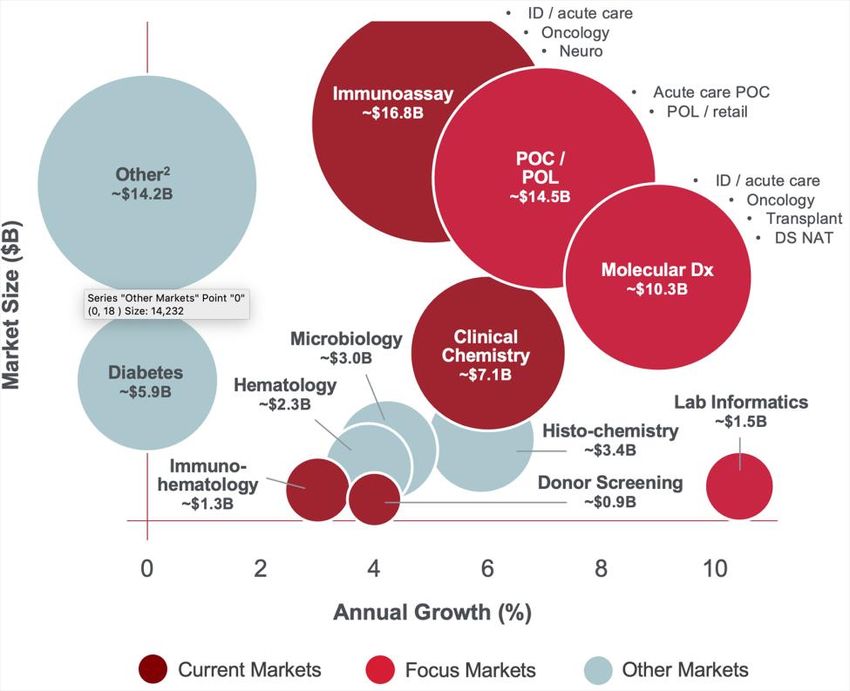
Focus on External Business Development Opportunities
MDx, POC/POL & Immunoassay Expansion Top Priorities
Opportunity Map: Centralized Lab & POC1 M&A/Partnership Opportunities to Strengthen TM Leadership
Source: SMG, IQVIA & Allied Market Research
Recent Accomplishments
▪ Continued strong commercial momentum with IDEXX partnership
▪ Signed assay development agreement with Chinese immunoassay
development & manufacturing partner
▪ Awarded a Biomedical Advanced Research and Development
Authority (BARDA) contract that will support more than a three-fold
1. Market sizes represent 2020 estimates per management-provided figures and industry research reports from IQVIA increase in domestic capabilities for COVID-19 serological and
and Allied Market Research
2. Includes coagulation, urinalysis, mass spectrometry, flow cytometry, NGS and cytology, among other products
diagnostic solutions.
34© Ortho Clinical Diagnostics 2021
Ortho’s Financial Objectives
Supported by a 93%1 recurring revenue base and ongoing topline and margin expansion
Core Gross G&A Investment for Long-Term
Revenue Margin Optimization Innovation and Annual
Growth Expansion Commercial EBITDA Growth
Excellence Potential
>5% 20-50 2-3% 5-7% 30-60bps
bps or ~7%
Annual Annual Annual
Annual
Growth Growth Growth 1.2 – 2X
Expansion
Operating
5-7% CL
2-4% TM Leverage
1. Trailing 12-months as of Q2 2021 35APPENDIX
HIGHLY CONFIDENTIAL © Ortho Clinical Diagnostics 2021

Adjusted EBITDA Reconciliation

                                                                                                                        Fiscal Quarter Ended

    (Dollars in millions)                                                                                         July 4, 2021               June 28, 2020
                                                                                                                              $                           $
    Net loss                                                                                                             (20.0)                      (41.3)
    Interest expense, net                                                                                                  33.0                       47.5
    Provision for income taxes                                                                                             15.1                        3.8
    Depreciation and amortization                                                                                          83.1                       79.9
    Stock-based compensation                                                                                               11.0                        2.2
    Restructuring and severance-related costs (a)                                                                           1.7                        2.2
    Tax indemnification income, net                                                                                        (0.2)                      (2.4)
    Loss on extinguishment of debt                                                                                               ̵̶̶                   2.6
    Unrealized foreign currency exchange losses, net (b)                                                                               ̵̶̶             3.0
    Other adjustments (c)                                                                                                   4.5                        3.4
                                                                                                                             $                          $
    Adjusted EBITDA                                                                                                      128.1                      100.9

Unless otherwise noted, dollars are at actual foreign exchange rates.
Amounts within tables may not add due to rounding.
                                                                                                                                                              38
HIGHLY CONFIDENTIAL © Ortho Clinical Diagnostics 2021
Adjusted Net Income and Adjusted Diluted EPS Reconciliation
Fiscal Quarter Ended
(Dollars in millions, except per share data) July 4, 2021 June 28, 2020
$ (2 $ (4
Net loss 0.0) 1.3)
33. 32.
Amortization of intangible assets 5 6
11. 2.
Stock-based compensation 0 2
1. 2.
Restructuring and severance-related costs (a) 7 2
̵̶̶ 2.
Loss on extinguishment of debt 6
̵̶̶ 3.
Unrealized foreign currency exchange losses, net (b) 0
4. 3.
Other adjustments (c) 5 4
50. 46.
Total adjustments 7 0
(1. (1.
Tax effect of reconciling items (d) 9) 7)
10. ̵̶̶
Discrete tax items (e) 3
$ 3 $
Adjusted net income 9.1 3.0
$ 0 $ 0
Adjusted
Unless otherwise basic
noted, dollars are atEPS
actual foreign exchange rates. .17 .02
Amounts within tables may not add due to rounding. $ 0 $ 0 39HIGHLY CONFIDENTIAL © Ortho Clinical Diagnostics 2021
Notes to Non-GAAP Reconciliations
(a) Represents restructuring and severance costs related to several discrete initiatives intended to strengthen operational performance
and to support building our commercial capabilities.
(b) For fiscal quarter ended June 28, 2020, this represents non-cash unrealized gains and losses resulting from the remeasurement of
transactions denominated in foreign currencies primarily related to intercompany loans. In fiscal 2021, we initiated programs to mitigate the
impact of foreign currencies related to intercompany loans in our results and, as a result, such non-cash net unrealized gains were
approximately $35.8 million for the fiscal quarter ended July 4, 2021. Given we expect these programs to continue to mitigate any impact in
future periods, we will not be adjusting our Adjusted EBITDA and Adjusted net income for non-cash unrealized gains and losses resulting from
the remeasurement of transactions denominated in foreign currencies in the second quarter of fiscal 2021.
(c) Represents miscellaneous other adjustments related to unusual items impacting our results including the elimination of management fees,
non-cash derivative mark-to-market (gain) loss and certain asset write-downs. See information below:
Fiscal Quarter Ended
(Dollars in millions) July 4, 2021 June 28, 2020
EU medical device regulation transition costs $ 0.9 $ 1.2
Principal shareholder management fee 0.8 0.7
Derivative mark-to-market loss (gain) 1.0 (1.2)
Other 1.8 2.7
Total other adjustments $ 4.5 $ 3.4
(d) Non-GAAP adjustments were tax effected based on the nature of the expense and related jurisdiction,
many of which are impacted by valuation allowances resulting in little to no tax impact.
(e) We exclude deferred tax resulting from changes in tax law and expiration of statutes, adjustments for
uncertain tax positions, and other unusual items not related to current operating results.
Unless otherwise noted, dollars are at actual foreign exchange rates.
Amounts within tables may not add due to rounding. 40HIGHLY CONFIDENTIAL © Ortho Clinical Diagnostics 2021
Adjusted Free Cash Flow
Fiscal Quarter Ended Fiscal Six Months Ended
(Dollars in millions) July 4, 2021 June 28, 2020 July 4, 2021 June 28, 2020
Net cash provided by (used in) operating activities – GAAP $ 132.7 $ (46.0) $ 122.8 $ (63.5)
Adjustments:
Net cash provided by (used in) investing activities - GAAP 6.4 (7.2) (4.3) (25.5)
Unusual or non-recurring payments 5.0 6.5 12.5 13.9
Adjusted free cash flow (f) $ 144.1 $ (46.7) $ 131.0 $ (75.1)
(f) We define free cash flow as net cash flows from operating activities accounted for under GAAP less net cash flows from investing activities
accounted for under GAAP plus or minus any unusual or non-recurring payments.
Unless otherwise noted, dollars are at actual foreign exchange rates.
Amounts within tables may not add due to rounding. 41HIGHLY CONFIDENTIAL © Ortho Clinical Diagnostics 2021
Reported and Constant Currency Revenue Reconciliation
July 4, June 28, Constant Currency
Fiscal Quarter Ended Constant Currency
2021 2020 Percent Change Currency Impact Growth Rate (a)
(Dollars in millions) July 4, 2021 June 28, 2020 Percent Change Currency Impact Growth Rate (a)
Core Revenue $487.5 $386.2 26.2% 3.7% 22.5%
Core Revenue $ 487.5 $ 386.2 26.2% 3.7% 22.5%
Non-Core Revenue 4.9 4.3 14.0% 0.0% 14.0%
Non-Core Revenue
Net Revenue 4.9
$492.5
4.3
$390.5 26.1%
14.0% 3.7%
0.0% 22.4% 14.0%
Net Revenue $ 492.5 $ 390.5 26.1% 3.7% 22.4%
Segment Net Revenue
Segment net revenue
Americas Americas $ 296.3
$296.3 $ 241.1
$241.1 22.9%22.9% 1.6% 1.6% 21.3% 21.3%
EMEA EMEA 67.8 67.8 51.0
51.0 33.0%33.0% 8.7% 8.7% 24.3% 24.3%
Greater China Greater China 58.5 58.5 43.3
43.3 35.0%35.0% 11.7% 11.7% 23.2% 23.2%
Other
Other 69.9 69.9 55.2
55.2 26.7%
26.7% 2.0%
2.0% 24.7% 24.7%
Net revenue $492.5 $390.5 26.1% 3.7% 22.4%
Net Revenue $ 492.5 $ 390.5 26.1% 3.7% 22.4%
Unless otherwise noted, dollars and growth rates are at actual foreign exchange rates.
Amounts within tables may not add due to rounding. Percentages have been calculated using actual, non-rounded figures.
(a) The term “constant currency” means we have translated local currency revenues for all reporting periods into U.S. dollars using the same comparable foreign currency exchange rates. This additional non-GAAP financial
information is not meant to be considered in isolation from or as substitute for financial information prepared in accordance with GAAP.
42HIGHLY CONFIDENTIAL © Ortho Clinical Diagnostics 2021
Supplemental Non-GAAP Financial Measures
Fiscal Year Ended Fiscal quarter ended
(% Growth) 2017 2018 Q1 19 Q2 19 Q3 19 Q4 19 Q1 20 Q2 20 Q3 20 Q4 20 Q1 21 Q2 21
Core Revenue
Growth 4.8% 0.3% (3.4%) 1.3% 4.6% 2.5% (0.6%) (12.6%) 1.6% 10.1% 23.5% 26.2%
Rate
Less: Foreign
(0.1%) 0.5% (2.9%) (2.3%) (0.9%) (0.4%) (1.3%) (2.0%) (0.4%) 1.0% 2.4% 3.7%
Currency Impact
Core Revenue
Constant
4.8% (0.2%) (0.5%) 3.7% 5.5% 2.9% 0.9% (10.8%) 2.1% 9.1% 21.1% 22.5%
Currency Growth
Rate
Less: Local HCV
and Other 3.5% (1.4%) 2.5% (0.1%) (0.3%) (1.5%) (4.0%) 1.5% (1.6%) (0.6%) 0.2% (2.5%)
Adjustments
Core Revenue
Constant
Currency Growth 1.4% 1.2% (3.0%) 3.8% 5.8% 4.3% 4.8% (12.2%) 3.7% 9.7% 20.9% 25.0%
Rate (excl. local
HCV)
Less: CoV-2 0% 0% 0.0% 0.0% 0.0% 0.0% 0.0% 6.4% 4.9% 5.8% 7.1% (4.9%)
Core Revenue
Constant
Currency Growth 1.4% 1.2% (3.0%) 3.8% 5.8% 4.3% 4.8% (18.4%) (1.3%) 3.9% 13.8% 29.9%
Rate (excl. local
HCV and CoV-2)
Percentages have been calculated using actual, non-rounded figures.
In Q1 2019 we signed a new supply agreement in Japan related to our HCV business. As a result of the new supply agreement, we recognized increased revenue in Q1 2019 and Q3 2019. Revenue recognition is based on
the timing of periodic shipments which may create unusual YoY variances in certain quarters. Other adjustments include Day 2 countries in 2016 and 2017.
43You can also read