REVENUE OUTLOOK - State of Oregon
←
→
Page content transcription
If your browser does not render page correctly, please read the page content below
REVENUE OUTLOOK
Revenue Summary
While the Covid-19 outbreak has injected a great deal of uncertainty into the outlook, the nature of our forecast
is unchanged. As always, the June 2020 economic and revenue forecast represents what the Office of Economic
Analysis and its advisors believe is the most probable outcome given available information. Although actual
economic growth and state revenues may depart significantly from these projections, we aim to build a forecast
that is just as likely to end up too high as it is too low.
Forecast errors on both the high and low side create problems for decision makers. In a recessionary
environment, a revenue forecast that is too low may lead to cuts in public programs that are unnecessarily deep.
This extra belt-tightening is relatively costly given that the least painful budget balancing options are usually
exhausted first.
If the revenue forecast proves to be too optimistic, the budget will need to be rebalanced when the truth
eventually comes out. Rebalancing becomes increasingly difficult as we approach the end of a budget period,
given that much of the allocated resources have already been spent. During the last three recessions and
recoveries, OEA’s forecasts have erred on the optimistic side, with the bad news being delivered over an
extended period of time as the severity of the downturns became clear. The nightmare scenario happened in
2002, when the Legislature met for five special sessions to balance the budget in light of worsening revenue
forecasts. Eventually, time ran out, and policymakers were forced to borrow their way out of the remaining
hole. We just finished paying off this debt at the end of 2013.
In one sense, the sudden stop of economic activity due to the outbreak of Covid-19 has made the revenue
outlook clearer. Economists have a particularly difficult time forecasting turning points in the business cycle.
During recent cycles, the consensus of forecasters has been consistently too optimistic as analysts have worked
through stages of grief. First, analysts argue that the economy is in a slowdown--not a recession. Then when
that is proven wrong, we have argued that the recession will be relatively mild. Even after the downturns have
proven to be deep, analysts have expected that a relatively healthy recovery will follow. By the time the
recovery stalls, decision makers have been subjected to months of bad news.
This time around, it became clear overnight that Oregon is in recession and that the downturn will be severe.
Although there is still a great deal of uncertainty surrounding the outlook, the forecast represents an attempt to
tear the proverbial Band-Aid off all at once by reflecting the full severity of the revenue downturn.
How severe will the revenue slowdown be? During most
business cycles, Oregon’s state revenues have proven to
be more volatile than those in the typical state. Not only
is Oregon’s underlying economy subject to boom-bust
swings, but the state also depends on a very volatile mix
of revenue instruments, led by personal and corporate
income taxes.
During the current recession, income taxes might not fare
so poorly in comparison to other revenue instruments.
Given the depth and breadth of the current economic

                                                        16
downturn, no state revenue system will be spared from pain going forward. The need for isolation has led to
spending declines that far outstrip what is usually seen during recessions, hitting sales tax states
disproportionately hard. States that depend on tourism and energy/mining revenues are also in for a tough year
or two.
Oregon will share some of the pain felt by sales tax states since our revenue system has become much more
dependent on consumer and business spending over time. Even before the corporate activity tax was enacted
in 2019, a wide range of sales-based taxes had been expanded in recent years. Taxes on lodging, gasoline,
vehicle purchases, video lottery and marijuana sales are all much more substantial than they were during the
last recession.
While some taxes will fare better than others, all major revenue sources will face considerable downward
pressure given the severity of the recession. The sudden stop in economic activity has led to the largest
downward revision to the quarterly forecast that our office has ever had to make. In the baseline (most likely)
scenario, General Fund and other major revenues have been reduced relative to the March forecast by $2.7
billion in the current biennium and $4.4 billion in the 2021-23 budget period.
Fortunately, Oregon is better positioned than ever before to weather a revenue downturn. Automatic deposits
into the Rainy Day Fund and Education Stability Fund have added up over the decade-long economic expansion,
and stood at $1.6 billion in April. In addition to dedicated reserve funds, the General Fund had over one billion
dollars in projected balances before the recession hit.
Longer term, revenue growth in Oregon and other states will face considerable downward pressure over the 10-
year extended forecast horizon. As the baby boom population cohort works less and spends less, traditional
state tax instruments such as personal income taxes and general sales taxes will become less effective, and
revenue growth will fail to match the pace seen in the past.
2019-21 General Fund Revenues
Gross General Fund revenues Table R.1
for the 2019-21 biennium are 2019-21 General Fund Forecast Summary
2019 COS March 2020 June 2020 Change from Change from
expected to reach $19,525 (Millions) Forecast Forecast Forecast Prior Forecast COS Forecast
million. This represents a Structural Revenues
Personal Income Tax $18,283.5 $18,472.6 $16,879.3 -$1,593.3 -$1,404.2
decrease of $1,933 million
Corporate Income Tax $1,190.8 $1,312.7 $1,081.8 -$230.9 -$109.0
from the March 2020 forecast,
All Other Revenues $1,546.1 $1,672.7 $1,564.2 -$108.5 $18.1
and a decrease of $1,495
Gross GF Revenues $21,020.4 $21,457.9 $19,525.3 -$1,932.7 -$1,495.1
million relative to the Close of
Offsets and Transfers -$203.5 -$254.3 -$251.9 $2.4 -$48.4
Session forecast. Should this 1
Administrative Actions -$21.5 -$21.5 -$21.5 $0.0 $0.0
outlook come to pass, Legislative Actions -$199.5 -$199.5 -$198.3 $1.1 $1.1
revenues for the current Net Available Resources $22,914.4 $23,562.1 $21,763.0 -$1,799.1 -$1,151.4
biennium would be 10.9% Confidence Intervals
67% Confidence +/- 4.9% $957.8 $18.57B to $20.48B
smaller than they were during
95% Confidence +/- 9.8% $1,915.6 $17.61B to $21.44B
the 2017-19 budget period. 1 Reflects cost of cashflow management actions, exclusive of internal borrowing.
17Personal Income Tax
In a normal year, changes to the June forecast for personal income taxes largely reflect collections from the April
filing season. This year, the economic outlook has changed and the tax filing season is incomplete. With the
personal tax filing deadline extended to July 15th, many payments have yet to come in.
Although incomplete, collections to date suggest that the filing
season will bring in somewhat more revenue than was
expected once it finally comes to an end. Most filers who are
due refunds have already been paid, with somewhat less being
issued overall than was expected in the March 2020 forecast.
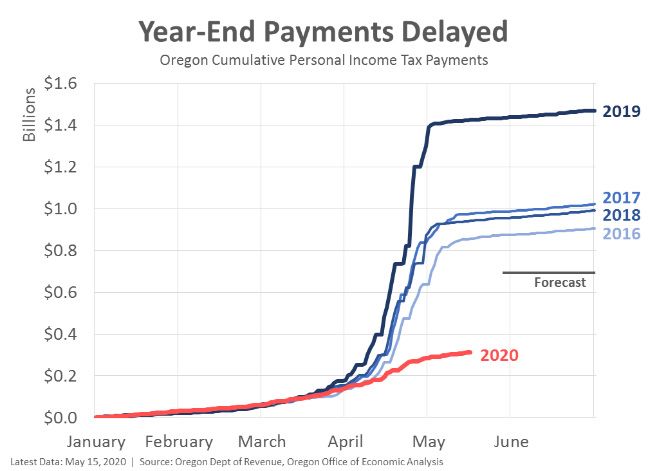
Unlike filers who are due refunds, many households who owe
year-end tax payments have chosen to wait. Normally, most
income tax payments are processed during the first three
weeks of April. This year, we are still waiting for more than
half of the expected payments. During the two months since
the filing deadline was extended, the Department of Revenue
has processed 350,000 fewer returns than over the same
period last year. When payments come in, they will likely be
larger than was expected in March. Even so, payments are
much smaller, and refunds much larger than they were last
year. This is the result of the record $1.7 billion kicker credit,
with $1 billion having already been issued as of publication.
While the April tax filing season brought in somewhat more
revenue than was expected, this good news was more than
offset by the worsening economic outlook. Withholdings of
personal income taxes (mostly out of paychecks) are already
dropping off rapidly, and are sure to weaken further in the months ahead.
It will take longer before we see the full impact of the recession on estimated and final personal income tax
payments. These non-withheld payments will reflect the state of business and investment income, which are
the source of much of the volatility in overall revenue streams. Currently, the baseline outlook calls for a rapid
recovery in profits and stock prices, in keeping with the national forecast provided by our primary vendor (IHS
Economics).
As an example, the current forecast for capital gains calls for
realizations to decline by more than one third over the next
two years. While this is a sharp contraction, it pales in
comparison to our experiences during the technology and
housing busts. The capital gain forecast is largely driven by
the outlook for stock prices, where the market correction is
expected to be less than half as deep, and last less than half
as long, as what was seen during the 2007 downturn. As
18such, further declines in profits and investment income represent a primary downside risk to the revenue
outlook.
Corporate Excise Tax
Corporate excise tax collections equaled $113 million for the third quarter of fiscal year 2020, $17 million (18%)
above the March forecast. Compared to the year-ago level, net corporate excise tax collections rose by 14%
while the forecast called for a decline of 4%. While corporate tax collections held up well throughout the third
quarter, these gains were more than erased by weak April collections. With quarterly estimated payments due,
collections in April are larger than collections over the entire January-to-March quarter.
Corporate tax collections are subject to wild swings with revenues being roughly cut in half during the past two
recessions. Corporate excise taxes are expected to lose half their value again this time, but to return to trend
relatively quickly.
Even should collections be cut in half, they would still be healthy from an historical perspective. At half their
current level, collections would still match the peak levels of the technology and housing booms.
Both state and federal tax law changes have injected a good deal of uncertainty into the outlook for corporate
tax payments. Notably, it is likely that the corporate tax base has become larger in Oregon as a result of federal
tax reforms contained in the Tax Cuts and Jobs Act.
Other Sources of Revenue
Non-personal and non-corporate revenues in the General Fund account for approximately 7 percent of the total.
One-fifth of this amount comes from Oregon Liquor Control Commission revenues, while estate taxes account
for another fifth.
Combined these sources of revenue have been revised downward by $108 million (-6%) relative to the previous
forecast for 2019-21. They are lowered $151 million (-11%) and $117 million (-8%) in 2021-23, and 2023-25,
respectively.
The majority of these downward revisions are due to the lower outlook for interest earnings. Given interest rate
cuts by the Federal Reserve and their signaling that they are willing to leave rates low until the economy is
recovered, this is a large departure from pre-virus assumptions. The result is a forecast change relative to last
quarter of -$44 million in 2019-21, -$88 million in 2021-23, and -$87 million 2023-25.
All other revenue items are revised downward as well, primarily due to the recession and/or social distancing.
For example, judicial revenues are lowered as many court cases have been temporarily delayed if possible to
keep with public health guidelines, plus criminal fine and fee collections are impacted due to the fact that
individual’s ability to pay is lower in a recession.
Estate tax collections are raised in fiscal year 2020 due to ongoing strong collections, however lowered over the
forecast horizon due to lower expectations for asset prices. To date there is no indication that COVID-19 has
impacted overall mortality, potentially increasing the number of estate tax payments in the year ahead.
Liquor revenues are lowered due to previous legislative actions that were not properly accounted for in previous
forecast. Our office regrets this oversight. Regarding the outlook, liquor sales to consumers have been strong in
recent months, but sales to bars and restaurants have been minimal. One key indicator to watch will be OLCC
license renewals, which will be one measure of closures in the leisure and hospitality sector. Renewals in March
2020 were solid. The next set of renewals are due in June.
19Tobacco revenues are largely unchanged, but lowered somewhat due to recent tracking and a lower level of
sales than previously assumed. Long-run changes are more pronounced among other tobacco products than
cigarettes, as consumption of moist snuff has leveled off considerably the past couple of years.
Extended General Fund Outlook
Table R.2 exhibits the long-run forecast for General Fund revenues through the 2027-29 biennium. Users should
note that the potential for error in the forecast increases substantially the further ahead we look.
Revenue growth in Oregon and other states will face considerable downward pressure over the 10-year
extended forecast horizon. As the baby boom population cohort works less and spends less, traditional state tax
instruments such as personal income taxes and general sales taxes will become less effective, and revenue
growth will fail to match the pace seen in the past.
Table R.2
General Fund Revenue Forecast Summary (Millions of Dollars, Current Law)
Forecast Forecast Forecast Forecast Forecast Forecast
2017-19 % 2019-21 % 2021-23 % 2023-25 % 2025-27 % 2027-29 %
Revenue Source Biennium Chg Biennium Chg Biennium Chg Biennium Chg Biennium Chg Biennium Chg
Personal Income Taxes 18,823.3 17.2% 16,879.3 -10.3% 18,508.1 9.6% 21,309.5 15.1% 24,231.7 13.7% 27,479.4 13.4%
Corporate Income Taxes 1,752.7 44.8% 1,081.8 -38.3% 1,157.6 7.0% 1,369.9 18.3% 1,689.7 23.3% 1,876.4 11.1%
All Others 1,339.3 3.9% 1,564.2 16.8% 1,266.8 ##### 1,349.0 6.5% 1,449.3 7.4% 1,581.2 9.1%
Gross General Fund 21,915.3 18.1% 19,525.3 -10.9% 20,932.5 7.2% 24,028.5 14.8% 27,370.7 13.9% 30,937.0 13.0%
Offsets and Transfers (129.5) (251.9) (101.2) (89.7) (54.8) (67.6)
Net Revenue 21,785.8 17.6% 19,273.4 -11.5% 20,831.3 8.1% 23,938.8 14.9% 27,315.9 14.1% 30,869.5 13.0%
Tax Law Assumptions
The revenue forecast is based on existing law, including measures and actions signed into law during the 2019
Oregon Legislative Session. OEA makes routine adjustments to the forecast to account for legislative and other
actions not factored into the personal and corporate income tax models. These adjustments can include
expected kicker refunds, when applicable, as well as any tax law changes not yet present in the historical data. A
summary of actions taken during the 2019 Legislative Session can be found in Appendix B Table B.3. For a
detailed treatment of the components of the 2019 Legislatively Enacted Budget, see: LFO 2019-21 Budget
Summary.
Although based on current law, many of the tax policies that impact the revenue forecast are not set in stone. In
particular, sunset dates for many large tax credits have been scheduled. As credits are allowed to disappear,
considerable support is lent to the revenue outlook in the outer years of the forecast. To the extent that tax
credits are extended and not allowed to expire when their sunset dates arrive, the outlook for revenue growth
will be reduced. The current forecast relies on estimates taken from the Oregon Department of Revenue’s 2019-
21 Tax Expenditure Report together with more timely updates produced by the Legislative Revenue Office.
20General Fund Alternative Scenarios
The latest revenue forecast for the current biennium represents the most probable outcome given available
information. OEA feels that it is important that anyone using this forecast for decision-making purposes
recognize the potential for actual revenues to depart significantly from this projection.
Table R.2b shows the revenue TABLE R2b June 2020
Alternative Cyclical Revenue Forecast ($ millions)
implications of the two alternative 2017-19 BN 2019-21 BN 2021-23 BN 2023-25 BN 2025-27 BN
economic scenarios described on page Baseline Case FY '18 FY '19 FY '20 FY '21 FY '22 FY '23 FY '24 FY '25 FY '26 FY '27
14. If the recovery were to take a
Personal Income
Level 206.7 218.6 226.0 224.1 231.0 242.7 254.2 269.9 284.2 298.8
% change 6.0% 5.8% 3.4% -0.8% 3.1% 5.1% 4.7% 6.2% 5.3% 5.1%
step back next year as called for in the Taxes
pessimistic scenario, revenues in the Personal Income
Corporate Excise & Income
8,872
739
9,909
927
8,089
767
8,790
314
9,032
549
9,477
608
10,315
654
10,995
716
11,695
808
12,536
882
2021-23 biennium would be reduced
Other General Fund 633 706 785 779 624 643 665 684 710 739
Total General Fund 10,244 11,542 9,642 9,883 10,205 10,728 11,634 12,395 13,213 14,157
% change 4.3% 12.7% -16.5% 2.5% 3.3% 5.1% 8.4% 6.5% 6.6% 7.1%
by $1.4 billion. If the recovery gets up
Optimistic Case
to speed quickly as called for in the
FY '18 FY '19 FY '20 FY '21 FY '22 FY '23 FY '24 FY '25 FY '26 FY '27
Personal Income
optimistic scenario, revenues in the Level 206.7 219.7 227.3 226.0 233.9 245.5 258.1 275.5 291.7 308.4
% change 6.0% 6.3% 3.5% -0.6% 3.5% 5.0% 5.1% 6.8% 5.9% 5.7%
2021-23 biennium would be increased Taxes
by $0.5 billion. Personal Income
Deviation from baseline
8,872
0
9,956
47
8,220
130
9,050
260
9,290
259
9,690
213
10,555
240
11,275
280
12,061
366
12,995
459
Corporate Excise & Income 739 931 780 324 565 622 669 735 833 914
Corporate Activity Tax
Deviation from baseline 0 4 12 9 16 14 15 18 25 32
Other General Fund 633 710 790 786 632 650 676 698 729 763
Total General Fund 10,244 11,597 9,790 10,159 10,487 10,962 11,900 12,708 13,623 14,673
HB 3427 (2019) created a new state % change
Deviation from baseline
4.3%
0
13.2%
55
-15.6%
148
3.8%
276
3.2%
282
4.5%
234
8.6%
266
6.8%
313
7.2%
410
7.7%
515
Biennial Deviation 55 423 516 579 925
revenue source by implementing a
corporate activity tax (CAT) that went Pessimistic Case FY '18 FY '19 FY '20 FY '21 FY '22 FY '23 FY '24 FY '25 FY '26 FY '27
Personal Income
into effect January 2020. Projected Level 206.7 217.4 223.7 217.2 220.0 228.6 236.7 253.2 267.7 281.2
% change 6.0% 5.2% 2.9% -2.9% 1.3% 3.9% 3.5% 7.0% 5.7% 5.0%
gross revenues equal $1.2 billion for Taxes
2019-21 and $2.2 billion in 2021-23, Personal Income
Deviation from baseline
8,872
0
9,853
-56
7,929
-161
8,349
-441
8,465
-566
8,828
-648
9,535
-780
10,266
-729
10,969
-727
11,747
-790
down substantially from the original
Corporate Excise & Income 739 921 752 299 515 567 604 669 758 826
Deviation from baseline 0 -5 -15 -16 -34 -42 -49 -47 -50 -56
Other General Fund 633 702 778 755 594 605 620 641 669 696
estimates. These revenues are Total General Fund 10,244 11,476 9,458 9,402 9,574 10,000 10,759 11,576 12,395 13,269
% change 4.3% 12.0% -17.6% -0.6% 1.8% 4.4% 7.6% 7.6% 7.1% 7.0%
dedicated to spending on education. Deviation from baseline
Biennial Deviation
0 -65
-65
-184 -481
-665
-631 -727
-1,358
-875 -818
-1,694
-818 -889
-1,707
The legislation also included personal income tax rate reductions, reducing General Fund revenues. The net
impact of HB 3427 was designed to generate approximately $1 billion per year in new state resources, or $2
billion per biennium.
In terms the macroeconomic effects of a major new tax, the Office of Economic Analysis starts with the
Legislative Revenue Office’s (LRO) impact statement and any Oregon Tax Incidence Model (OTIM) results LRO
found. At the top line, OTIM results find minimal macroeconomic impacts across Oregon due to the new tax.
Personal income, employment, population, investment and the like are less than one-tenth of a percent
different under the new tax relative to the baseline. The model results also show that price levels (inflation) will
increase above the baseline as some of the CAT is pushed forward onto consumers. Of course these top line,
statewide numbers mask the varying experiences that individual firms and different industries will experience.
There are likely to be some businesses or sectors that experience large impacts from the CAT, or where
pyramiding increases prices to a larger degree, while other businesses or sectors see relatively few impacts.
Given that 2020 is the first year of the tax, the only concurrent data available are the quarterly estimated
payments submitted during the tax year. The first substantive information will come in the form of tax returns
21filed in the spring of 2021. Under normal circumstances, OEA would have held to the original LRO revenue
estimates until then. However, given the enormity of the shift in economic circumstances associated with the
Covid-19 pandemic, adjusted ten-year revenue projections were made. At the same time, revisions to the
Bureau of Economic Analysis’ Gross State Product series, a fundamental input in the original estimation
methodology, were also incorporated. The total impact amounts to decreases of 25.6 percent and 21.3 percent
in 2019-21 and 2021-23, respectively.
Table B.12 in Appendix B has details on 10 year forecast and the allocation of resources, while the personal
income tax reductions are built into the General Fund forecasts shown in Tables B.1 and B.2.
Lottery Earnings
Overall the lottery outlook is lowered considerably in both the 2019-21 and 2021-23 biennia due to social
distancing and the recession. Available resources in 2019-21 are lowered $364 million (-23%) and by $260
million (-16%) in 2021-23. The outer biennia are all lowered noticeably as well, but by somewhat smaller
percentages and reflect the reduced long-run economic outlook of a smaller population, fewer jobs, and less
total personal income in the state than previously forecasted.
When the restrictions on bars and restaurants were enacted in order to slow the spread of COVID-19, the
Oregon Lottery followed suit by turning off the video lottery terminals at retailers statewide. This resulted in
essentially no sales for a seven or eight week time period. The previous forecast for these weeks totaled more
than $150 million.
Beginning just a few days ago, 31 of Oregon’s 36 counties entered into Phase 1 reopening. While these counties
account for 46% of the state’s population and 39% of all jobs, they are also home to 42% of statewide video
lottery sales.
Initial sales over the past few days were relatively robust.
Among the counties in Phase 1 reopening, about half of
video lottery retailers were active, and total sales in these
counties were running close to 60 percent of their pre-
virus levels.
Once all counties reopen in the months ahead, sales are
expected to rebound considerably. However, just like the
economy at large, this rebound will be an incomplete
recovery. As consumers become more confident, they will
increase their level of play, however they will remain
somewhat cautious when it comes to discretionary
spending like gaming.
That said, by late 2022 (fiscal year 2023) video lottery sales are expected to return to their share of total
personal income as they were prior to the virus. Even so, sales are reduced over the entire forecast horizon due
to expectation of less total personal income.
As always, there are considerable risks to the outlook. On the upside, the level of pent-up demand for gaming
may return sales to a higher level, faster than assumed. The state has seen a noticeable increase in scratch ticket
sales in recent weeks, as players seek out available gaming opportunities and entertainment. Additionally, even
22though most professional sports were put on hiatus, some players continued to wager on table tennis. When
combined with the initial video lottery sales in Phase 1 reopening counties, this indicates that pent-up demand
for gaming and entertainment more broadly is real.
However, downside risks certainty remain. This initial pent-up demand may reflect the one-time household
recovery rebates or the extra $600 per week in expanded unemployment insurance payments. These are
temporary and any impact will fade in the weeks ahead. But the real downside risks pertain to hesitant
consumers only going out to their favorite bars and restaurants more gradually than assumed, or pull back
further on discretionary spending like they did in the aftermath of the Great Recession.
Modeling our office’s pessimistic scenario of a double-dip recession would further reduce the Lottery forecast by
$151 million in 2019-21 and $203 million in 2021-23 as sales would once again be reduced due to social
distancing and a slower reopening of the economy the second time around.
Lottery Outlook and Distributions
Big picture issues to watch include broader national trends in gaming markets, demographic preferences for
recreational activities, and to what extent consumers decrease the share of their incomes spent on gaming. Up
until the past couple of years, consumers had remained cautious with their disposable income. Increases in
spending on gaming had largely matched income growth.
Over the long run our office expects increased competition
for household entertainment dollars, increased
competition within the gaming industry, and potentially
shifts in generational preferences and tastes when it comes
to gaming. As such, our outlook for video lottery sales is
continued growth, however at a rate that is slightly slower
than overall personal income growth. Lottery sales will
continue to increase as Oregon’s population and economy
grows, however video lottery sales will likely be a slightly
smaller slice of the overall pie.
The full extended outlook for lottery earnings can be found
in Table B.9 in Appendix B.
23Budgetary Reserves
The state currently administers two general reserve accounts, the Oregon Rainy Day Fund4 (ORDF) and the
Education Stability Fund5 (ESF). This section updates balances and recalculates the outlook for these funds
based on the June revenue forecast.
As of this forecast the two reserve funds currently total a combined $1.59 billion. At the end of the current
2019-21 biennium, they will total $1.75 billion.
Oregon Budgetary Reserves (billions)
Educ. Stability Fund Rainy Day Fund Gen. Fund Ending Balance Effective Reserves ($ millions)
$4.0 24% April End
Forecast -->
$3.5 21% 2020 2019-21
$3.0 18%
ESF $708 $800
$2.5 15%
$2.0 12% RDF $878 $949
Percent of
$1.5 9% Reserves $1,586 $1,750
General Fund -->
$1.0 6%
$0.5 3%
% of GF 8.1% 9.0%
$0.0 0%
99- 01- 03- 05- 07- 09- 11- 13- 15- 17- 19- 21- 23- 25-
01 03 05 07 09 11 13 15 17 19 21 23 25 27
Biennium
Source: Oregon Office of Economic Analysis
The forecast for the ORDF includes two deposits for this biennium relating to the General Fund ending balance
from the previous biennium (2017-19). A deposit of $198.3 million was made in early 2020 after the accountants
closed the books. Additionally a $66.5 million deposit relating to the increased corporate taxes from Measure 67
is expected at the end of the biennium. This exact transfer amount is subject to some revision as corporate
filings are processed, however the transfer itself will occur. At the end of 2019-21 the ORDF will total $949.4
million. This balance is lower than the previous forecast due to a lower interest rate outlook.
The forecast for the ESF calls for $180.4 million in deposits during the 2019-21 biennium based on the current
Lottery forecast, a substantial reduction relative to the previous forecast. To date $113 million has been
transferring, meaning the remaining $67 million will be subject to economic and revenue forecast changes over
the remainder of the biennium. All told, this would bring the ESF balance to $800.1 million at the end of the
4
The ORDF is funded from ending balances each biennium, up to one percent of appropriations. The Legislature can deposit
additional funds, as it did in first populating the ORDF with surplus corporate income tax revenues from the 2005-07
biennium. The ORDF also retains interest earnings. Withdrawals from the ORDF require one of three triggers, including a
decline in employment, a projected budgetary shortfall, or declaration of a state of emergency, plus a three-fifths vote.
Withdrawals are capped at two-thirds of the balance as of the beginning of the biennium in question. Fund balances are
capped at 7.5 percent of General Fund revenues in the prior biennium.
5
The ESF gained its current reserve structure and mechanics via constitutional amendment in 2002. The ESF receives 18
percent of lottery earnings, deposited on a quarterly basis – 10% of which are deposited in the Oregon Growth sub-account.
The ESF does not retain interest earnings. The ESF has similar triggers as the ORDF, but does not have the two-thirds cap on
withdrawals. The ESF balance is capped at five percent of General Fund revenues collected in the prior biennium.
24current biennium. The ESF is still forecasted to reach its cap of 5% of the previous biennium’s General Fund
revenues at the end of FY2022. Once the cap it reached, transfers accrue to the Capital Matching Account.
Together, the ORDF and ESF are projected to have a combined balance of $1.75 billion at the close of the 2019-
21 biennium, or 9 percent of current revenues. Such levels of reserve balances are bigger than Oregon has ever
been able to accumulate, at least in the state’s recent history. They are needed today given the severe recession
and the fact the economic recovery will take years.
B.10 in Appendix B provides more details for Oregon’s budgetary reserves.
Recreational Marijuana Tax Collections
Marijuana sales during the pandemic have been quite
strong. The dollar amount of recreational sales since March
1st are up 60 percent relative to a year ago. These increases
are not only related to the stockpiling consumers did after
the sheltering in place policies were enacted, but have
continued through April and early May.
Interestingly, the share of home delivery sales has more than
doubled in recent months but remains just 1.4 percent of all
sales. Consumers still prefer to shop in store.
Some of the increases in sales of usable marijuana are in
part due to rising prices, but underlying demand is up as well. The increase in sales for other marijuana products,
like concentrates, edibles and the like, are due to significant gains in consumer demand as prices are flat or
down.
All told, marijuana available resources are revised higher by
$9 million in 2019-21 due to recent sales. Expectations are
that some of these increases are due to temporary factors
like the one-time household recovery rebates, expanded
unemployment insurance benefits, and the shelter in place
style policies. As the impact of these programs fade in the
months ahead, and bars and restaurants reopen to a larger
degree, marijuana sales are expected to mellow.
Over the extended forecast horizon, marijuana sales are
reduced approximately five percent relative to the previous
forecast due to the lower economic outlook. A relatively
smaller population indicates fewer potential customers and lower total personal income than previously
assumed indicates less consumer demand, all things being equal.
See Table B.11 in Appendix B for a full breakdown of distributions for recreational marijuana tax collections. Note
that these distributions are based on current law.
25POPULATION AND DEMOGRAPHIC OUTLOOK
Population and Demographic Summary
Oregon’s population count on April 1, 2010 was 3,831,074. Oregon gained 409,550 persons between the years
2000 and 2010. The population growth during the decade of 2000 to 2010 was 12.0 percent, down from 20.4
percent growth from the previous decade. Oregon’s rankings in terms of decennial growth rate dropped from
11th between 1990 and 2000 to 18th between 2000 and 2010. Oregon’s national ranking, including D.C., in
population growth rate was 12th between 2010 and 2019 lagging behind all of our neighboring states, except
California. Slow population growth during the decade preceding the 2010 Census characterized by double
recessions probably cost Oregon one additional seat in the U.S. House of Representatives. Actually, Oregon’s
decennial population growth rate during the most recent census decade was the second lowest since 1900. As a
result of economic downturn and sluggish recovery that followed, Oregon’s population increased at a slow pace
in the recent past. However, Oregon’s current population is showing strong growth as a consequence of state’s
strong economic recovery. Population growth between 2018 and 2019 was 13th fastest in the nation. Due to this
better than average growth on national scale, Oregon will most likely get an additional seat in the U.S. House of
Representatives. Based on the current forecast, Oregon’s population of 4.236 million in 2019 will reach
4.578 million in the year 2029 with an annual rate of growth of 0.78 percent between 2019 and 2029. The
projected population of 2029 is 34,100 less than our March forecast. The decline is due to the COVID-19 effect.
Oregon’s economic condition heavily influences the state’s population growth. Its economy determines the
ability to retain existing work force as well as attract job seekers from national and international labor market.
As Oregon’s total fertility rate remains below the replacement level and number of deaths continue to rise due
to aging population, long-term growth comes mainly from net in-migration. Working-age adults come to Oregon
as long as we have favorable economic and living conditions. During the 1980s, which include a major recession
and a net loss of population during the early years, net migration contributed to 22 percent of the population
change. On the other extreme, net migration accounted for 76 percent of the population change during the
booming economy of early 1990s. This share of migration to population change declined to 32 percent in 2010,
lowest since early 1980s when we actually had negative net migration for several years. As a sign of slow to
modest economic gain and declining natural increase (births minus deaths), the ratio of net migration-to-
population change has registered at 87 percent in 2019 and will continue to rise through the forecast horizon
after 2021 once we recover from the COVID-19 pandemic. By 2025, all of Oregon’s population growth and more
will come from the net migration due to the combination of continued high net migration, decline in the number
of births, and the rise in the number of deaths. The natural increase of population, defined as the numbers of
births minus deaths, will actually turn negative by 2025 due to below replacement level fertility and increase in
the number of deaths associated with the increase in the elderly population. With Oregon’s favorable economic
and environmental conditions post-coronavirus pandemic, high level of net migration into Oregon will continue.
Not too far into the future, migration will be solely responsible for Oregon’s population growth.
Age structure and its change affect employment, state revenue, and expenditure. Demographics are the major
budget drivers, which are modified by policy choices on service coverage and delivery. Growth in many age
groups will show the effects of the baby-boom and their echo generations during the forecast period of 2019-
2029. It will also reflect demographics impacted by the depression era birth cohort combined with changing
migration of working age population and elderly retirees through history. After a period of slow growth during
the 1990s and early 2000s, the elderly population (65+) has picked up a faster pace of growth and will continue a
26very high level as the baby-boom generation continue to enter this age group combined with the attrition of
small depression era cohort due to death. However, this age cohort seems to have hit the highest point and will
continue a high but diminishing rate of growth. The average annual growth of the elderly population will be 2.7
percent during the 2019-2029 forecast period. Different age groups among the elderly population show quite
varied and fascinating growth trends. The youngest elderly (aged 65-74), which has been growing at an
extremely fast pace in the recent past, will exhibit a tendency to slow down in the future. The annual growth
rate of this youngest elderly will exceed 3 percent in the near future due to the direct impact of the baby-boom
generation entering the retirement age and smaller pre-baby boom cohort exiting the 65-74 age group. This fast
paced growth rate will taper off to negative growth by the end of the forecast period as a sign of end of the
baby-boom generation transitioning to elderly age group. This high growth transitioning into a net loss of this
youngest elderly population result in 1.1 percent growth rate in the next ten years. Reversing several years of
slow growth and a period of shrinking population, the elderly aged 75-84 started to show a positive growth as
the effect of depression era birth-cohort has dissipated. An unprecedented fast pace of growth of population in
this age group has started as the baby-boom generation is starting to mature into 75-84 age group. Annual
growth rate during the forecast period of 2019-2029 is expected to be unusually high 5.2 percent. The oldest
elderly (aged 85+) will continue to grow at a slow rate but steadily gaining growth momentum due to the
combination of cohort change, continued positive net migration, and improving longevity. The average annual
rate of growth for this oldest elderly over the forecast horizon will be 3.2 percent. An unprecedented growth in
oldest elderly will commence near the end of the forecast horizon as the fast growing 75-84 age group
population transition into this oldest elderly age cohort. As a sign of massive demographic structural change of
Oregon’s population, starting in 2023 the number of elderly population will exceed the number of children
under the age of 18. To illustrate the contrast, in 1980 elderly population numbered less than half of the number
of children in Oregon.
As the baby-boom generation matures out of oldest working-age cohort combined with slowing net migration,
the once fast-paced growth of population aged 45-64 has gradually tapered off to below zero percent rate of
growth by 2012 and has remained and will remain at slow or below zero growth phase for several years. The size
of this older working-age population will see only a small increase by the end of the forecast period. The 25-44
age group population has recovered from several years of declining and slow growing trend. The decline was
mainly due to the exiting baby-boom cohort. This age group has seen positive but slow growth starting in the
year 2004 and will increase by 1.0 percent annual average rate during the forecast horizon mainly because of
the exiting smaller birth (baby-bust) cohort being replaced by larger baby-boom echo cohort. The young adult
population (aged 18-24) will remain nearly unchanged over the forecast period. Although the slow or stagnant
growth of college-age population (age 18-24), in general, tend to ease the pressure on public spending on higher
education, but college enrollment typically goes up during the time of very competitive job market, high
unemployment, and scarcity of well-paying jobs when even the older people flock back to colleges to better
position themselves in a tough job market. The growth in K-12 population (aged 5-17) will remain nearly
unchanged in the near future and will decline through the rest of the forecast years. This will translate into slow
growth or even decline in the school enrollments. On average for the forecast period, this school-age
population will actually decline by -0.5 percent annually. The growth rate for children under the age of five has
remained below or near zero percent in the recent past and will continue to decline due to the sharp decline in
the number of births. Although the number of children under the age of five declined in the recent years, the
27demand for child care services and pre-Kindergarten program will be additionally determined by the labor force
participation and poverty rates of the parents.
Overall, elderly population over age 65 will increase rapidly whereas the number of children actually decline
over the forecast horizon. The number of working-age adults in general will show fast paced growth after the
year 2023. Hence, based solely on demographics of Oregon, demand for public services geared towards children
and young adults will likely to decline or increase at a slower pace, whereas demand for elderly care and services
will increase rapidly.
Procedure and Assumptions
Population forecasts by age and sex are developed using the cohort-component projection procedure. The
population by single year of age and sex is projected based on the specific assumptions of vital events and
migrations. Oregon’s estimated population of July 1, 2010 based on the most recent decennial census is the
base for the forecast. To explain the cohort-component projection procedure very briefly, the forecasting model
"survives" the initial population distribution by age and sex to the next age-sex category in the following year,
and then applies age-sex-specific birth and migration rates to the mid-period population. Further iterations
subject the in-and-out migrants to the same mortality and fertility rates.
Populations by age-sex detail for the years 2000 through 2009, called intercensal estimates, in the tables in
Appendix C are developed by OEA based on 2000 and 2010 censuses. Post-censal population totals for the years
2010 through 2019 are from the Population Research Center, Portland State University. The numbers of births
and deaths through 2018 are from Oregon's Center for Health Statistics. All other numbers and age-sex detail
are generated by OEA.
Annual numbers of births are determined from the age-specific fertility rates projected based on Oregon's past
trends and past and projected national trends. Oregon's total fertility rate is assumed to be 1.6 per woman in
2019 and this rate is projected to remain well below the replacement level of 2.1 children per woman during the
forecast period, tracking below the national rate.
Life Table survival rates are developed for the year 2010. Male and female life expectancies for the 2010-2029
period are projected based on the past three decades of trends and national projected life expectancies.
Gradual improvements in life expectancies are expected over the forecast period. At the same time, the
difference between the male and female life expectancies will continue to shrink. The male life expectancy at
births of 77.4 and the female life expectancy of 81.8 in 2010 are projected to improve to 79.4 years for males
and 83.5 years for females by the year 2029.
Estimates and forecasts of the number of net migrations are based on the residuals from the difference between
population change and natural increase (births minus deaths) in a given forecast period. The migration
forecasting model uses Oregon’s employment, unemployment rates, income/wage data from Oregon and
neighboring states, and past trends. Distribution of migrants by age and sex is based on detailed data from the
American Community Survey. In the recent past, slowdown in Oregon’s economy resulted in smaller net
migration and slow population growth. Estimated population growth and net migration rates in 2010 and 2011
were the lowest in over two decades. Migration is intrinsically related to economy and employment situation of
the state. Still, high unemployment and job loss in the recent past have impacted net migration and population
growth, but not to the extent in the early 1980s. Main reason for this is the fact that other states of potential
destination for Oregon out-migrants were not faring any better either, limiting the potential destination choices.
28The role of net migration in Oregon’s population growth will get more prominence as the natural increase will
decline considerably due to rapid increase in the number of deaths associated with aging population and decline
in the number of births largely due to the decline in fertility rate. The annual net migration is expected to be far
less than the forecast released in March 2020 in the short run due to the COVID-19 effect. However, the
migration is expected to recover during the late 2020 and early 2021. Between 2019 and 2029 is expected to be
in the range of 20,700 to 39,700, averaging 33,950 persons annually.
29You can also read