First Quarter 2020 Chartbook - Data as of November 30, 2019
←
→
Page content transcription
If your browser does not render page correctly, please read the page content below
First Quarter 2020 Chartbook
           Data as of November 30, 2019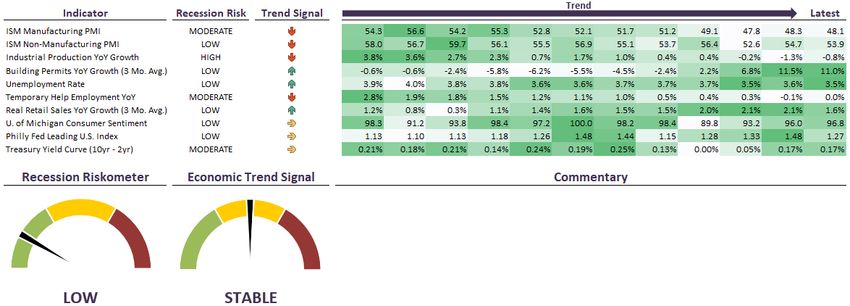
First Quarter 2020 Outlook

Economy – When Growth Doesn’t Feel Like Growth

• GDP growth is slowing from high 2018 levels, but 2020 expected growth is near expansion averages.

• Manufacturing data is contracting, but the much larger servicing sector is still in expansion.

• Labor markets remain healthy, although the pace of jobs growth has trended slightly lower than a year ago.

Equities – Will High Valuations Lower Returns in 2020?

•   Stocks enter 2020 with above-average valuations in most major equity categories.

•   Inflated valuations could cause more volatility in the year ahead.

•   Low interest rates, a rebound in earnings growth, and rising deficit spending will be supportive for stocks.

Fixed Income – After Best Year in 17 Years, What’s Next?

• High yield credit spreads are at relatively lower levels again, after widening at the end of last year.

• After the Treasury yield curve inverted, it is now starting to steepen.

                                                                                                                   page 2
U.S. Economic Risk Overview
The dials on the left show our combined estimate of near-term recession risk and direction of economic
growth, based on the average reading of ten economic indicators. The Recession Riskometer focuses on
producer sentiment, output and manufacturing growth, employment, consumer strength and leading
economic indicators.
• At this time, six out of ten recession risk indicators signal a low risk of recession. Three indicators are
signaling a moderate risk of a recession and one indicator is signaling a high risk of recession. Overall,
the Recession Riskomoter is signaling a low risk of recession in the near-term.
• The overall economic trend signal is stable. At present, four of the indicators are in a negative trend,
three indicators have a stable trend, and three indicators have a positive trend. Although the pace of
economic growth slowed this year, there are signs that growth will stabilize in 2020. Manufacturing
activity appears to be bottoming, while services activity remains in expansion territory.
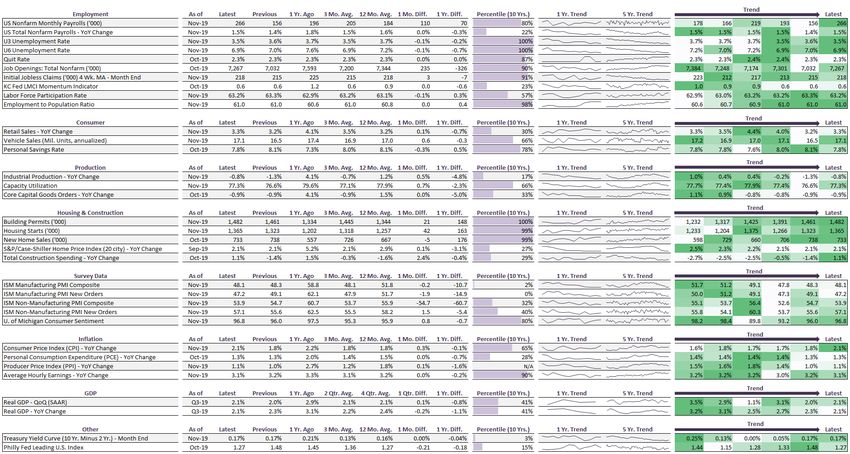
Sources are listed on pages 34-35. Data as of 11/30/2019.
The ISM Manufacturing PMI index fell narrowly in November. This indicator is The ISM Non-Manufacturing Index, a barometer for services activity, dropped to 53.9
trending lower and contracting. The index is in the 12th percentile. in November. This indicator is still in expansion territory, but is trending lower
A reading over 50 indicates expansion, below 50 signals contraction, and in the mid A reading over 50 indicates expansion, below 50 signals contraction, and in the mid
40's suggests recession. 40's suggests recession. page 3U.S. Economic Risk Indicators
YoY Industrial Production growth declined by -0.8% in November and remains in a The 3-month average of building permits narrowly slowed to 11.0% YoY in
downward trend since reaching an intermediate-term peak last fall. The most November. The current reading is higher than 81% of all monthly readings over
recent YoY figure is lower than 77% of all monthly readings over the last 20 years. the past 20 years and is signaling a low risk of recession. After a pullback in
This level has indicated a high recession risk historically. housing earlier this year, there are signs that activity is accelerating.
Industrial Production Index measures real output for manufacturing, mining, and Building Permits are a measure of the issuance of permits to build new housing
utilities. The YoY change in Industrial Production signals a high risk of recession units. Building permit growth is a measure of the total year-over-year percentage
when it falls into negative territory. There is a low recessionary risk when greater change in building permits (3-month average). This indicator signals a high
than 1%. recession risk when growth falls below -15% YoY.
The unemployment rate fell to a 50-year low of 3.5% in November, as jobs growth The year-over-year change in temporary help employment has trended lower this
accelerated to a 10-month high last month. Caution is advised if the unemployment year and is currently flat YoY as of November. The current reading is currently
rate begins to move higher. higher than 29% of all months over the past 20 years. Caution is warranted if this
indicator falls towards flat or negative YoY growth.
The U3 Unemployment Rate measures the percentage of people without jobs who
are actively seeking work. This is often the officially quoted unemployment rate. Temporary help employment figures are viewed favorably if they are positive and
trending higher. Changes in temporary help numbers are often used as a predictor
of changes in future employment.
Sources are listed on pages 34-35. Data as of 11/30/2019. page 4U.S. Economic Risk Indicators
The three-month average of Real Retail Sales fell to 1.6% YoY through November. The University of Michigan Consumer Sentiment index increased slightly in November
This reading is higher than 38% of all readings over the last 20 years. Retail sales to 96.8. This indicator is currently in the 83rd percentile, meaning it is higher than 83%
growth has trended higher after weakening earlier in the year. of all months over the last 20 years.
Real retail sales growth is a measure of the total year-over-year change in retail Strong consumer confidence is a positive signal for future consumer spending, but it is
and food sales adjusted for inflation using the Consumer Price Index. Real retail a concern if this indicator is trending lower. The index uses surveys to gather
sales typically decline heading into a recession, and a weaker reading is a concern information on consumer expectations regarding the economy.
for the economy.
The Philly Fed Leading Index dropped to 1.27 in October from 1.48 in September. The 2-10 yield curve spread was 0.17% at the end of November and has trended
The leading index remains at a level that indicates stable economic growth in future slightly higher after briefly inverting over the summer.
months. The Philly Fed Leading Index is in the 41st percentile – it is higher than
41% of all months over the last 20 years. The difference (spread) between the yields of the 10-Year and 2-Year maturity
Treasury bonds is one of the early and reliable predictors of a recession. Under normal
The Philly Fed Leading Index is a composite index of several U.S. economic conditions the 10-Year/2-Year spread is positive, and as recession nears the spread
indicators that lead the economy. This indicator historically has declined into flattens and turns negative. This indicator will shift to high recession risk when the
negative territory in recessions and rises back into positive territory in expansions. spread is below zero.
Sources are listed on pages 34-35. Data as of 11/30/2019. page 5Equity Valuation Overview
Commentary
• As measured by Price-to-Earnings, U.S. large cap stocks have an elevated valuation level compared
international and U.S. small cap stocks. The P/E ratio for U.S. large cap growth stocks is 1.9 st. dev’s
above the 15-year average. U.S. small cap stocks are trading at a discount vs their 15-yr avg. P/E.
• Emerging market and international value stocks are slightly above their historical valuations, while
international developed and international growth stocks have elevated valuations vs their 15-yr avg.
• Based on Price-to-Book, U.S. large cap and growth stocks have a valuation premium compared to
other categories.
• International developed (MSCI EAFE) and Emerging markets (MSCI Emerging Markets) have a
discounted P/B ratio compared to U.S. stocks. They are also discounted versus their 15-year
averages.
The two charts above show equity valuations based on the average Price-to-Earnings (P/E) and Price-to-
Book (P/B) ratios for commonly used equity benchmarks. To the left, current valuations are compared to
their 15-year average, and we show how far (as measured by standard deviation) the current valuation is
from the average. Valuations within 0.5 standard deviations are close to historic norms, a reading around
1.5 indicates high valuation, and figures above 2 are near historic highs. The percentile figure shown
next provides a ranking of each index valuation relative to its 15-year history. As an example, if the
percentile is 80%, valuation is higher than 80% of all other observations for that index over the past 15-
years and lower than 20% of the observations.
Source: Cetera Investment Management, Morningstar, MSCI and Standard & Poor’s. Data as of 11/30/2019. page 6Sector Valuation Overview
Commentary
Cyclical sectors:
• Valuations for consumer discretionary stocks are well above their historical average for P/E (2.1 standard deviations) and P/B (1.8 standard deviations). Financial
stocks are trading near their historical average valuation levels. The Materials sector is trading at a premium versus its historical average P/E level, but is below its
average P/B level.
Economically-sensitive sectors:
• Energy stocks have struggled this cycle and their valuation levels are discounted based on their historical P/B level. Meanwhile, the technology sector is trading
significantly above its historical average based on P/E and P/B. Industrial stocks are also trading at a premium versus their historical valuation levels.
Defensive sectors:
• The defensive sectors have stretched valuation levels following strong performance earlier this year. The P/E ratio for the consumer staples sector is at its highest
level in the last 15 years. The P/E ratio for the utilities sector is 1.7 standard deviations above its 15-year average.
These charts show sector valuations based on the average Price-to-Earnings (P/E) and Price-to-Book (P/B) ratios for the sectors within the S&P 500 index. Valuations
are compared to 15 year averages, and we show by how many standard deviations the current is from the average. The percentile figure shown next provides a
ranking of each index valuation relative to its 15-year history. As an example, if the percentile is 80%, it is greater than 80% of all other observations over the past 15
years and lower than 20% of observations.
*S&P 500 Real Estate Index does not have 15 years of historical data page 7
Source: Cetera Investment Management, Morningstar, and Standard & Poor’s. Data as of 11/30/2019.Fixed Income Overview
Commentary
• Bond yields moved slightly higher QTD after reaching a three-year low in Q3.
• Most bond categories have a yield that is well below their averages due to low growth prospects.
• Short-term bonds remain attractive, in our view, at these levels. They have comparable yields with
intermediate-term debt, with less duration risk. Bond yields are closer to the bottom end of a multi-
year range, and could move higher if growth exceeds expectations or global trade relations improve.
The Yield chart above shows current yields for several commonly used fixed income benchmarks,
compared to their 15-year average. The Treasury Spreads chart shows spreads of credit-sensitive bond
sectors relative to Treasury bonds. We also show by how many standard deviations the current yield is
from its average, and how often has it been as high or as low for the past 15 years.
page 8
Source: Cetera Investment Management, Morningstar, BofAML, BBgBarc, JPMorgan, Federal Reserve Bank of St. Louis. Data as of 11/30/2019.Appendix
U.S. Economic Overview

Sources are listed on pages 34-35. Data as of 11/30/2019.   page 10
Post-WWII Economic Expansions and Subsequent Recession Length
                                                                                                                                                   125
                                                                                                                               120
              120

                                                                 106

              100
                                                                                                                      92

              80
                                                                                                                                         73
# of Months

                                                                                            58                                                                 Expansion
              60
                                                                                                                                                               Recession
                              45
                                        39
              40    37                                                        36

                                                    24
                                                                                                                                              18
              20                                                                    16                           16
                         11                                            11                                   12
                                   10                    10
                                             8                                                                             8         8
                                                                                                 6

               0

                                                                                                                                                   *Current
                                                                            Year Expansion Started                                                 Expansion

Source: Cetera Investment Management, National Bureau of Economic Research (NBER). Data as of 11/30/2019.                                                        page 11
Slow Expansion
50.0%
45.0%
40.0%
35.0%
Real GDP Growth
30.0%
25.0%
* current expansion
20.0%
15.0%
10.0%
5.0%
0.0%
0 1 2 3 4 5 6 7 8 9 10
# of Years Into Expansion
1961 1970 1975 1980 1982 1991 2001 2009
Source: Cetera Investment Management, Federal Reserve Bank of St. Louis, U.S. Bureau of Economic Analysis. The chart shows the level of Real GDP
growth for U.S. economic expansions since 1961. Data as of 9/30/2019. page 12Percent of Active Managers Beating Category Benchmark
Performance Standard Deviation Commentary
Category 3 Mo. YTD 1 Yr. 3 Yr. 2018 2017 1 Yr. 3 Yr.
• In recent months, there has been solid
outperformance for active managers in Mid Cap
Domestic Large Cap Core 40% 23% 23% 19% 35% 34% 43% 49%
Value, Foreign Large Core, World Bond, Municipal –
Domestic Large Growth 26% 20% 21% 27% 44% 35% 57% 56% High Yield, Short Govt/Corp, Emerging Market
Domestic Large Cap Value 46% 35% 39% 50% 41% 79% 46% 59% Bonds, Multisector Bond, and Managed Futures.
Domestic Mid Cap Core 62% 16% 17% 16% 31% 24% 44% 34%
Domestic Mid Cap Growth 40% 31% 29% 33% 42% 42% 47% 41% • Asset classes that managers have struggled to
Domestic Mid Cap Value 70% 43% 42% 36% 37% 58% 33% 23% outperform in the last three months include Large
Cap Growth, Small Cap Core, Small Cap Growth,
Domestic Small Cap Core 31% 39% 41% 25% 34% 28% 53% 54%
Municipal – Short Term, Natural Resources, Equity
Domestic Small Cap Growth 21% 47% 52% 59% 76% 47% 64% 52% Long/Short, and Multialternative.
Domestic Small Cap Value 41% 45% 49% 29% 22% 59% 32% 36%
Foreign Large Core 69% 66% 58% 38% 43% 31% 43% 40% • The relative advantage of actively managed funds is
Foreign Large Growth 62% 63% 51% 38% 55% 33% 42% 38% more evident when looking at risk levels. When
Foreign Large Value 63% 86% 71% 52% 21% 59% 36% 35% comparing standard deviations to category
Global Equity 38% 47% 44% 41% 50% 47% 45% 40% benchmarks, active funds tend to more consistently
show lower risk characteristics. At present, this is
Emerging Markets 44% 67% 65% 38% 28% 44% 61% 53% true for many categories in the one- and three-year
Intermediate Core Bond 39% 38% 31% 32% 35% 37% 63% 69% timeframes shown here.
World Bond 100% 77% 60% 51% 36% 28% 92% 83%
Municipal - Short Term 32% 37% 34% 41% 5% 51% 72% 75%
Municipal - Intermediate 80% 19% 13% 10% 17% 16% 93% 97%
Municipal - Long Term 37% 14% 14% 6% 16% 12% 88% 92% This chart shows the percentage of active managers
beating their category benchmark in each of the
Municipal - High Yield 98% 90% 78% 78% 57% 87% 49% 85%
Morningstar categories listed. We also show the
High Yield Bond 68% 38% 37% 17% 38% 33% 62% 56% percentage of active managers that have lower risk, or
Bank Loan 47% 29% 31% 13% 25% 30% 62% 56% standard deviation, relative to their Morningstar category
Short Govt/Corp 86% 34% 15% 48% 28% 77% 91% 86% benchmark.
Emerging Markets Bond 75% 21% 11% 38% 35% 74% 29% 32%
Specialty - TIPS 71% 20% 12% 29% 33% 38% 69% 73% A darker background color indicates that actively
managed funds are outperforming, with over 67% of
Multisector Bond 87% 53% 15% 68% 31% 94% 45% 49%
non-index funds beating the category benchmark. The
Real Estate 43% 82% 82% 54% 14% 67% 79% 85% lightest color indicates that active management is
Global Real Estate 61% 26% 42% 51% 33% 94% 65% 70% lagging, with 33% or lower of active managers beating
Specialty - Natural Resources 13% 13% 23% 14% 27% 66% 87% 79% the category benchmark. The middle shade indicates
Equity Long/Short 5% 5% 8% 0% 39% 5% 93% 89% close to average results. For risk, as measured by
Market Neutral 57% 49% 51% 57% 43% 70% 0% 0% standard deviation, a darker color indicates risk lower
Managed Futures 72% 95% 70% 88% 29% 94% 54% 53% than 67% of the peer group average risk, and the
lightest color indicates risk higher than 33% of the peer
Multialternative 4% 2% 5% 1% 65% 2% 89% 84%
group benchmark risk.
Above 67%
Between 33% and 67%
Below 33%
page 13
Source: Cetera Investment Management, Morningstar. Data as of 11/30/2019.Asset Class Historical Return Heat Map
Asset Class YTD 2018 2017 2016 2015 2014 2013 2012 2011 2010 2009
US Large Cap 27.63 -4.38 21.83 11.96 1.38 13.69 32.39 16.00 2.11 15.06 26.46
US Large Cap Growth 27.40 -0.01 27.44 6.89 5.52 14.89 32.75 14.61 4.65 15.05 31.57
US Large Cap Value 27.94 -8.95 15.36 17.40 -3.13 12.36 31.99 17.68 -0.48 15.10 21.18
US Mid Cap 22.75 -11.08 16.24 20.74 -2.18 9.77 33.50 17.88 -1.73 26.64 37.38
US Small Cap 19.22 -8.48 13.23 26.56 -1.97 5.76 41.31 16.33 1.02 26.31 25.57
International Developed 18.78 -13.36 25.62 1.51 -0.39 -4.48 23.29 17.90 -11.73 8.21 32.46
Emerging Market Equities 10.57 -14.25 37.75 11.60 -14.60 -1.82 -2.27 18.63 -18.17 19.20 79.02
REITs 24.27 -4.22 3.76 6.68 4.48 32.00 1.22 17.12 9.37 28.07 28.46
Commodities 2.52 -11.25 1.70 11.77 -24.66 -17.01 -9.52 -1.06 -13.32 16.83 18.91
Gold 13.96 -2.81 12.79 7.75 -10.88 -1.75 -28.65 6.08 9.63 28.72 22.86
Intermediate-Term Treasurys 9.30 0.90 2.55 1.05 1.63 9.00 -6.04 4.16 15.59 9.37 -6.03
Long-Term Treasurys 18.53 -2.00 8.98 1.43 -1.59 27.48 -13.88 3.36 33.84 9.38 -21.40
TIPS 8.02 -1.26 3.01 4.68 -1.44 3.64 -8.61 6.98 13.56 6.31 11.41
Mortgage-Backed Securities 5.71 1.02 1.86 1.56 1.39 5.97 -2.12 2.42 7.90 6.67 5.37
Corporate IG Bonds 14.17 -2.51 6.42 6.11 -0.68 7.46 -1.53 9.82 8.15 9.00 18.68
High Yield Corporate Bonds 12.08 -2.08 7.50 17.13 -4.47 2.45 7.44 15.81 4.98 15.12 58.21
Emerging Market Debt 12.31 -4.61 9.32 10.19 1.23 5.53 -6.58 18.54 8.46 12.04 28.18
US Aggregate Bonds 8.79 0.01 3.54 2.65 0.55 5.97 -2.02 4.21 7.84 6.54 5.93
60-40 Allocation 20.10 -2.63 14.52 8.23 1.05 10.60 18.62 11.29 4.40 11.65 18.25
For each time frame, the heat map colors range from green (stronger relative performance) to red (weaker relative performance). There is a box around the return of the best
performing asset class in each time period.
Source: Cetera Investment Management, Morningstar, Standard & Poor's, MSCI, Dow Jones, Bloomberg, Barclays, JPMorgan. The Index used for each asset class
is listed on page 33. Data as of 11/30/2019.
page 14S&P 500 Historical Returns
page 15
Source: Cetera Investment Management, Morningstar, Standard & Poor’s. Data based on S&P 500 Index total return as of 11/30/2019.S&P 500 Average Monthly Returns
3.00
2.00
1.00
0.00
-1.00
-2.00
January February March April May June July August September October November December
10 Yr. Avg. 1.26 2.59 1.87 1.34 -0.99 0.46 2.31 -1.05 0.83 2.42 1.88 0.53
25 Yr. Avg. 0.55 0.36 1.73 2.09 0.56 0.31 0.87 -0.71 0.20 1.59 2.18 1.04
40 Yr. Avg. 1.27 0.68 1.28 1.80 1.13 0.46 1.06 0.26 -0.32 1.32 1.93 1.43
Source: Cetera Investment Management, Morningstar, Standard & Poor’s. Data based on S&P 500 Index as of 11/30/2019.
page 16Equity Valuation Charts
page 17
Source: Cetera Investment Management, Morningstar, MSCI, and Standard & Poor’s. Data as of 11/30/2019.Sector Valuation Charts Source: Cetera Investment Management, Morningstar, and Standard & Poor’s. Data as of 11/30/2019. page 18
S&P 500 Drawdowns (1950-2019)

 0%

-10%

-20%

                                                                                                                                                                                    Q4 2018
                                                                                                                                                                                    Correction
-30%

                                                       1969-70 Crash                                      1987 Crash
-40%

-50%
                                                                       1973-74 Crash                                                 Dot-Com Bubble Crash
                                                                                                                                                                     2008-2009
                                                                                                                                                                     Financial Crisis
-60%
    1950        1954      1958       1962       1966       1970         1974       1978     1982       1986       1990       1994   1998     2002      2006   2010        2014          2018

                                                                                                                                                                                 page 19
       Source: Cetera Investment Management, Yahoo Finance, Standard & Poor's. Data as of 11/30/2019. Based on closing prices.
S&P 500: 1% Days
S&P 500: +/- 1% Daily Moves
135
120
105
# of +/-1% Daily Moves
90
75
60
45
30
15
0
2008
2013
2018
1990
1991
1992
1993
1994
1995
1996
1997
1998
1999
2000
2001
2002
2003
2004
2005
2006
2007
2009
2010
2011
2012
2014
2015
2016
2017
2019
Market volatility has been subdued throughout 2019 and there have only been 37 days where the S&P 500 closed plus or minus
1%. That is well below the average of 63 since 1990. As seen in the chart, markets go through low and high volatility phases.
The last high volatility phase was from 2008 to 2011. Market volatility, for the most part, has been relatively limited since.
Source: Cetera Investment Management, Yahoo Finance, Standard & Poor’s. Data as of 11/30/2019.
page 20Building Permits
1,400
1,200
Building Permits ('000)
1,000
800
600
400
2008 2009 2010 2011 2012 2013 2014 2015 2016 2017 2018 2019
Building Permits 6-Month Avg
Housing activity is strengthening as we head into 2020. Building permits, a leading indicator for housing activity, are at a 12-year
high and in a clear uptrend. The drop in mortgage rates, combined with a 50-year low in unemployment, have boosted housing
activity after a lackluster year in 2018.
Source:Cetera
Source: Cetera Investment
InvestmentManagement,
Management, Standard
Federal Reserve
& Poor's.Bank
Dataofas
St.ofLouis,
3/9/2018.
U.S.Based
Bureauonofclosing
the Census.
prices.Monthly housing starts data is annualized and
shown in thousands. Data as of 11/30/2019. page 21Disclosures
About Cetera® Investment Management
Cetera Investment Management LLC is an SEC registered investment adviser owned by Cetera Financial Group. Cetera
Investment Management provides market perspectives, portfolio guidance, model management, and other investment advice to
its affiliated broker-dealers, dually registered broker-dealers and registered investment advisers.
About Cetera Financial Group®
Cetera Financial Group ("Cetera") is a leading network of independent firms empowering the delivery of professional financial
advice to individuals, families and company retirement plans across the country through trusted financial advisors and financial
institutions. Cetera has re-defined the delivery of financial advice through the establishment of a truly Advice-Centric
Experience™ for both advisors and their clients. Cetera is the second-largest independent financial advisor network in the nation
by number of advisors, as well as a leading provider of retail services to the investment programs of banks and credit unions.
Through its multiple distinct firms, Cetera offers independent and institutions-based advisors the benefits of a large, established
broker-dealer and registered investment adviser, while serving advisors and institutions in a way that is customized to their
needs, thus providing a personalized experience for their clients. Among the award-winning advisor support resources offered
through Cetera are wealth management and advisory platforms, comprehensive broker-dealer and registered investment adviser
services, practice management support and innovative technology. For more information, visit cetera.com.
“Cetera Financial Group” refers to the network of independent retail firms encompassing, among others, Cetera Advisors LLC,
Cetera Advisor Networks LLC, Cetera Investment Services LLC (marketed as Cetera Financial Institutions or Cetera Investors),
Cetera Financial Specialists LLC, and First Allied Securities, Inc. All firms are members FINRA / SIPC.
page 22Disclosures (cont.)
The material contained in this document was authored by and is the property of Cetera Investment Management LLC. Cetera
Investment Management provides investment management and advisory services to a number of programs sponsored by affiliated
and non-affiliated registered investment advisers. Your registered representative or investment adviser representative is not registered
with Cetera Investment Management and did not take part in the creation of this material. He or she may not be able to offer Cetera
Investment Management portfolio management services.
Nothing in this presentation should be construed as offering or disseminating specific investment, tax, or legal advice to any individual
without the benefit of direct and specific consultation with an investment adviser representative authorized to offer Cetera Investment
Management services. Information contained herein shall not constitute an offer or a solicitation of any services. Past performance is
not a guarantee of future results.
For more information about Cetera Investment Management strategies and available advisory programs, please reference the Cetera
Investment Management LLC Form ADV disclosure brochure and the disclosure brochure for the registered investment adviser your
adviser is registered with. Please consult with your adviser for his or her specific firm registrations and programs available.
No independent analysis has been performed and the material should not be construed as investment advice. Investment decisions
should not be based on this material since the information contained here is a singular update, and prudent investment decisions
require the analysis of a much broader collection of facts and context. All information is believed to be from reliable sources; however,
we make no representation as to its completeness or accuracy. The opinions expressed are as of the date published and may change
without notice. Any forward-looking statements are based on assumptions, may not materialize, and are subject to revision.
All economic and performance information is historical and not indicative of future results. The market indices discussed are not
actively managed. Investors cannot directly invest in unmanaged indices. Please consult your financial advisor for more information.
Additional risks are associated with international investing, such as currency fluctuations, political and economic instability, and
differences in accounting standards. Emerging markets involve heightened risks related to the same factors as well as increased
volatility and lower trading volume.
page 23Definitions
The Recession Riskometer is the average reading of ten economic indicators – Unemployment, ISM Manufacturing and Non-
Manufacturing Indexes, Industrial Production Growth, Building Permits Growth, Temporary Staffing Employment Growth, Real
Retail Sales Growth, Consumer Confidence as measured by the University of Michigan, Philadelphia Federal Reserve’s Leading
Indicator for the U.S. Index, as well as the difference between 10- and 2-year Treasury rates.
The Economic Trend Signal measures the average of whether each of the ten indicators in the Recession Riskometer are
improving, neutral or declining in their most recent reading as compared to historical data.
The U3 Unemployment Rate measures the percentage of people without jobs who are actively seeking work. This is often the
officially quoted unemployment rate. The U6 Unemployment Rate expands the definition of U3 by including "discouraged
workers", or those who have stopped looking for work because current economic conditions make them believe that no work is
available for them, other "marginally attached workers", or those who would like and are able to work, but have not looked for work
recently, as well as part-time workers who want to work full-time, but cannot due to economic reasons.
The ISM Manufacturing Index is based on surveys of over 400 manufacturing firms across 20 industries by the Institute of Supply
Management. Equal weight is given to responses in five areas - new orders, production, supplier deliveries, employment and
inventories. Generally, a reading over 50 indicates expansion, and a reading in the low 40's suggests recessionary conditions.
Changes in the index are also helpful in gauging the direction of economic growth.
The ISM Non-Manufacturing Index is based on surveys of over 350 non-manufacturing firms in 17 industries representing over
80% of the U.S. economy by the Institute of Supply Management. The survey shows the percentage of managers reporting higher
activity, lower activity or no change in the following areas: business activity, new orders, employment, supplier deliveries, backlog
of orders, new export orders, inventory change, inventory sentiment, imports, and prices.
Industrial Production and Capacity Utilization is measured monthly by the United States Federal Reserve, based on hours worked
by industrial-sector employees. The report shows total amount of US industrial production as a percentage compared to a
baseline year. It also offers percentage changes from month to month and year to year, and a breakdown of production by industry
grouping.
Building Permits are a measure of the issuance of permits to build new housing units (single and multi-family units). Building
Permits Growth is a measure of the total year-over-year percentage change of the 3-month average of building permits. This
indicator leads housing construction and provides a signal for potential weakness in the housing sector when it is declining.
page 24Definitions (cont.)
The US Bureau of Labor Statistics surveys the temporary staffing industry is surveyed in its Professional and Business Services.
They produce a report on Temporary Help Employment - changes in this figure are often used as a predictor of changes in future
employment. Changes in Temporary Help Employment is a coincident economic indicator.
Real Retail Sales Growth is a measure of the total year-over-year change in retail and food sales adjusted for inflation using the
Consumer Price Index. Real Retail Sales figures provided are the year-over-year change of the 3-month average. By neutralizing the
impact of inflation, the year-over-year change in retail and food sales provides a better view into consumer spending strength because
growth in this figure indicates stronger demand without the impact of rising prices. Real Retail and Food Sales typically decline
heading into recession, and a weaker read is a concern for the economy.
The University of Michigan Consumer Sentiment Index is survey of consumer confidence conducted via telephone surveys to gather
information on consumer expectations regarding the overall economy.
The Philly Fed U.S. Leading Index is a composite index of several U.S. economic indicators that lead the economy including housing
permits, initial unemployment insurance claims, and Treasury yield spreads. This index is often used as a proxy to gauge where the
economy is heading over the next several months because it measures the strength of leading indicators. The Leading U.S. Index
historically has declined into negative territory during recessions and rises back into positive territory during expansions.
The difference (spread) between the yields of the 10-Year and 2-Year maturity Treasury bonds. Often referred to as the 10-Year/2-
Year spread, this metric is one of the early and reliable predictors of recession. Under normal conditions the 10-Year/2-Year spread is
positive, as investors demand higher risk premium for longer -term bonds. Spreads are usually wider early in an economic recovery
and narrow as growth sets in. As recession becomes more likely, spreads tend to move toward zero or turn negative - this occurs
because in periods when economic growth slows inflation decreases and demand for credit declines, pushing long term rates lower.
A Price/Earnings (P/E) ratio is a measure for equity analysis. It is calculated by dividing the current market price of a stock by its
earning per share.
A Price/Book (P/B) ratio is a measure for equity analysis. It is calculated by dividing the current market price of a stock by the most
recent book value per share.
The yield curve is a graphical representation of several yields or interest rates across different bond maturities. Typical maturities
include 3-month, 6-month, 1-year, 2-year, 5-year, 10-year and 30-year.
The High-Yield - US Treasury spread is the percentage difference in current yields of various classes of high-yield bonds compared
against U.S. Treasury bonds.
page 25Definitions (cont.)
Percentile is a method of ranking a metric versus its history by measuring the percentage of group observations equal to or lower than
it. As an example, if a metric scores in the 80th percentile, it is greater than 80% of all other group observations over the stated time
period and lower than 20% of the group observations.
Standard deviation is a statistical method used to gauge asset risk based on measuring the dispersion in returns relative to the
average over a specified period of time.
The Global Industry Classification Standard (GICS) is a classification system for equities, it is used by various equity indexes to
classify domestic and international stocks and breaks equites down to 11 sectors, which Morningstar breaks down into three groups
as described below. Stocks in Energy, Industrials, Information Technology and Telecommunication Services are classified as
Sensitive. Consumer Discretionary, Financials and Materials are defined as Cyclical, and Consumer Staples, Health Care and Utilities
are classified as Defensive.
Sensitive - The sensitive super sector includes industries which ebb and flow with the overall economy, but not severely so. Sensitive
industries fall between the defensive and cyclical industries as they are not immune to a poor economy but they also may not be as
severely impacted by a poor economy as industries in the cyclical super sector. In general, the stocks in these industries move closely
to the direction of the economy.
Cyclical - The cyclical super sector includes industries significantly impacted by economic shifts. When the economy is prosperous
these industries tend to expand and when the economy is in a downturn these industries tend to shrink. In general, the stocks in these
industries expand faster when the economy is growing and also contract faster in a recession.
Defensive - The defensive super sector includes industries that are relatively immune to economic cycles. These industries provide
services that consumers require in both good and bad times, such as healthcare and utilities. In general, the stocks in these industries
are not very sensitive to the direction of the economy.
A drawdown is a measure of the decline from a peak point for an investment or an index. It is typically quoted for a specified period of
time, and measured as the percentage between the peak and the subsequent trough in value. The duration of a drawdown indicates
the time elapsed before the investment returns to the starting peak value.
A simple moving average of an investment or an index calculates its average price for a set period to the most recent price. The
moving average is updated each successive period by deleting the price from the earliest date and adding the newly available most
recent price. The result is a trend line for price movements, which may be an indicator of market sentiment. Generally, if the moving
average is trending higher and the investment or index price rises above the moving average, sentiment is considered to be bullish, as
prices are likely to continue higher, and it may be a good time to buy. If the moving average trend slopes downward, and the
investment price is below the moving average, this may be a bearish, or sell signal, as prices may continue to move down.
page 26Index Definitions
The S&P 500 is an index of 500 stocks chosen for market size, liquidity and industry grouping (among other factors) designed to
be a leading indicator of U.S. equities and is meant to reflect the risk/return characteristics of the large cap universe.
The S&P Growth Index is a float adjusted, market capitalization weighted index of 317 stocks drawn from the S&P 500 Index that
exhibit strong growth characteristics. S&P Dow Jones Indexes uses three factors to measure growth: sales growth, the ratio of
earnings change to price, and momentum.
The S&P Value Index is a float adjusted, market capitalization weighted index of 364 stocks drawn from the S&P 500 Index that
exhibit strong value characteristics. S&P Dow Jones Indexes uses three factors to measure value: the ratios of book value,
earnings and the sales to price sales metric.
The S&P MidCap 400 provides investors with a benchmark for mid-sized companies. The index, which is distinct from the large-
cap S&P 500®, measures the performance of 400 mid-sized companies, representing more than 7% of available market cap.
The S&P MidCap 400 Growth Index represents the growth companies of the S&P MidCap 400 Index which itself is composed of
mid-cap stocks from the broad U.S. equity market. Growth companies are identified by three factors: book value to price ratio,
earnings to price ratio, and sales to price ratio.
The S&P MidCap 400 Value Index represents the value companies of the S&P MidCap 400 Index which itself is composed of mid-
cap stocks from the broad U.S. equity market. Value companies are identified by three factors: book value to price ratio, earnings
to price ratio, and sales to price ratio.
The S&P SmallCap 600 measures the small-cap segment of the U.S. equity market. Introduced in 1994, the index is designed to
track the performance of 600 small-size companies in the U.S, reflecting this market segment’s distinctive risk and return
characteristics. The index measures a segment of the market that is typically known for less liquidity and potentially less financial
stability than large-caps, the index was constructed to be an efficient benchmark composed of small-cap companies that meet
investability and financial viability criteria.
page 27Index Definitions (cont.)
The S&P SmallCap 600 Growth Index represents the growth companies of the S&P S&P SmallCap 600 Index which itself is
composed of small cap stocks from the broad U.S. equity market. Growth companies are identified by three factors: book
value to price ratio, earnings to price ratio, and sales to price ratio.
The S&P SmallCap 600 Value Index represents the value companies of the S&P SmallCap 600 Index which itself is
composed of small-cap stocks from the broad U.S. equity market. Value companies are identified by three factors: book value
to price ratio, earnings to price ratio, and sales to price ratio.
The MSCI EAFE is designed to measure the equity market performance of developed markets (Europe, Australasia, Far
East) excluding the U.S. and Canada. The Index is market-capitalization weighted.
The MSCI EAFE Growth index represents large and mid-cap securities exhibiting overall growth style characteristics across
Developed Markets countries around the world, excluding the U.S. and Canada.
The MSCI EAFE Value index represents large and-mid cap securities exhibiting overall value style characteristics across
Developed Markets countries around the world, excluding the U.S. and Canada.
The MSCI Emerging Markets is designed to measure equity market performance in global emerging markets. It is a float-
adjusted market capitalization index.
The MSCI Europe Index is a free float-adjusted market capitalization index that is designed to measure developed market
equity performance in Europe.
The MSCI Pacific Index captures large and mid-cap representation across five Developed Markets (DM) countries in the
Pacific region. With 470 constituents, the index covers approximately 85% of the free float-adjusted market capitalization in
each country.
page 28Index Definitions (cont.)
The MSCI ACWI is a free float‐adjusted market capitalization weighted index that is designed to measure the equity market
performance of developed and emerging markets. The MSCI ACWI consists of 46 country indexes comprising 23 developed and
23 emerging market country indexes. The developed market country indexes included are: Australia, Austria, Belgium, Canada,
Denmark, Finland, France, Germany, Hong Kong, Ireland, Israel, Italy, Japan, Netherlands, New Zealand, Norway, Portugal,
Singapore, Spain, Sweden, Switzerland, the United Kingdom and the United States. The emerging market country indexes
included are: Brazil, Chile, China, Colombia, Czech Republic, Egypt, Greece, Hungary, India, Indonesia, Korea, Malaysia, Mexico,
Peru, Philippines, Poland, Qatar, Russia, South Africa, Taiwan, Thailand, Turkey and United Arab Emirates.
The S&P 500® Consumer Discretionary Index comprises those companies included in the S&P 500 that are classified as
members of the GICS® Consumer Discretionary sector.
The S&P 500® Consumer Staples Index comprises those companies included in the S&P 500 that are classified as members of
the GICS® Consumer Staples sector.
The S&P 500® Energy Index comprises those companies included in the S&P 500 that are classified as members of the GICS®
Energy sector.
The S&P 500® Financials Index comprises those companies included in the S&P 500 that are classified as members of the
GICS® Financials sector.
The S&P 500® Health Care Index comprises those companies included in the S&P 500 that are classified as members of the
GICS® Health Care sector.
The S&P 500® Industrials Index comprises those companies included in the S&P 500 that are classified as members of the
GICS® Industrials sector.
The S&P 500® Information Technology Index comprises those companies included in the S&P 500 that are classified as members
of the GICS® Information Technology sector.
page 29Index Definitions (cont.)
The S&P 500® Materials Index comprises those companies included in the S&P 500 that are classified as members of the GICS®
Materials sector.
The S&P 500® Real Estate Index comprises those companies included in the S&P 500 that are classified as members of the GICS®
Real Estate sector.
The S&P 500® Telecommunication Services Index comprises those companies included in the S&P 500 that are classified as
members of the GICS® Telecommunication Services sector.
The S&P 500® Utilities Index comprises those companies included in the S&P 500 that are classified as members of the GICS®
Utilities sector.
The Bank of America Merrill Lynch U.S. Treasury Bill 3 Month index measures the performance of a single issue of outstanding
treasury bill which matures closest to, but not beyond, three months from the rebalancing date. The issue is purchased at the beginning
of the month and held for a full month; at the end of the month that issue is sold and rolled into a newly selected issue.
The Bloomberg Barclays U.S. Treasury: 1-3 Year Index measures the performance of U.S. Treasury securities with remaining
maturities of one to three years.
The Bloomberg Barclays U.S. Treasury: 7-10 Year Index measures the performance of U.S. Treasury securities that have a remaining
maturity of at least seven years and less than 10 years.
The Bloomberg Barclays U.S. Treasury: U.S. TIPS Index includes all publicly issued, U.S. Treasury inflation-protected securities that
have at least one year remaining to maturity, are rated investment grade, and have $250 million or more of outstanding face value.
The Bloomberg Barclays U.S. Municipal Bond Index is an unmanaged, market-value-weighted index of investment-grade municipal
bonds with maturities of one year or more.
The Bloomberg Barclays GNMA Index measures the performance of Government National Mortgage Association (GNMA or “Ginnie
Mae”) bonds. It is a subset of the Bloomberg Barclays U.S. Aggregate index.
page 30Index Definitions (cont.)
The Bloomberg Barclays U.S. Corporate (Investment Grade) Bond Index measures the investment grade, fixed-rate, taxable corporate
bond market. It includes USD-denominated securities publicly issued by U.S. and non-US private-sector industrial, utility and financial
issuers. Certificates of deposit are also included. Launched in July 1973, securities included must be rated investment grade
(Baa3/BBB-/BBB- or higher). Eligible senior and subordinated corporate securities must have at least one year until final maturity, but
in practice the index holdings has a fluctuating average life of around 10.75 years. The index is unhedged and rebalances monthly.
The Bloomberg Barclays U.S. Corporate High-Yield Index measures the market of USD-denominated, non-investment grade, fixed-
rate, taxable corporate bonds. Securities are classified as high-yield if the middle rating of Moody's, Fitch, and S&P is Ba1/BB+/BB+ or
below, excluding emerging market debt.
The Bloomberg Barclays U.S. Aggregate 1-3 Years Index consists of publicly issued investment grade corporate, US Treasury and
government agency securities with remaining maturities of one to three years.
The Bloomberg Barclays Capital U.S. Aggregate Bond Index, which was originally called the Lehman Aggregate Bond Index, is a
broad based flagship benchmark that measures the investment grade, US dollar-denominated, fixed-rate taxable bond market. The
index includes Treasuries, government–related and corporate debt securities, MBS (agency fixed-rate and hybrid ARM pass-throughs),
ABS and CMBS (agency and non-agency) debt securities that are rated at least Baa3 by Moody’s and BBB- by S&P. Taxable
municipals, including Build America bonds and a small amount of foreign bonds traded in U.S. markets are also included. Eligible
bonds must have at least one year until final maturity, but in practice the index holdings has a fluctuating average life of around 8.25
years. This total return index, created in 1986 with history backfilled to January 1, 1976, is unhedged and rebalances monthly.
The Bloomberg Barclays Global Treasury ex U.S. Bond Index consists of those securities included in the Barclays Global Aggregate
Bond Index that are Treasury securities, with the U.S. excluded. The Barclays Global Aggregate Bond Index is comprised of several
other Barclays indexes that measure fixed income performance of regions around the world.
The JP Morgan Emerging Markets Bond Index (EMBI) Global Diversified measures the performance of fix-rate for external-currency
denominated debt instruments including Brady bonds, loans, Eurobonds in emerging markets. Countries covered are Argentina, Brazil,
Bulgaria, Mexico, Morocco, Nigeria, the Philippines, Poland, Russia, and South Africa. It covers more of the eligible instruments than
the EMBI+ by relaxing somewhat the strict EMBI+ limits on secondary market trading liquidity.
page 31Index Definitions (cont.)
The Bloomberg Commodity Index is a broadly diversified index that measures 22 exchange-traded futures on physical commodities in
five groups (energy, agriculture, industrial metals, precious metals, and livestock), which are weighted to account for economic
significance and market liquidity. No single commodity can comprise less than 2% or more than 15% of the index; and no group can
represent more than 33% of the index. However, between rebalancings, group weightings may fluctuate to levels outside the limits. The
index rebalances annually, weighted 2/3 by trading volume and 1/3 by world production.
The Bloomberg Barclays US Treasury 20+ Year index represents the 20+ Year component of the Barclays US Treasury Index.
Included securities must have at least 20 years to final maturity regardless of call features, and least $250 million par amount
outstanding. They must be rated investment grade (Baa3/BBB- or higher) by at least two of the following ratings agencies: Moody's,
S&P, Fitch.
The Dow Jones U.S. Select REIT Index tracks the performance of publicly traded REITs and REIT-like securities and is designed to
serve as a proxy for direct real estate investment, in part by excluding companies whose performance may be driven by factors other
than the value of real estate. The index is a subset of the Dow Jones U.S. Select Real Estate Securities Index (RESI), which represents
equity real estate investment trusts (REITs) and real estate operating companies (REOCs) traded in the U.S.
The S&P GSCI Gold Index, a sub-index of the S&P GSCI, provides investors with a reliable and publicly available benchmark tracking
the COMEX gold future. The index is designed to be tradable, readily accessible to market participants, and cost efficient to implement.
The more widely tracked S&P GSCI index is recognized as a leading measure of general price movements and inflation in the world
economy. The index represents commodity market beta is world-production weighted and is designed to be investable by including the
most liquid commodity futures.
Federal funds rate is the interest banks charge one another when lending reserve balances on an overnight basis. Typically banks with
reserve capital above the minimum required to be held at the Federal Reserve will lend the excess to banks who need to meet
minimums.
Treasury yield is the return on investment of U.S. government's debt obligations. Short-term Treasury bills offer no interest payments
and are issued at discount from face value. The yield of the three-month Treasury bill is the difference between the discount price and
face value, expressed as an annualized percentage rate.
Longer-term Treasury notes are issued for maturities from 1-10 years and offer an interest (or coupon) payment. They may be
purchased at premium or discount from face value. The yield on 1- and 2- year Treasury notes is based on their coupon payment and
face value, adjusted upward if the note was purchased at discount, and downward if the note was purchased at a premium. It is also
expressed as an annualized percentage rate.
page 32Asset Class Indexes
Asset Class Index
US Large Cap S&P 500
US Large Cap Growth S&P 500 Growth
US Large Cap Value S&P 500 Value
US Mid Cap S&P Midcap 400
US Small Cap S&P SmallCap 600
International Developed MSCI EAFE
Emerging Market Equities MSCI Emerging Markets
REITs DJ US Select REIT
Commodities Bloomberg Commodities
Gold S&P GSCI Gold
Intermediate-Term Treasurys Bloomberg Barclays US Treasury 7-10 Yr
Long-Term Treasurys Bloomberg Barclays US Treasury 20+ Yr
TIPS Bloomberg Barclays US Treasury US TIPS
Mortgage-Backed Securities Bloomberg Barclays GNMA
Corporate IG Bonds Bloomberg Barclays US Corporate IG
High Yield Corporate Bonds Bloomberg Barclays US Corporate High Yield
Emerging Market Debt JPM EMBI Global
US Aggregate Bonds Bloomberg Barclays US Aggregate Bond
60-40 Allocation 60% S&P 500, 40% Bloomberg Barclays US Aggregate Bond
page 33Data Sources
Economic Indicator Source
Nonfarm Monthly Payrolls ('000) U.S. Bureau of Labor Statistics
Total Nonfarm Payrolls - YoY Change U.S. Bureau of Labor Statistics
U3 Unemployment Rate U.S. Bureau of Labor Statistics
U6 Unemployment Rate U.S. Bureau of Labor Statistics
Quit Rate U.S. Bureau of Labor Statistics
Job Openings: Total Nonfarm Payroll U.S. Bureau of Labor Statistics
Initial Jobless Claims ('000) 4 Wk. MA - Month End U.S. Employment and Training Administration
KC Fed LMCI Momentum Indicator Federal Reserve Bank of Kansas City
Labor Force Participation Rate U.S. Bureau of Labor Statistics
Employment to Population Ratio U.S. Bureau of Labor Statistics
Temporary Help Employment U.S. Bureau of Labor Statistics
Retail Sales - YoY Change U.S. Bureau of the Census
Vehicle Sales (Mil. Units, annualized) U.S. Bureau of Economic Analysis
Personal Savings Rate U.S. Bureau of Economic Analysis
Real Retail Sales (3MMA) - YoY Change Federal Reserve Bank of St. Louis
Industrial Production - YoY Change Board of Governors of the Federal Reserve System (US)
Capacity Utilization Board of Governors of the Federal Reserve System (US)
Core Capital Goods Orders - YoY Change U.S. Bureau of the Census
Building Permits ('000) U.S. Bureau of the Census
Housing Starts ('000) U.S. Bureau of the Census
page 34Data Sources (cont.)
Economic Indicator Source
New Home Sales U.S. Bureau of the Census
S&P/Case-Shiller Home Price Index (20 city) - YoY Change S&P Dow Jones Indices LLC
Total Construction Spending - YoY Change U.S. Bureau of the Census
ISM Manufacturing Composite PMI Institute for Supply Management
ISM Manufacturing New Orders Institute for Supply Management
ISM Non-Manufacturing Composite PMI Institute for Supply Management
ISM Non-Manufacturing New Orders Institute for Supply Management
U. of Michigan Consumer Sentiment University of Michigan
Consumer Price Index (CPI) - YoY Change U.S. Bureau of Labor Statistics
Personal Consumption Expenditure (PCE) - YoY Change U.S. Bureau of Economic Analysis
Producer Price Index (PPI) - YoY Change U.S. Bureau of Labor Statistics
Average Hourly Earnings - YoY Change U.S. Bureau of Labor Statistics
Real GDP – QoQ (SAAR) U.S. Bureau of Economic Analysis
Real GDP – YoY Change U.S. Bureau of Economic Analysis
Treasury Yield Curve (10-Yr. Minus 2-Yr.) Federal Reserve Bank of St. Louis
Philly Fed Leading U.S. Index Federal Reserve Bank of Philadelphia
page 35You can also read