Year in Search - India: Insights for Brands - What Google Search told us about consumer behavior online - Think with Google
←
→
Page content transcription
If your browser does not render page correctly, please read the page content below
Year in Search - India:
Insights for Brands

What Google Search told us about consumer behavior online

Year in Search - India:
Insights for Brands

https://bit.ly/2GZb8tI

                          2
India is coming online
                   at an unprecedented rate

350M                                                           400M
connected                                                      active internet users;
smartphone users                                               2nd highest in the world

40M                                                            8 GB / month
The average yearly                                             The average mobile data
addition of users; among                                       usage per subscriber,
the fastest in the world                                       which has reached levels of
                                                               developed markets

Sources: Bain & Company - Unlocking Digital for Bharat, 2018                                 3
Top 5
country
trends

Bharat is
going online
Searches in non-metros
are growing faster
than the metros across
categories through
smartphones

                         Video: An
                         unprecedented
                         growth story
                         Online video is reshaping
                         the way consumers gather
                         information and make
                         purchase decisions
                                                     4
Top 5 Country Trends

                       Indic languages
                       and voice
                       Indian internet users are
                       fast adopting this search
                       tool and finding comfort in
                       regional language

Omnichannel
Online and offline are coming
together to fulfill customer
needs and helping businesses
maximize their potential

                       Assisting
                       businesses
                       AI and machine
                       learning are assisting
                       businesses to enhance
                       customer experience
                       and improve ROI
                                                           5
Bharat
is going online
Non-metros2 are driving
growth across all categories

With growing connectivity, the rise in searches from non-metro cities
across categories is faster than that of the metros1.
The online space in India has never been this vibrant. From driving search volumes
in auto to the rise of personal beauty related queries, consumers across different
regions of Bharat are becoming the engines of growth. They are no longer seeking
cues from the metros, and are setting their own trends.

Source: Google Internal Data, 2017-18                                            6
Bharat is going online

                                        55%
         The internet has become
         the bridge to Bharat’s3
         aspirations.
                                        of all car-related
         Consumers in non-metros        searches come from
         are searching for products     non-metro2 cities
         related to international
         travel destinations,
         beauty, and life insurance
         more frequently than
         their counterparts in the
         metros1. They are no longer
                                        61%
                                        of all searches
         restricted by the lack of      across personal loans,
         information or access          health insurance, life
         to technology.                 insurance, and mutual
                                        funds come from Bharat

                                        49%
                                        rise in face powder
                                        searches from Rajasthan

                                        Interest in destination
                                        discovery, destination
                                        activities, and international
                                        travel is much higher
                                        in non-metros than
                                        in tier 1 cities

Source: Google Internal Data, 2017-18                                    7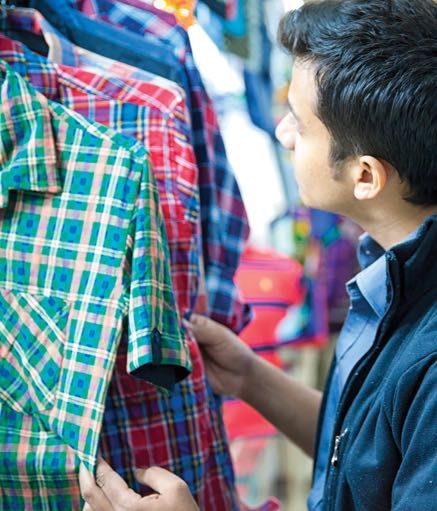
Video: An unprecedented
growth story

Online video audience in                                            About 1/3rd of all searches for
                                                                    online video are entertainment
India is expected to grow
                                                                    related
to 500 million by 2020
There is growing interest in audio-visual                           Other categories like lifestyle,
content across verticals, as watchtime                              education and business have
on mobile phones rises rapidly                                      shown 1.5x - 3x growth in the
                                                                    last 2 years

Sources: KPMG Report: Re-imagining India's M&E Sector, March 2018
Google- Kantar TNS Gearshift 2018 Report
Google Internal Data, January - November, 2018                                                         8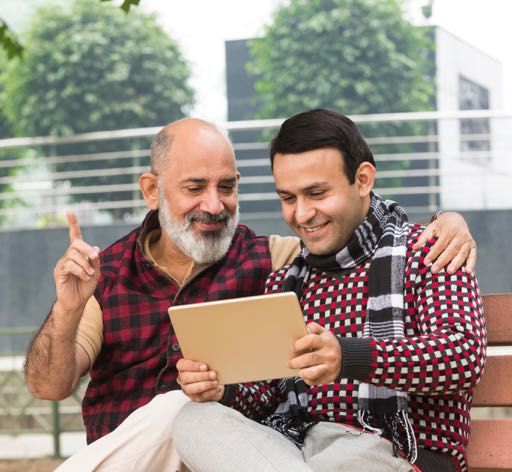
Video: The new search tool

                                                             Online video
                                                             is reshaping
                                                             the way
                                                             consumers gather
                                                             information and
                                                             make purchase
                                                             decisions

                                                         It is playing a big role in the
                                                         car-buying path to purchase,
                                                         with 80% of car buyers using it
                                                         as a research destination

                                                         More than 55% of shoppers
                                                         say that they used online video
                                                         while actually shopping in store

Sources: KPMG Report - Re-imagining India's M&E Sector
Google- Kantar TNS Gearshift 2018 Report
Google Internal Data, January - November, 2018                                                   9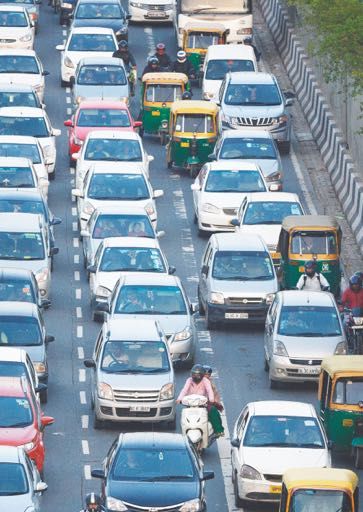
Indic languages
and voice
The rise of the                                  9 out of 10 new Internet users in India
non-English user                                 are likely to be Indian language users

          Voice search is becoming mainstream

          The country has
          seen 270% growth
          year-on-year in
          voice searches

          Consumers across
          categories are fast
          adapting to this new
          search tool for seeking
          information and
          discovering content

Source: Indian Languages - Defining India's Internet,
A Study by KPMG in India and Google, April 2017                                            10
Omnichannel: The growing confluence of online and offline The rise of omnichannel is enabling consumers to make the most of their online and offline experiences. 50% of organized retail is likely to be influenced by digital in 2020 75% YoY growth in "near me" queries Sources: Digital Retail in 2020: Rewriting the Rules, A Google-A.T. Kearney Study, 2016 Google Internal Data, January - December, 2018 11
Omnichannel

There has been a steep
rise in searches for food                                   2.5X
aggregator brands as                                        jump in aggregator brand
people are increasingly                                     queries in comparison to the
                                                            total growth of food tech queries
relying on apps to look
for dining out and food
delivery options                                            88%
                                                            increase in "near me"
                                                            searches for telecom stores

Sources: Consumer Barometer 2017-18, Google Internal Data                                    12
Assisting businesses The ascent of online automation Artificial Intelligence Brands across various categories, (AI) and Machine such as CPG and travel, have Learning are helping started integrating voice businesses simplify assistants with their customer processes and service to help customers improve efficiency Sources: Think with Google: Building the Google Assistant on phones for everyone, everywhere, 2019 Google Internal Data, IN, January - December 2018 13
Digitising businesses

ML and AI assist users
and businesses alike

7X
increase in number of active
users for Assistant in India

2X
GSK's Otrivin doubled sales and
achieved 2X CTR as compared to
the industry benchmarks by using
data driven solutions to run real
time weather based campaigns

         Brands like Uber, Ola and
         Meru made cab booking
         services available on
         Google Assistant. The
         users can simply tap
         on the desired ride and
         confirm the booking

Sources: The Keyword: Building the Google Assistant on phones for everyone, everywhere, February 2019
Think With Google, Cloudy with a chance of sales: What weather-based marketing means for brands in India, 2019         14
Year in Search - India : Insights for Brands
Table
of Contents
Auto 17
Banking and Finance 28
Consumer Packaged Goods 35
E-Commerce 46
Retail 57
Education 59
Local and Classifieds 64
Media and Entertainment 69
Telecom and Payments 73
Technology 81
Travel 8717
Auto
Year in Search - India : Insights for BrandsAuto
People are
increasingly
relying on 40%
Search for their increase in the volume
of commercial vehicle-
vehicle purchase related searches
decisions
45%
rise in commuter
bike segment searches,
with more than 60%
queries coming from
non-metro2 cities
70%
jump in searches
around used car
research
40%
increase in
used car loan
searches
Source: Google Internal Data, January - November, 2018 18Auto
When it comes to auto,
consumers have a whole
range of search queries
64% YoY growth
in queries related
to Servicing
89% YoY growth
in queries related
to Car Insurance
55%
of all cars-related
searches come from
non-metro2 cities,
which is greater than
the volume of queries
from tier 11 cities
Source: Google Internal Data, January - December, 2018 19Auto Consumers are now relying more on online research, immersive experiences, and online bookings than test drives and showroom walk-ins 90% of car buyers research online before setting foot into a dealership And once they’re at the dealership, 65% of car buyers will continue to do research on their smartphones Average walk-ins per buyer have fallen to 2 per purchase from 4 in the last 3 years Which means that consumers are more informed than ever when they enter a dealership — and that more and more walk-ins are being driven by digital Sources: Google- Kantar TNS Gearshift 2018 Report 20
Auto

Maruti Suzuki                                       Royal Enfield
One of India's leading car                          The iconic two-wheeler
maker built the auto sector's                       brand created a unique
first integration with Google                       Actions on Google
Assistant for the 2018                              integration for the launch
Auto Expo to help users                             of its Interceptor and
learn about new launches,                           Continental GT650 bikes.
Auto Expo details, and other                        Users were encouraged
relevant information.                               to discover the price of
It helped create a seamless                         the products
experience for users

Sources: Maruti Suzuki - External Case Study 2018
Royal Enfield - External Case Study 2018                                           21
Auto

56%
of all users visited
a dealer website
during their car
purchase journey,
making it the third
biggest online
touchpoint

60%
of all buyers
find dealers online

400%
growth for "dealer
near me" searches

Sources: Google Internal Data, January - November, 2018     22
Auto

Digital solves for business metrics
like calls to dealers and walk-ins
Digital now drives incremental qualified leads at most
efficient cost per lead (CPL) for large OEMs5 across Auto.
It helped Renault garner 23% more qualified leads and
reduced cost per lead by 19%.

                                                             12:00

        “We wanted to understand if digital has
         the same impact as print in driving leads
         for our dealerships. Google helped us
         pilot an experiment by developing a
         customised solution to drive qualified
         calls directly to our dealerships.

         The campaign has shown brilliant results
         and we’re planning to scale it further in
        “the coming months.

         Virat Khullar
         VP & Head of Marketing,
         Renault India

Sources: Renault and Ford, Google External Case Study            23
Auto
Before visiting a dealership,
many buyers research online
41%
of them look
for maintenance
programs
32%
look for reviews &
recommendations
35%
look for dealer
location / directions
to the dealership
37%
look for promotional
offers and deals
Sources: Google- Kantar TNS Gearshift 2018 Report 24Auto YouTube has become one of the most important sources of independent information for car buyers 79% 81% of the buyers who watch of them agree that they find car videos on YouTube independent and credible use it to find information auto videos on YouTube Source: Autogearshift 2018 25
Auto

Video growth in auto

79%                                      45% 27%
of auto buyers                           of new car buyers   of new car buyers
find answers and                         viewed videos       watched videos
reviews on Youtube                       regarding feature   regarding vehicle
before purchasing                        highlights          performance before
                                                             making a purchase

Sources: Google- Kantar TNS Gearshift 2018 Report
Google Internal Data, January - November, 2018,
Google IN Data, 2018                                                          26
Auto
87%
of those who
watched online
videos took
at least one
follow-up action
52%
visited a dealer’s
website
48%
located
a dealer
45%
scheduled
a test ride
Source: Google- Kantar TNS Gearshift 2018 Report 2728
Banking,
and Insurance
Financial Services,
Year in Search - India : Insights for BrandsBFSI
Bharat is rising
There is massive interest in
life and health insurance, from
users outside the Top 8 cities1
Life Insurance
Consumers across non-metros 2
are also very interested in 61%
personal loans & mutual funds of all life insurance related
queries are from Bharat,
a growth of 43% YoY
Health Insurance
59%
of all health insurance
related searches come from
Bharat, a growth of 78% YoY
Mutual Funds
59%
of all mutual fund related
queries are from Bharat3,
growing at 61%
Personal Loans
57%
of all personal loan queries
are from Bharat3; a growth
rate of 109%
Source: Google Internal Data, January - September, 2018 29BFSI
A majority of BFSI-related
searches are on mobile
% of searches growth of
on mobile mobile queries
Health Insurance 67% 121%
Life Insurance 62% 73%
Personal Loans 75% 122%
Mutual Funds 60% 75%
Source: Google Internal Data, January - September, 2018 30BFSI
Accelerated Mobile Pages (AMP)
are driving acquisition
Businesses are using WEB
AMP to make their
processes more
efficient and improve
online acquisition
on mobile
“
“
The new wave of users from non-metros searches
heavily and only on mobile. Delivering a simple and quick
experience is key for engagement. We achieved over
60% improvement in load time and over 10% incremental
conversion in Search ads by implementing AMP.
Jagmal Singh
CTO, PaisaBazaar
Source: Paisabazaar External Case Study 2018 31BFSI AI is helping companies acquire and manage customers Businesses are now making their services available on voice activated assistants 270% growth in voice searches across India Source: India Mobile Broadband Index 2018 Report - Nokia 32
BFSI

BFSI brands are offering a smoother
customer experience with the help
of Google Assistant

Paisabazaar                                          HDFC Bank
made their credit                                    became one of the first mov-
score facility available                             ers in the space of voice chat
on Google Assistant,                                 after it linked its chatbot EVA
offering a convenient                                (Electronic Virtual Assistant)
solution for consumers                               with Google Assistant to
to interact and transact.                            offer its services on mobile.

SBI Mutual Funds
became the first
mutual fund player
to launch a voice as-
sistant to help investors
find product-related
information, locate
branches, and check
                                                          Hi, how can I help?
KYC status.

Sources: Paisabazaar Press Statement, October 2018
Enterprise World, December 2018
Financial Express, January 2018                                                         33
BFSI
Machine learning
is helping brands
grow efficiently
Google’s Smart Bidding
built on machine learning 2x
has helped customers increase in incremental
scale across personal loans
improve efficiency in their and credit cards for Bank-
marketing efforts on Search. Bazaar, who used Smart
Bidding
71%
Smart Bidding capability has
also come to video marketing on
YouTube, where consumers can
now bid on campaigns based on increase in leads for ICICI
Prudential Life Insurance
final conversions. Earlier consumers after they started using the
could only bid based on views / new YouTube format:
impressions TrueView for Action
Sources: ICICI Pru Life External Case Study
Google - BankBazaar External Case Study 3435
Consumer
Packaged Goods
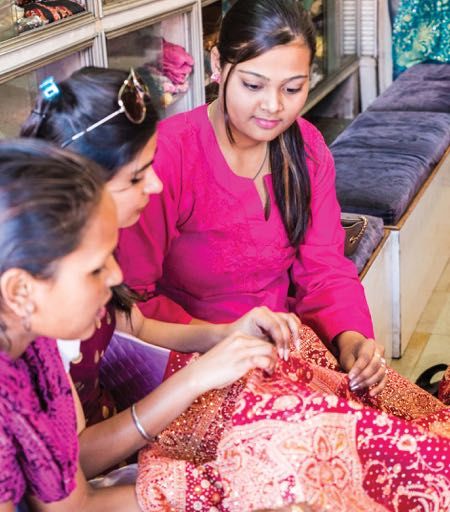
Year in Search - India : Insights for BrandsConsumer Packaged Goods
Search has become
the go-to source for beauty
YouTube too, is emerging Watch time for Beauty Tips
as the new beauty advisor videos in India doubled YoY in 2018
Highest searches in
the category are related to:
40% Hair care 50%
growth in Skin care 30%
searches related
to beauty Makeup 20%
Source: Google Internal Data, December 2017- November 2018
Youtube Internal Search data 36Consumer Packaged Goods
“
Regional language4 support
is enabling millions of women
across India look for beauty tips
By introducing vernacular search on
ENO, not only did we get 40% lower
Top 3 Indic beauty searches are CPCs, we got a step closer to the
consumer in her experience journey.
मेहंदी
Puneet Gulati
Head - Digital Marketing and Media,
हेयर स्टाइल “
GSK Consumer Healthcare India
मेकअप
Source: Google Internal Data, December 2017- November 2018 37Consumer Packaged Goods
Winning across
many Indias hair colour
face powder
hairstyle
damaged hair
hair loss
makeup foundation
In comparison to the
rest of India, there is:
1.2X 1.1X
more interest in hair loss higher curiosity about damaged
queries in Karnataka hair queries in West Bengal
1.5X 1.2X
greater interest in face powder more curiosity about makeup
queries in Rajasthan foundation searches in Tamil Nadu
Source: Google Internal Data, December 2017- November 2018 38Consumer Packaged Goods
Interest in beauty
categories varies greatly
across Indian states
1 in 3
lip care-related searches
come from Maharashtra,
Karnataka, and Tamil Nadu
1 in 4
skincare searches
come from Maharashtra
and Karnataka
The level of interest
in makeup shown by
people in Uttar Pradesh
is similar to that of Tamil
Nadu and Karnataka
Source: Google Internal Data, December 2017- November 2018 39Consumer Packaged Goods
Consumers want to know
more & "do it yourself (DIY)"
In India,
the birthplace of
Ayurvedic medicine,
2.5X
there is: higher search volume for
natural ingredients than
for scientific ingredients.
Source: Google Internal Data, October 2017- September 2018 40Consumer Packaged Goods
Consumers are increasingly
researching product ingredients to
develop DIY solutions for personal care
Top 5 "how to"
searches
How to make lipstick
How to make lip balm
How to make aloe vera gel
How to make soap
How to make cream at home
Source: YouTube Internal Search Data, 2017-2018 41Consumer Packaged Goods
There is
a rising influence
of international 85%
beauty trends rise in
beer shampoo
in India searches
Rising aspirations coupled
with increased exposure and 50%
access is driving the growth increase in
of international beauty beard oil
trends in India searches
30%
growth in
face mask
searches
Top Korea beauty-related searches
Korean makeup
80%
growth in searches
Korean beauty care routine related to Korean
beauty brands
Korean hairstyle
Korean beauty secrets
Source: Google Internal Data, December 2017- November 2018 42Consumer Packaged Goods
Indian consumers are
adopting the latest trends
in health consciousness
Keto diet
has become the most
popular diet ahead of
low carb and GM diets
Significant growth
in queries for:
Protein bars 40%
Sugar-free 50%
Gluten-free 37%
Source: Google Internal Data, December 2017- November 2018 43Consumer Packaged Goods
Rise of low involvement categories
Search volumes of these categories are
growing faster than the overall CPG industry
40%
increase in home
50%
rise in oral care
care searches searches
Source: Google Internal Data, December 2017- November 2018 44Consumer Packaged Goods
Consumers are increasingly looking to
YouTube for cleaning solutions
Top 5 searches How to clean your room
How to clean gas stove burners
How to clean iron
How to clean washing machine
How to clean microwave
Source: YouTube Internal Search Data, 2017-2018 4546
E-Commerce
Year in Search - India : Insights for BrandsE-Commerce
India influencing
research and intent
Indic4 queries are growing faster than English in
e-commerce categories like clothing, beauty,
and personal care
Growth in Growth in
Hindi searches English searches
Clothing 178% 33%
Beauty and personal care 174% 28%
Source: Google Internal Data, January - October, 2018 47E-Commerce Fashion, a dynamic and ever growing e-commerce category Over 70% of all fashion searches come from two categories: Clothing Beauty and personal care Source: Google Internal Data, January - October, 2018 48
E-Commerce

                                                        "how to" searches in skincare
                                                        relate to concerns like:

                                                               Dark circles

                                                               Acne

                                                               Fairness

                                                               Blackheads

                                                               Tan

                                                        Rising trends in
                                                        beauty and personal
                                                        care revolve around:

Consumers in the beauty                                 Wants:
and personal care category                              Long hair
are increasingly turning to
                                                        Searches for tips to growing
Search for research and
                                                        long hair and hair products
to seek solutions to their
questions and concerns
                                                        Concerns:
                                                        Fairness, hair fall
                                                        Searches for hacks
                                                        and products

Source: Google Internal Data, January - October, 2018                                      49
E-Commerce
Seasonal trends can be seen
for dress related searches in
the Women's clothing category
over
55% Celebrity weddings
in India influence how
of all dress-related searches Indian consumers
revolved around the term search online
black; making it the top colour
of the last quarter of 2018 Deepika Padukone’s
wedding wear was
searched 4x more than
Velvet was the most searched for that of Priyanka Chopra
material of the season, followed by
Silk, Cotton, Lace, Georgette,
Chiffon, Denim, and Satin
Source: Google Internal Data, October - December, 2018 50E-Commerce
Dresses
and sarees 40%
are the most of all western wear
searched searches are for dresses
for items
by women
in the clothing 21%
category of all ethnic wear clothing
searches are for sarees
India searches for
sarees differently
across regions/states
plus size clothing
is an emerging category
with 62% growth
WIP
map india
laxmipati sarees
kanjeevaram sarees
jimikki kammal sarees
Source: Google Internal Data, January - October, 2018 51E-Commerce Men's clothing searches are more brand centric, than women's clothing searches over 25% of all top searches are for brands over 30% of all searches are for shirts 60-70% of all searches are for spe- cific items of clothing and not designs or suggestions, a trend more common with women's clothing queries. Source: Google Internal Data, October - December, 2018 52
E-Commerce

                                                   Accessories
                                                   is the fastest
                                                   growing category
                                                   in fashion with
                                                   over 150% increase
                                                   in searches

                                                   Bags and eyewear
                                                   are the two largest
                                                   categories in accessories

60%                                               2.6X
of all accessories                                 more eyewear
searches are for bags                              searches for men
                                                   than for women

1 in 3                                            2.3X
eyewear searches                                   more searches
are for sunglasses                                 for aviators than
and goggles                                        for wayfarers

Source: Google Internal Data, October - December, 2018                          53
E-Commerce Online Gifting How Indian consumers are gifting The concept of gifting is becoming more personalised Consumers turn to Search to look specifically for ideas and inspiration around: Customised gifts Unique gifts Handmade gifts Best gifts Surprise gifts Source: Google Internal Data, January - October, 2018 54
E-Commerce

                                                        Personal relationships
                                                        drive gifting behaviour

During festivals
like Diwali, Rakhi,                                     Spouse/Partner                            34%
and Christmas,
people search                                           Men                                        27%
heavily for "near
me" stores and                                          Women                                     20%
"delivery" options

                                                                        All percentages represent YoY growth

over
111%
growth in "near me"
searches related to gifting

Popular gifting-
related searches:

     Greeting cards
     Flower arrangements
     Fruit gifts
     Gift baskets

Source: Google Internal Data, January - October, 2018                                                    55
E-Commerce
Video is becoming the
new research tool for consumers
Consumers are increasingly using videos while
researching and before making a purchase
More than 55% of shoppers say that they used
online video while actually shopping in store.
“
“
YouTube drove performance as well as branding goals for
Ferns N Petals with a 25% growth in traffic to our website
and a whopping 230% brand uplift.
Sai Tota
Head, Digital Marketing,
Ferns N Petals Pvt. Ltd.
Source: Google Internal Data, January - October, 2018 5657
Retail
Year in Search - India : Insights for BrandsRetail
The influence of omnichannel
is highly visible in retail
50%
of organized retail
to be influenced by
Digital in 2020
75%
YoY growth in
"near me" queries
“
“
Search trends have really helped Future Group know customer
insights, which in turn have helped the business in forecasting
and new products. Also search queries have driven online to
offline in a big way, thus, driving business & footfalls.
Pawan Sarda
Group Head - Digital, Future Group
Source: Digital Retail in 2020: Rewriting the Rules, A Google-A.T. Kearney Study, 2016
Google Internal Data, January - December, 2018 58Retail Digital is influencing in-store sales 21% 10% 19% increment in growth in store increase in store store visits with walk ins with digital sales driven by an YouTube led digital campaigns integrated digital only campaigns - Kalyan Jewellers campaign - Lifestyle - Homecenter Source: Big Bazaar, Jan - Dec, 2018 Lifestyle numbers, Jan - Dec, 2018 59
Retail

28%                                     9%
of people who clicked on an ad          people who clicked on an ad
visited the store. More than 50%        visited the store. 46% of store
of store visits came from people        visits came from people who
who clicked on an ad within the         clicked on an ad within the
past 7 days - Big Bazaar                past 7 days - Lifestyle

Source: Shopper's Stop 2018 Jan - Dec                                 60
61
     Education

     Year in Search - India : Insights for Brands
Education
Increasing demand for machine learning, AI,
and software development courses
54% 74%
Google gave over
100K scholarships
across India in 2018
to make courses like AI/
increase in interest growth in searches machine learning, cloud,
around Machine Learning related to software data sciences, and
and AI courses development courses others more affordable
“
“
AI and ML are one of our high performing courses and as a company,
we foresee a lot of demand from both B2B and B2C customers. We
closely analyze the Google keyword planner and Google trends data to
identify growth opportunities. From this, we observed a clear increase
in demand for AI and ML courses. Based on this, we ramped up our
search campaigns for these 2 courses, which resulted in a proportionate
increase in revenue for us. We have seen an 80 percent increase in
consumer leads from Google Search Ads in the AI & Machine Learning
categories QoQ (October 2018 with January 2019)
Mr. Mark Moran
CMO, Simplilearn
Source: January - December, 2018, Google Internal Data 62Education
$650
Watchtime for
Science videos
Watchtime for
Hobby related
million
in India more videos in India The Edtech sector
showcases a steep rise
than tripled year tripled year over in total investment from
over year in 2018 year in 2018 the $350 million in 2017
Sources: Google Internal Data, 2018 6364
Local and
Classifieds
Year in Search - India : Insights for BrandsLocal and Classifieds
Explosive growth
in food tech
and hyper local
services in 2018
1 of every 2
food tech queries are
for aggregator brands
2.5X
jump in aggregator
brand queries in com-
parison to total growth in
food tech queries
Pizza is a favourite
among Indian
consumers when
ordering online
It was the most
searched term in 9
out of 11 states with
the highest of the
food tech queries
Source: Google Internal Data, January - October, 2018 65Local and Classifieds
Online consumers are turning to video
for food inspiration and research
237% Watch time for Cooking
videos in India more
growth of hindi than doubled year over
searches related year in 2018
to food
Source: Google Internal Data, January - December, 2018 66Local and Classifieds Co-working spaces The new way to work 100% Top destination for growth in queries for co-working spaces: co-working spaces in real estate searches Delhi NCR (Delhi, Gurgaon, Noida) Sources: Google Internal Data, January - December, 2018 67
Local and Classifieds

Dating searches are catching
up with matrimony queries

40%
growth in dating-related
searches, which are
growing much faster than
matrimony queries

37%
increase in online dating
brand queries versus 13%
increase in interest for
matrimony brands

The total volume of
matrimony searches,
however, continues to
remain high

3X
The total volume of
matrimony-related
queries in comparison to
searches about dating

Source: Google Internal Data, January - December, 2018                     68
69
Source: xx
             Media and
             Entertainment

             Year in Search - India : Insights for Brands
Media and Entertainment
Entertainment Video entertainment
content accounts
goes online for the largest volume
of internet usage
on smartphones
Over 36 minutes
per day per user
is the average video
entertainment
content watchtime
on smartphones
1 in 3
hours of video
entertainment
content in India is
already consumed
on digital*
2 out of 3
entertainment
users will access
OTTs by 2023
Sources: Neilsen's Panel of -16000 Smartphone Users
BCG -Entertainment Goes Online Report:2018 * amongst internet users 70Media and Entertainment
Bharat3 comes Top 4 Hindi search queries
online for यूट्यूब
entertainment
वीिडयो
भोजपुरी गाना
Video, music, and news are
the top queries of regional मोटू पतलू
language search in India
“
Search being an intent driven
platform, is one of our key
channels. Language content is one
of our USPs and with consumers
now searching in Indic languages,
it helps us tap into the additional
pool of non-English users
Manish Aggarwal
“
Business Head, ZEE5 India
Translations in order of appearance: YouTube, Video, Bhojpuri Songs, Motu Patlu
Source: Google Internal Data, 2017-18 71Media and Entertainment
Video drives video
India’s leading OTT
providers are turning
to YouTube to engage
To drive app installs in a cost-efficient way,
entertainment lovers Voot ensured it showed up on YouTube
by using multiple videos in its App campaign
Show marketing on The campaign resulted in a 300% higher
YouTube for ZEE5 click-through rate (CTR), 60% lower cost
Original Karenjit Kaur, per install, and 57% lower cost per video
helped drive a 69% rise in view compared to other video advertising
branded search queries platforms
while reducing cost per
engagement by 60%
Rangbaaz, a ZEE5
Original achieved
a 20x rise in daily Using a “burst” approach to generate more
subscription rate by downloads before the elections, DailyHunt ran
following creative best an App campaign across search, YouTube,
practices for video and the Display Network
The unique strategy resulted in 86% more
overall app installs, than standard campaigns
Over 60% growth
in video on demand
(VoD) searches
Source: Think with Google 7273
Telecom
and Payments
Year in Search - India : Insights for BrandsTelecom and Payments The rise of the non-metro user 25% growth in searches for telcos from Bharat3, they now make up 60% of all searches in the category 65% growth in searches for international roaming plans from Bharat; 51% of all DTH search queries are from non-metros2 Source: Google Internal Data, January - September, 2018 74
Telecom and Payments

As telecom
connectivity
grows outside
the non-metros,
users are seeking
access in their
own languages

21%
growth in Indic4
messaging app
downloads

1.9X
increase in
average data
consumption

Sources: January - November, 2017 vs January - November, 2018, App Annie                    75
Telecom and Payments

Increase in 4G connectivity and
access to mobile phones is driving
the jump in content consumption

                                                  4X
                                                  increase in 4G enabled
                                                  feature phone
                                                  shipments

                                                  24%
                                                  rise in speed test-
                                                  related searches on
                                                  mobile indicates that
                                                  consumers want high
                                                  network quality

Sources: January - June, 2017-18, IDC data
YouTube Internal Data 2017-18
Google Internal Data, January - September, 2018                              76
Telecom and Payments
Video is
important
to keep the
brand love
alive for
telcos
1 in 4
“
telco-related brand
searches are for their
own OTT services
Video is a core experience for our users. This
is specially true for the youth segment which
Nearly 75% is the primary target group for this campaign.
of all telco OTT searches YouTube helped us leverage this trend with
originate from outside of audience insights coupled with Director's Mix
which allowed us to infinitely customise our
the top 81 cities
campaign with local messaging to get 20%
consideration uplift and 31% awareness uplift
2 out of 3
searches for SVOD-telco Sunita Bangard
President, Marketing,
bundled offers come
Vodafone Idea Limited
from the top 8 cities “
Sources: Google Internal Data, January - November, 2018
Youtube-idea External Case Study 77Telecom and Payments
Telcos are turning to AI for
large scale customer servicing
One of India's leading Telco players
Airtel collaborated with Google
to bring Google Assistant-based
Digital Customer Care experience
to its customers.
Both prepaid & postpaid users can
get answers to various queries
Hi, how can I help? pertaining to their subscribed plans,
data usage and account balance.
Telecom players
“ As part of our digital transformation
journey, this is yet another innovation
are integrating to empower our customers. With
their customer smartphones fast becoming the norm
for every Indian, this will make digital
service with self-care much more interactive and
Google's virtual step up the customer experience,
assistant to
provide innovative, Sarang Kanade
AI-led solutions Director, Customer Experience
& Retail, Bharti Airtel
for consumers. “
Sources: Google Internal Data, January - September, 2018 78Telecom and Payments
Consumers are sticking to
cashless payments
Retail digital
payments
continue to grow
23%
growth in credit and
debit card transactions
at point of sale
7.5X
increase in average
transaction value
of credit cards
Sources: January - September, 2017-18, RBI data, NPCI data 79Telecom and Payments
The rise
of UPI
11X
surge in UPI transactions
between January & November
2018 as compared to the same
period during the previous year
10X
increase in total volume
of UPI payments, surpassing
mWallet transactions in
the first nine months of 2018
Sources: January - September, 2017-18, RBI data, NPCI data 8081
Technology
Year in Search - India : Insights for BrandsTechnology
Bharat is rising
Over 70% of all smartphones-related
searches come from Bharat
Hindi 2X 2.3X
gaining
increase in Hindi jump in Hindi queries
traction queries related to about smartphones
laptops and PCs and mobile phones
Source: Google Internal Data, January - December, 2018 82Technology
As the gap between offline &
online blurs, brands are embracing
an Omnichannel strategy
For PC OEMs5, every rupee
spent on search advertising is
influencing over Rs 38 in both
offline and online sales
Out of all sales driven by
media and promotion, digital
contributed to more than 70%
of those sales for Lenovo’s
notebooks between January
2016 to December 2017
For LG’s panel TVs, every one
INR invested on digital returned
an impressive 88 INR
“
“
While LG has been a proponent of digital marketing, the fact
that digital media drives significantly higher sales impact and
ROI than other media is a key business and marketing insight
for us that will shape our media planning going forward
Mr. Rahul Tayal,
Director, Strategic Business & Marketing,
LG India
Source: Think With Google India, "Lenovo and LG India experiment
shows that digital investment leads to ROI," December 2018
PC OEM point to HP & Lenovo Client Case Study, 2018 83Technology
YouTube:
An important More consumers are
medium for using YouTube to
tech product browse and research
tech products
research
Watch time for
Consumer Electronics
videos in India doubled
163%
growth in Unboxing
year over year in 2018 related searches
Source: Google IN Data , January 2018
Google Internal Data, January - December, 2018 84Technology
Gaming is going big
Indian online gaming industry to add 190 million gamers
and become a USD one billion opportunity by 2021
Top 3 downloaded
games in India in
2018:
1 - Ludo King
2 - Subway Surfers
3 - Temple Run 2
78% 2X Online Gaming
in India to hit
growth in gaming jump in mobile $1B by 2021 at a
laptop queries gaming searches CAGR of 28%
Source: "Online gaming in India: Reaching a new pinnacle," A study by KPMG in India and Google, May 2017
LiveMint Nov 2018
App Annie 2018 Ios and Play Store 85Technology
Consumer searches
have evolved from
brands to specific
phone features
Feature-led searches
growing at 2X of the overall
smartphone category
Digital 30% The highest
spike in
influence growth in SaaS
categories, with consumer
on SaaS mobile playing
a bigger role
interest is
for live chat,
category in influencing B2B
recruiting,
decision making
grows and accounting
2X
growth in SaaS
related searches
on mobile
Source: Google Internal Data, January - November, 2018 8687
Travel
Year in Search - India : Insights for BrandsTravel
Bharat is rising
Non-metro2 cities are driving growth
in non-conventional categories
Bharat* Top 8 Metros*
City and short trips 28% 11%
Car services and taxis 16% 4%
Packages 7% 1%
Destination activities 28% 14%
Pure destination discovery 42% 34%
*Growth in YoY %
Bharat3 is searching for more generic queries
than specific brands when it comes to travel
Source: Google Internal Data, January - December, 2018 88Travel
More users are
looking at India as 42%
Growth of inbound
their next travel travel from US, UK
destination and Italy
40% 10%
growth in searches rise in queries for generics
related to destination by travellers when booking
discovery terms travel to India
Source: Google Internal Data, January - December, 2018 89Travel Indians are searching for more international travel options 42% jump in international travel related queries by Indians 52% growth in international travel queries in May, making it the peak month. A large number of queries were related to hotel and pure destination terms 3X rise in Australia-related queries, making it the most favoured destination Source: Google Internal Data, IN, All Devices, January - December 2018 vs. January - December 2017 90
Travel

What are non-metro2 users looking for
before their international travel?

Destination discovery terms                                                       40%

Air                                                                                 17%

Destination activities                                                            40%

                                                         All percentages represent YoY growth

Source: Google Internal Data, January - December, 2018                                    91
Travel
Domestic travel
searches are growing
12%
growth in domestic
travel queries
Bengaluru
Mumbai
was the most searched
air route, with Bengaluru
being the highest searched
location for Hotels
21%
growth in queries for Jaipur's
tourist places
20%
growth in domestic travel
queries from Top 8 metros1,
which are growing at a much
faster rate than Bharat3 (11%).
Source: Google Internal Data, IN, All Devices, January -
December 2018 vs. January - December 2017 92BFSI Automation Travel clients have WEB seen efficiencies of around 20%-25% in acquisition cost after adopting Google automated bidding solutions and dynamic creatives “ Scaling up flight bookings and improving ROI on marketing spends are key goals for ixigo. Using Google's search insights, smart bidding and automation first approach, we were able to reduce our cost per transaction by 70% over the last 9 months. Google has helped us scale well and we are looking forward to integrating with Google's “ latest set of automation tools to continue on this journey. Himanshu Periwal, VP - Growth, ixigo.com Source: Customer Case Study - Ixigo - 2018 93
Travel

Getting a ride is a lot easier
with Google Assistant

        Brands like Uber,
        Ola & Meru made
        cab booking services
        available on Google
        Assistant

        The users can simply
        tap on the desired
        ride and confirm the
        booking

Source: PR Release - Gadgets Now      94
Travel
What influences
Indian travellers?
The top triggers for online purchase
in the travel category (air and hotel) are:
Multiple options in one place
Deals and discounts
The convenience of avoiding queues
Detailed travel information and verified user reviews
Digital drives offline
56%
of all leisure flight travellers
and 48% of all leisure hotel
bookers research online,
but book offline
Sources: Consumer Barometer
BCG-Google Digital Consumer Spending India Report, February 2018 95Glossary
1 Tier 1 cities (or) Top 8 cities (or) Metros
New Delhi, Mumbai, Chennai, Kolkata,
Bengaluru, Hyderabad, Ahmedabad, Pune
2 Non-metros
All cities except Top 8 cities
3 Bharat
All regions of India except the Top 8 cities
4 Regional languages (or) Indic
languages (or) Local languages
Google Search is available in 9 Indian languages
apart from English - Hindi, Gujarati, Bengali, Marathi,
Kannada, Tamil, Telugu, Malayalam, Punjabi
5 OEM
Original Equipment Manufacturer
96Power your business with the latest data, insights and inspiration from Google Go to www.thinkwithgoogle.com https://bit.ly/2VCsiWj
You can also read