Full Year Results Briefing Presentation FY20 - Stealth Global ...
←
→
Page content transcription
If your browser does not render page correctly, please read the page content below
AN AUSTRALIAN MULTINATIONAL DISTRIBUTION GROUP

A supplier and distributor of essential everyday workplace items and provider of supply
chain solutions to Business Customers (B2B) and to Retail Consumers (B2C)

Full Year Results Briefing
Presentation FY20

                                                                                          1 September 2020
                                                                                              ASX Code : SGI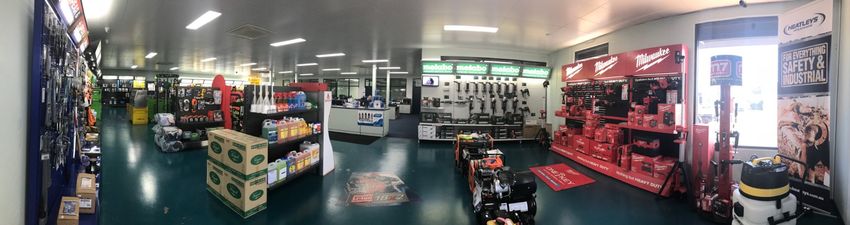
Disclaimer
                                                                                                                                                                                                                                                                               2

  This document has been prepared by Stealth Global Holdings (the Company) and is provided for information purposes only.              or fairness of the information, opinions, forecasts, reports, estimates and conclusions contained in this document. No Limited
  This document does not constitute an offer, invitation, solicitation or recommendation with respect to the purchase or sale of       Party represents or warrants that this document is complete or that it contains all information about the Company that a
  any security in the Company nor does it constitute financial product advice. This document is not a prospectus, product              prospective investor or purchaser may require in evaluating a possible investment in the Company or acquisition of shares in
  disclosure statement or other offer document under Australian law or under any other law. This document has not been filed,          the Company. To the maximum extent permitted by law, each Limited Party expressly disclaims any and all liability, including,
  registered or approved by regulatory authorities in any Jurisdiction. By reading this document you agree to be bound by the          without limitation, any liability arising out of fault or negligence, for any loss arising from the use of or reliance on information
  limitations set out in this document.                                                                                                contained in this document including representations or warranties or in relation to the accuracy or completeness of the
                                                                                                                                       information, statements, opinions, forecasts, reports or other matters, express or implied, contained in, arising out of or derived
  This document and the information contained within it is strictly confidential and is intended for the exclusive benefit of the
                                                                                                                                       from, or for omissions from, this document including, without limitation, any financial information, any estimates or projections
  persons to whom it is given. It may not be reproduced, disseminated, quoted or referred to, in whole or in part, without the
                                                                                                                                       and any other financial information derived therefrom.
  express written consent of the Company. By receiving this document, you agree to keep the information confidential, not to
  disclose any of the information contained in this document to any other person and not to copy, use, publish, record or              Certain statements in this document constitute forward looking statements and comments about future events, including the
  reproduce the information in this document without the prior written consent of the Company, which may be withheld in its            Company's expectations about the performance of its businesses. Such forward looking statements involve known and
  absolute discretion.                                                                                                                 unknown risks, uncertainties, assumptions and other important factors, many of which are beyond the control of the Company
                                                                                                                                       and which may cause actual results, performance or achievements to differ materially from those expressed or implied by such
  The information contained in this document is not intended to be relied upon as advice or a recommendation to investors and
                                                                                                                                       statements. Forward looking statements are provided as a general guide only, and should not be relied on as an indication or
  does not take into account the investment objectives, financial situation, taxation situation or needs of any particular investor.
                                                                                                                                       guarantee of future performance. Given these uncertainties, recipients are cautioned to not place undue reliance on any
  An investor must not act on the basis of any matter contained in this document but must make its own assessment of the
                                                                                                                                       forward looking statement. Subject to any continuing obligations under applicable law the Company disclaims any obligation or
  Company and conduct its own investigations and analysis. Investors should assess their own individual financial circumstances
                                                                                                                                       undertaking to disseminate any updates or revisions to any forward looking statements in this document to reflect any change
  and consider talking to a financial adviser, professional adviser or consultant before making any investment decision.
                                                                                                                                       in expectations in relation to any forward looking statements or any change in events, conditions or circumstances on which
  Statements and information in this document are current only as at 1 September and the information in this document                  any such statement is based.
  remains subject to change without notice. The information contained in this document is for information purposes only and is
                                                                                                                                       Past performance is not indicative of future performance and no guarantee of future returns is implied or given. Nothing
  an overview and does not contain all information necessary to make an investment decision or that would be required in a
                                                                                                                                       contained in this document nor any information made available to you is, or shall be relied upon as, a promise, representation,
  prospectus or product disclosure statement prepared in accordance with the requirements of the Corporations Act 2001 (Cth)
                                                                                                                                       warranty or guarantee as to the past, present or the future performance of the Company. No Limited Party or any other
  (Corporations Act). The information contained in this document is of a general nature and does not purport to be complete or
                                                                                                                                       person makes any representation, or gives any assurance or guarantee that the occurrence of the events expressed or implied
  verified by the Company, or any other person. The Company has no responsibility or obligation to inform you of any matter
                                                                                                                                       in any forward looking statements in this document will occur.
  arising or coming to their notice, after the date of this document, which may affect any matter referred to in this document.
                                                                                                                                       This document is only being provided to persons who are the holders of an Australian financial services license and their
  While reasonable care has been taken in relation to the preparation of this document, none of the Company, or their respective
                                                                                                                                       representatives, sophisticated investors (in accordance with section 708(8) of the Corporations Act and professional investors
  directors, officers, employees, contractors, agents, or advisers nor any other person (Limited Party) guarantees or makes any
                                                                                                                                       (in accordance with section 708(11) of the Corporations. Act) or to such other persons whom it would otherwise be lawful to
  representations or warranties, express or implied, as to or takes responsibility for, the accuracy, reliability, completeness
                                                                                                                                       distribute it.

                                                                                                                                                                                                                        SGH Full Year Result Briefing Presentation FY20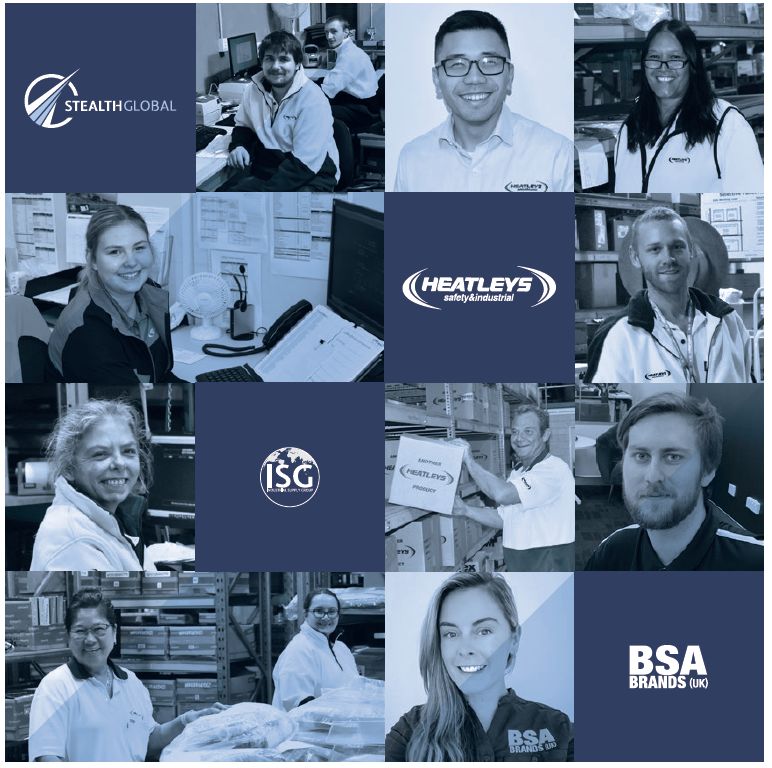
Contents
                                                                                                          3

    1.   Section 1 – 2020 The Year in Review        Page 4

    2.   Section 2 – Business Segments              Page 13

    3.   Section 3 – Financial Results              Page 18

    4.   Section 4 – Strategy, Growth and Outlook   Page 22

    5.   Appendices                                 Page 29

                                                              SGH Full Year Result Briefing Presentation FY20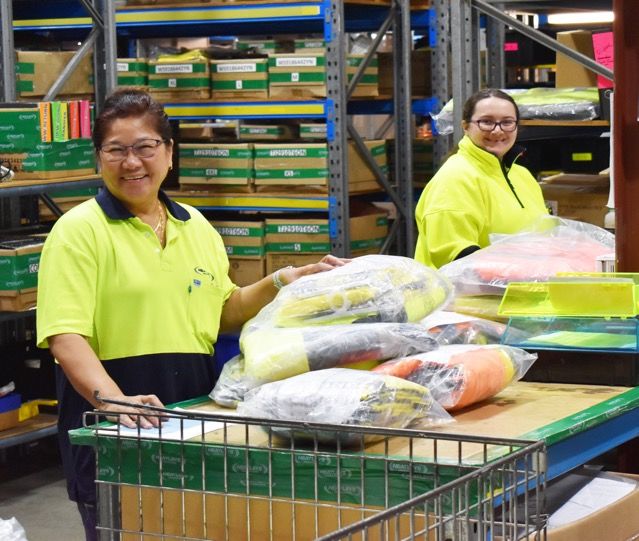
2020 The Year In Review
 Continued growth momentum

“ Competitively advantaged as a diversified business, in different
sectors, supported by a strong supply chain ”
Corporate Overview
                                                                                                                                                         5
                                                                                                           SGI BOARD MEMBERS

                                                                                                                                Chris Wharton AM
                          CORPORATE SNAPSHOT                                SGI SHARE OWNERSHIP                                 Chairman &
                                                                                                                                Non-Executive Director
 ASX Code                                                SGI

 Market Cap @ 25 August 2020                           $6.64m                                                                   Mike Arnold
                                                                                                                                Group Managing Director
 Share Price @ 25 August 2020                          7.0 cents                                                                & CEO

                                                                   High Net Worths 19%
 Net Debt @ 30 June 2020                               ($1.38)m
                                                                                          Retail 29%
 Available working capital facilities @ 30 June 2020    $5.2m                                                                   John Groppoli
                                                                                                                                Non-Executive Director
 Enterprise Value @ 30 June 2020                       $8.02m            High Net
                                                                          Worths
                                                                           11%
                                                                       Institutional
 Total Net Assets @ 30 June 2020                       $12.73m                              Board &
                                                                      investors 34%
                                                                                         Management 18%                         Alan Cransberg
 Trading multiple - EV/Underlying EBITDA                 2.5 x                                                                  Non-Executive Director

 Shares on issue                                        94.9m

 EPS Statutory (NPAT = $96k)                           0.1 cents
                                                                                                                                Karen Logan
                                                                                                                                Company Secretary
 Underlying EBITDA @ 30 June 2020                      $3.18m

                                                                                                              Well balanced experienced team,
                                                                                                          established to support high growth plans

                                                                                                           SGH Full Year Result Briefing Presentation FY20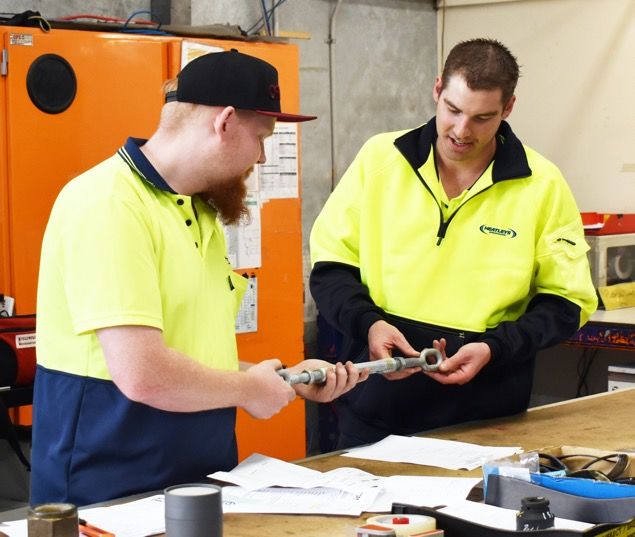
Group Overview
An Australian multinational distribution group
                                                                                               6

      Diversified business portfolio of Products, Customers, Suppliers, Industries
      served, a strong supply chain, all supporting reoccurring sales activity.

      ›   A supplier and distributor of essential everyday workplace items and provider of
          supply chain solutions to more than 3,000 business customers and 34,000 retail
          customers across a variety of industry sectors.

      ›   We are a one-stop-shop underpinned by sales specialists, physical store network,
          fulfillment services, distribution centres, eCommerce channels and strong
          marketing, content and advertising programs.

      ›   Customers place orders online, on mobile devices, through sales representatives,
          account managers, over the phone, by email, at local branches, at affiliates trade
          and retail stores and onsite through vending solutions.

      ›   Headquartered in Perth, Western Australia, we operate in Australia and
          Internationally under three competitive brands, Heatleys Safety & Industrial,
          Industrial Supply Group, and BSA Brands (UK).

      ›   We source more than 300,000 products from some 1,060 suppliers. Over 40,000
          line items are stocked in our distribution centres and store network. Stock
          availability with certainty of supply is essential to meet customer demand.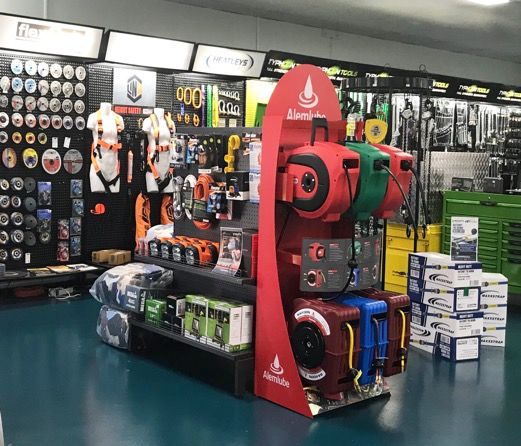
Some of our Exceptional People
                                                                                                                                          7

 Strong sales and service capability with deep specialist technical knowledge.

 We employ over 150 personnel who are dedicated to a team oriented, customer focused
 environment.

 We are committed to hiring and developing the best and insist on the highest standards in
 customer service.

 Our team members work with each other, their customers, supplier partners and local
 communities to ensure the company’s strategy is executed to create value for shareholders.

 Guiding Leadership Principals

  ›     Passionate Customer-centric company providing an effortless experience

  ›     Desire for Innovation

  ›     Commitment to operational excellence

  ›     Long-term orientated view ‘we think big’

                                                                                              SGH Full Year Result Briefing Presentation FY20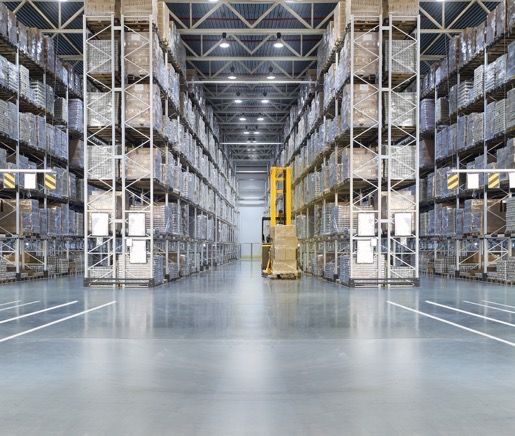
Product Range
                                                                                                                                                                                                  8

                                                                                     VAST ASSORTMENT OF ESSENTIAL EVERYDAY ITEMS
      PRODUCT CATEGORIES
                                                                          Access to 300,000+ products across 30 sub-categories supported by leading brands

 Safety / PPE

 Industrial / MRO

 Workplace

 Print &
 Promotional

  Retail

 Healthcare, Cleaning
 & Hygiene

  Hardware, Building
  & Construction

                           More than 40,000 products (~$7.9 million) is held in our Distribution Centres sourced from 1,060+ suppliers across 19 countries

                                                                                                                                                      SGH Full Year Result Briefing Presentation FY20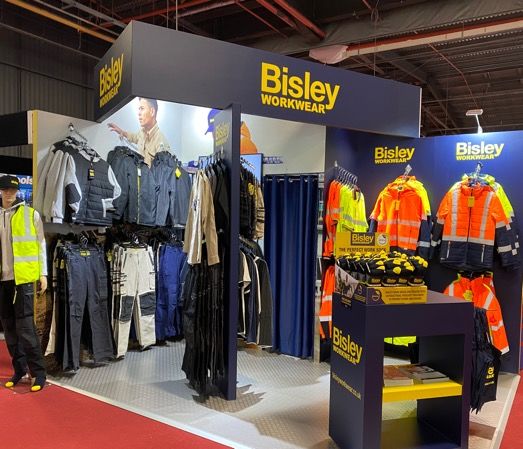
Result FY20
2020 The Year in Review: Key Numbers
Continued focus on growth – disciplined performance in challenging markets
                                                                                                                                                                                                                                                                                             9
       Advantage from being a diversified business, being in different sectors, supported by a strong supply chain capability

      ›       Group Revenue $68.1 million, up 8% from $63.1 million, despite COVID-19 impact in 2H.

      ›       Record annual revenue performance in Australia of $57.4 million, up 36% on prior year, despite COVID-19 impact.

      ›       Underlying EBITDA of $3.2 million (FY19 $1.9 million).

      ›       Growth related investment costs of $1.77 million (FY19 $1.0 million).
              •    eCommerce digital platforms, strategic, acquisition & sales opportunities, and BSA Brands (UK) store expansion (74) and inventory, point-of-sale, marketing & sales people.

      ›       Net Profit After Tax of $0.1 million (FY19 $0.5 million).

      ›       Gross Profit 2H-20 of 28.2%, up from 24.3% FY19 and 18.5% FY18.

      ›       2H growth momentum and earnings impacted by COVID-19 as Australian borders closed and the UK market entered lock down.

      ›       Low Net Debt of $1.4 million with year-end closing cash balance $1.1 million. Strong working capital position of $5.2 million available finance facilities.

      ›       Total customer accounts increased by 405 to 11,630, with high level of repeat sales.

      ›       BSA Brands (UK) first year growth from start-up with distribution expanded to 74 stores ranging Bisley Workwear in the eight months to February.

      ›       BSA Brands (UK) secured $1.5 million of new orders for FY21, surpassing FY20 total sales.

      ›       Reduced total number of suppliers by 47%, leveraging buying power and driving efficiency gains.

      Notes:
      All figures quoted in Australian Dollars and all comparisons are with the 12 months ended 30 June 2019 (FY19), unless otherwise stated.
      All figures are quoted based on all operations of the Group, including discontinued operations, unless otherwise stated.
      Underlying Earnings before interest, tax, depreciation and amortisation (EBITDA) is a non-IFRS measure. A reconciliation of Underlying EBITDA to net profit after tax is shown on Slide 19. The Company believes that it assists investors with a comprehensive understanding of the
      underlying performance of the business.
      Growth Investment relates to specific activities that supports high growth strategies planned to deliver longer term benefit to Shareholders.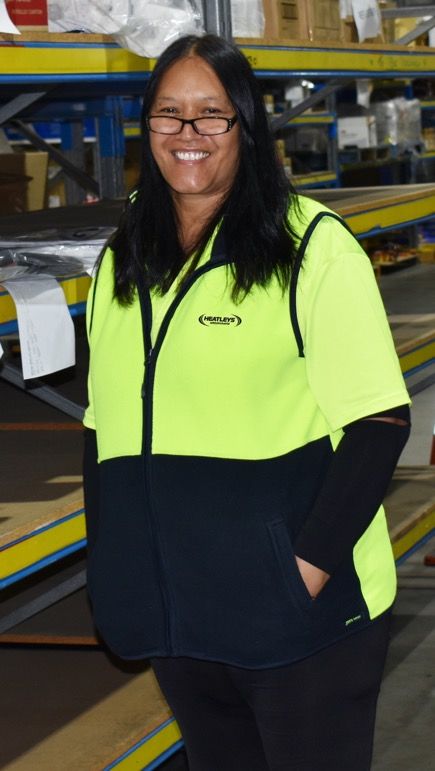
Full Year Revenue & Underlying EBITDA
Short-term growth momentum impacted as Australian borders closed and the UK market entered lock down.
10
GROWTH CONTINUED IN FY20 REVENUE $m UNDERLYING EBITDA $m
3.5
3.2
90.0 3.0
Revenue up 8% to $68.1m. Growth achieved despite 80.0
68.1 2.5
impact of COVID-19, particularly in BSA Brands (UK). 70.0 63.1
1.8
2.0 1.9
60.0
Underlying EBITDA up 68% to $3.2m. 1.5 1.0
50.0
40.0 1.0
0.07 1.4
30.0 23.4 0.5 0.9
Reported EBITDA up 57% to $1.4m. 0.47
20.0 0.0
-0.4
10.0 -0.5
Statutory NPAT $0.1m ($0.5m in pcp). Includes
0.0 -1.0
impact of Growth-Related Investments of $1.77m
FY18 FY19 FY20 FY18 FY19 FY20
($1.0m pcp).
Statutory Growth Related
Record Sales in Australian operations (83% of total EBITDA Investments
group sales).
INDUSTRIAL PRODUCTS PRODUCT MIX % OF SALES GEOGRAPHIC SALES WHERE
*Underlying EBITDA excludes $1.77m investment SALES BY INDUSTRY GROUP
PPE SAFETY PRODUCTS BY CATEGORY CUSTOMER IS BASED
related costs: WORKWEAR 2% 2%
1% OTHER 1%
• $0.48m Establishment costs for BSA Brands UK. MATERIALS HANDLING
1%
1% UK 1%
All other Industry,
• $0.46m Transaction evaluation and due diligence. FOOTWEAR 4%
3% 3%
Trade & Retail
• $0.83m investment related senior people hires PACKAGING AND TAPES
4% 22%
6% AFRICA
and eCommerce Development Costs. JANITORIAL PRODUCTS Manufacturing, 15%
Engineering,
WELDING PRODUCTS 14% Construction AUSTRALIA
39%
Resources
These were made with focus on accelerating new GLAZING & FABRICATIO
29%
49%
83%
network partnerships, ecommerce capabilities, SEALANTS & ADHESIVES 20%
completing and evaluating acquisition opportunities. FASTENER PRODUCTS
Underlying EBITDA - adoption of AASB16 Leases effective 1 July 2019, no FY19 restatement required by Accounting Standards SGH Full Year Result Briefing Presentation FY20COVID-19 Impact Response – Well managed and reset for a stronger business
Staff safety, wellbeing programmes in place, and flexible and remote work practices enacted 11
COVID-19 disruptions and changing consumer behaviour. The Company continues to monitor the situation and adapt its response plans accordingly.
› Successfully navigated a turbulent second half which included isolated impacts of COVID-19 in various geographies.
› Short-term growth momentum impacted as Australian borders closed and the UK market entered lock down.
› Proactive measures taken to ensure the long-term sustainability of the business.
• Liaised with government and health bodies to establish and implement required safety protocols.
Group • Targeted cost reduction and cash management plan to preserve business profitability.
• Proactively engaged with employees, suppliers, landlords and advisors, reigning in expenses, renegotiating leases, and managing payroll costs.
• Increased inventory levels from local and Asian suppliers. Long term relationships in China ensured product quality was of, and met standards.
• Initiatives delivered an annual fixed cost reduction of $1.4m, which resulted in a stronger business in future with an appropriate fixed cost base.
› New customer sales gained in Q4; Safety PPE, Masks, Gloves, Sanitisers, Cleaning, Hygiene and other related items, to continue in FY21.
› Saving lives at the forefront of mind
› Overall Australia Q4 sales reduced 20.3% against the same period in FY2019. Jobkeeper was achieved by operations.
Australia
› Distribution Centres remained open to support front line workers with essential items.
› Large customers reduced non-essential work and delayed discretionary expenditure. Significantly scaled down operations due to project delays,
particularly in fly-in, fly-out operations. Reduced spend by approximately 40% in Q4 against the prior year period.
› Mid and small tier customer groups held up well by maintaining repeat purchases. Sales declined approximately 8% in Q4 on the prior year period.
› UK Government COVID-19 measures significantly impacted the Company’s operating environment;
United Kingdom • strong first 8 months sales momentum before economy lockdown that delayed, deferred and significantly reduced sales;
• temporary deferral of expansion of distributor stores in the UK and progressing potential new customer arrangements.
SGH Full Year Result Briefing Presentation FY202020 The Year In Review
Operational and Strategic Highlights
12
› Australia business successful record full year sales, despite a sales decline of Q4 pcp 20.3%. Repeat recurring sales continued at lower levels, focused
on customer segment expansion, building capability and transformational change.
Business Area › BSA Brands (UK) first full year of operation, $1.1m sales to 74 new distributors ranging Bisley Workwear. Predominantly in the first 8 months.
Highlights › Reset fixed cost base, removed annual SG&A costs of $1.4m mainly in the International operations impacted by COVID19.
› Africa strategic review completed, focus on higher margin business. Quit supply contract with largest single customer (Capital Drilling) caused by a
high cost to serve, low single digit gross profit contribution.
› Several divisional leadership - General Manager of ISG and Senior Sales people in BSA Brands (UK) and Heatleys Australia.
People › Corporate Office; Group CFO, Chief Development Officer, Finance & Treasury Manager, Business Development and Marketing.
Investment › Stealth Global Holdings Board – Alan Cransberg appointed as Non-Executive Director.
› The purpose of early investment is to significantly pivot the business forward through growth related events.
› COVID-19 reinforced our strategy and business model growing as a wide range distributor of everyday items, when it negatively impacted on others.
› Invested $1.77m to scale up our core capabilities, introduce value add services, accelerate new network partnerships, eCommerce digital capabilities,
Investment rolling out Bisley Workwear range in the UK in 74 distributor stores, reviewing and completing strategic partnerships and acquisition opportunities.
Highlights
› Inventory ‘stock on hand’ of $1.6m extra for Australia of COVID-19 products, Protect-A-Load and BSA Brands UK (of Safetywear, Workwear).
› Significant investment towards step-change eCommerce digital offer and expansion (B2B and B2C). Planned launch by December 2021.
› Continued to selectively consider and invest in growth related initiatives with a long-term value generation focus.
› AWS business ‘transformational shift’ from telephone call sales to Online ordering, transfer of 34,000 customer base to Online channels in Q2/21.
Strategic › Acquired Protect-A-Load brand and stock in October 2019 for $0.5m.
Highlights › Acquired Industrial Supply Group in May 2019. First full year of operation in 2020. Revenue of $2.1m and profit projections in the year.
› Assessed two material acquisitions. Did not proceed with one deal due to not meeting valuation criteria. The second opportunity is under review.
12 › Reset and strengthened long term perspective of growth (3-5 year outlook) through unique omnichannel strategy and different directions for growth.Section 2 – Business Segments “ Competitively advantaged as a diversified business, in different sectors, supported by a strong supply chain ”
Our Business Portfolio
Subsidiary companies and key statistics within the group
                                                                                                                                                                                 14

        A supplier and distributor of essential everyday workplace items and provider of supply chain solutions to Customers of all types and sizes.

                               OUR BUSINESSES                                                                     DEPTH AND SCALE

                                                                                                Employees                                153
        Australia - Heatleys

                                                                                                Product SKU’s on Offer                >300,000

        Australia - Other Brands                                                                Active Business
                                                                                                                                       >3,000
                                                                                                Customers

                                                                                                Active Retail Customers               >34,000
        United Kingdom
                                                                                                Company & Affiliate
                                                                                                store locations in                        34
                                                                                                Australia

        Ecommerce Digital                                                                       Distributor store
                                                                                                locations in the UK                       74
        Channels (launch 2021)

                                                                                          Significant growth achieved since listing on the ASX in October 2018

                                                                                                                                    SGH Full Year Result Briefing Presentation FY20
Business Segment Overview
15
Australia 83% Group Sales
› Comprises mainly of income earned from business customer sales of essential everyday
workplace items and supply chain solutions through sales reps, Online, physical
distribution centres, trade branch stores, affiliate trade and retail store locations, vending
and onsite solutions.
› This segment provides export sales to international customers.
Joint Venture with BSA Brands (UK) – Launched May 2019 1% Group Sales
› BSA Brands is a safetywear and workwear distributor in the UK. Income is earned from
business customers in the UK and Africa through trade and industry distributors led by UK
based sales force consisting of external sales reps and internal sales and marketing
support team.
› Online income is generated through Amazon and 3rd party webshops in the UK.
Other International 16% Group Sales
› Income is gained from tier 1 business customers in Africa through sales of everyday
industrial, safety and workplace consumer products through internationally focused
internal sales force.
› The segment involves export sales activities sourced mainly from UK, Europe and USA.
SGH Full Year Result Briefing Presentation FY202020 The Year In Review
Australian Operations achieved Record Sales in FY20 despite a sales decline in Q4 pcp by 20.3%.
16
Australian Operations represent approximately 83% of Group Sales, and achieved Record Sales in FY20
› Record annual revenue performance from its repeat customer sales activity, albeit impacted by COVID-19 in Q4.
› FY Sales growth of 36% to $57.4m and Operating Profit of 8.7% growing from 5.2% since acquisition in 2018.
› Strong sales and operational performance in distribution, store network and online in the first 8 months.
• Major customers grew by 11.7% full year
• Average spend per ‘Large and Medium’ size customers increased by 6.5%
• Sales growth in essential ranges of Safety, PPE, Cleaning, Hygiene by 9.6% and Industrial by 7.2%
• Reduced total number of suppliers by 47%, leveraging buying power and driving efficiency gains
› Short-term growth momentum and earnings were impacted between March-June from COVID-19 as Australian borders closed.
Sales between COVID-19 period March and June declined 20.3% pcp, driven mainly by a slow down, delay and deferral of
projects with our major customers.
› Won new first time government supply arrangements in Q4 for our Safety, PPE, Cleaning, Hygiene range.
Outlook FY21
› FY21 sales and earnings are expected to remain solid and better than FY20.
› Heatley’s acquired the Protect-A-Load business and product range in October 2019 achieving good sales in FY20. Strong future
sales are expected as the range is expanded to new customers in Western Australia, South Australia and at a national level.
› Expansion outside our core – digital channels, geographies, customer segments, all different directions of growth.
16
SGH Full Year Result Briefing Presentation FY202020 The Year In Review
International Operations
17
Continued investment in BSA Brands UK rollout, and major customer review in Africa
BSA Brands United Kingdom – Safetywear and Workwear
› Significant investment by BSA Brands in first year market penetration, $1.1m sales from zero base new market entry.
• Roll out of the Bisley range into 74 distributor stores across the UK.
• New UK market entrant:- P&L Investment of $0.5m in costs creating brand awareness, sales & marketing, promotional activities
including collateral across 89 buses, Amazon channel, Instore & Online promotions, trade shows and sample giveaways.
› COVID-19 shut down the UK economy from March which impacted on market momentum, customer sales and overall profitability.
• Full Year delivered an EBITDA loss of ($1.0m), reducing to ($0.4m) after tax attributable to SGI’s 50% reflecting the ongoing P&L
investment in establishing brand awareness, store product ranging implementation, people and marketing, building brand awareness,
along with the COVID-19 impact in H2.
• Responded quickly to restructure operations, contributing to the group wide annual cost savings of $1.4m.
› New workwear forward orders received early FY21 of ~$1.5m sales to be supplied in FY21 surpasses BSA Brands FY20 total sales.
› UK Market in July 20, commenced to reduce COVID-19 restrictions, the opening of its trading economy.
Africa region broad range supply
› Africa region sales in FY20 were $10.4m (H2 $2.0m, H1 $8.4m) a reduction of approximately $10.7m on pcp.
• Company strategic reset in December 2019 focused on more profitable customers.
• Resulted in quitting largest customer contract ‘Capital Drilling’ in January 2020 due to low single digit declining Gross Profit contribution.
› The reduction in low margin Africa sales has been largely replaced by new higher margin sales in Australia and UK businesses.
17
SGH Full Year Result Briefing Presentation FY20Section 3 - Financial Results
Overview of financial statements
“ Competitively advantaged as a diversified business, in different
sectors, supported by a strong supply chain ”Full Year Financial Highlights
Results for announcement to the market
19
In the year we have continued to focus our investments on getting the settings right for the future.
FULL YEAR 2020 HIGHLIGHTS TRADING PERFORMANCE FY 2020 Movement Since FY 19
P&L Revenue $68.1m Up $5m or 8%
› Revenue of $68.1m, an increase of 8%.
› Record turnover in Australia, increasing 36% despite a 20.3% Underlying EBITDA $3.2m Up $1.3m or 68%
decline in Q4 resulting from the impact of COVID-19.
› Deliberate pivot away from low margin sales in Africa to higher margin Growth Related Investment $1.77m Additional $0.7m or 74%
sales in other markets (Africa FY20: $10.4m vs pcp $21.1m).
› Underlying EBITDA of $3.2m, increase of 68% on FY19. Statutory EBITDA $1.42m Up $0.51m or 56%
› Growth Related Investment of $1.77m, focused on setting the
Net Profit/(Loss) After Tax Attributable to Owners of the
foundations for achieving the strategic directive of $200m turnover at $0.1m Down $0.42m or 82%
Company
>8% EBITDA by 2025 (FY19: $1.0m).
› Statutory EBITDA of $1.4m, increase of 56% over FY19 which has not Gross Profit 26.6%
up from 24.3% FY19
18.5% FY18
been adjusted for the impact of AASB16 Leases.
› Net Profit After Tax attributable to members was $96k.
SGH Full Year Result Briefing Presentation FY20Result FY20
Full Year Results Reconciliation
20
30 Jun 20 30 Jun 19
Reconciliation – Full-year financial results
$’000 $’000
Underlying EBITDA1,2 3,185 1,920
Growth Related Investments:
Investment in the establishment of BSA Brands in the United Kingdom market – brand awareness, promotion, point of sale, travel, marketing,
(485) (560)
sales team3
Transaction costs – due diligence, acquisition analysis and professional fees4 (457) (458)
Appointment of Senior Corporate and Growth Transformation Personnel (Senior Finance, Ecommerce, Business Development) and
(826) -
Ecommerce Solutions Development5
Statutory EBITDA1,2 1,417 902
Depreciation (1,418) (166)
Net Finance Costs (442) (149)
Profit/ (loss) for the year before tax (443) 588
Profit/ (loss) for the year after tax (324) 386
Add back: Minority Interest 50% of the BSA Brands (UK) Limited loss (420) (134)
Profit for the year before tax attributable to Members 96 520
1 EBITDA (Earnings Before Interest, Tax, Depreciation and Amortisation), Underlying EBITDA and Statutory EBITDA are non-IFRS terms which have not been subject to audit or review; Underlying EBITDA is determined by adding back Growth Related Investment costs to the Statutory EBITDA which
in turn has been determined using information presented in the Group’s financial report.
2 EBITDA comparison results for FY19 have not been adjusted for the impact of AASB16 Leases, as in accordance with the accounting standard prior year results are not restated.
3 BSA’s contribution to Group EBITDA was a loss of $1.0m – representing 100% of the performance of BSA - and after adding back the 50% minority interest in the JV, the after-tax contribution was reduced to a loss of $420k. The upfront investment to take the Bisley Workwear brand from start-
up in the UK market, build brand awareness, meet product compliance conditions and roll out the range into 74 distributor trade store outlets is continuing, and was $485k in the P&L in the full year, including brand awareness, promotion, point of sale, travel, marketing and the sales team.
4 Transaction costs are significant in FY20 and relate to a major opportunity that was evaluated in detail in the year, which ultimately did not proceed, as well as ongoing opportunities.
5 Corporate and Growth Transformation Personnel refers to investments in new strategic programs ahead of earnings return with focus on senior finance, technology, large sales contracts, partnerships, joint ventures and acquisition review activity. Appointments in FY20 include Group Chief
Financial Officer, Group Development Officer, Corporate Finance and Treasury, Business Development and Group Finance Manager. These appointments pre-empt upfront corporate and strategic actions expected to increase scale with near-term upside.Full Year Balance Sheet and Cash Flow
21
STATUTORY STATUTORY
FULL YEAR 2020 HIGHLIGHTS BALANCE SHEET SUMMARY 30 JUN 2020 30 JUN 2019
$M $M
BALANCE SHEET Cash and cash equivalents 1.1 2.0
Other current assets 16.5 22.7
› Cash position of $1.08m.
Property, plant and equipment 0.7 0.6
› Net Debt of $1.4m (pcp Net cash $0.4m). Other non-current assets (inc AASB16 Leases of $3.5m) 12.1 8.0
› Inventory $7.9m, an increase of $1.6m in both the UK and Heatleys to Total assets 30.4 33.3
scale up for potential supply chain issues due to COVID-19. Financial liabilities - debt 2.4 1.6
Other liabilities (includes AASB16 Leases of $3.5m) 15.3 18.8
› The effect of AASB16 Leases added $3.5m of Right Of Use Assets to the
balance sheet (and $3.5m of Lease Liabilities). Total liabilities 17.7 20.4
Total equity 12.7 12.9
› Goodwill increased by $0.26m on the acquisition of Protect-a Load.
› Other liabilities includes a significant reduction in trade and other
CASHFLOW SUMMARY
STATUTORY
30 JUNE 2020
STATUTORY
30 JUN 2019
payables of $8.1m and an increase in the JV partner’s contribution to $M $M
working capital at BSA Brands of $0.76m. Net Cash inflow/(outflow) from operating activities 0.3 (0.3)
CASH FLOW Net Cash inflow/(outflow) from investing activities (0.8) (8.1)
› Operating cash inflow of $0.3m due to improved customer Proceeds from issuance of shares and borrowings 0.8 14.1
collections and Jobkeeper subsidy offset by an increase in Repayment of financial liabilities (1.2) (2.9)
Inventory levels (ex BSA & inc PAL) of $0.9m.
Payments for capital raising - (1.1)
› Investment of $0.5m to acquire Protect-A-Load (PAL) and ISG. Net cash provided by/(used in) financing activities (0.4) 10.1
› Net drawdown of Heatleys Westpac debt facilities of $2.0m at Net (decrease)/increase in cash and cash equivalents (0.9) 1.7
30 June 20. Cash and cash equivalents at beginning of the year 2.0 0.3
Cash and cash equivalents at end of the year 1.1 2.0
SGH Full Year Result Briefing Presentation FY20Section 4 - Strategy, Growth and Outlook “ Competitively advantaged as a diversified business, in different sectors, supported by a strong supply chain ”
Our Go-to-Market Growth Strategy
Building the essential distribution platform
                                                                                                                                                                                                                23
                               An omnichannel approach providing a One-Stop-Shop for essential everyday items and fulfillment services

                                         Serving Business Customers (B2B) and to Retail Consumers (B2C)                                                                       PRODUCT CATEGORIES

                                    TODAY’S BUSINESS                                                       EXPANDED BUSINESS FY2021+
                                                                                                                                                                             Safety / PPE

                            TODAY                          TODAY                        EXPANSION                   EXPANSION                   EXPANSION
                                                                                                                                                                             Industrial / MRO

                     Product Brands               Sales & Marketing                     Ecommerce              Fulfillment Logistics       Value Add Services
   BUSINESS MODEL

                                                                                      digital channels                                                                       Workplace

                    Vast assortment of        ›   Sales Force                  ›   Online Ordering B2B     ›   Warehousing,            ›    Onsite Solutions,                Print &
                    more than 300,000                                                                      ›
                    essential everyday
                                              ›   Physical Store Network,      ›   Online Ordering B2C         Replenishment,          ›    Vending Solutions,               Promotional

                    consumable items          ›   Online                       ›   Click & Collect,        ›   Order Fulfillment,      ›    Instore Retail,
                                              ›   Omnichannel Marketing        ›   Data Exchange,          ›   Inventory Management,   ›    3rd Party Logistics.              Retail
                                                                               ›   Punchout Catalogue,     ›   Delivery
                                                                               ›   Product Inventory
                                                                                   Management                                                                                Healthcare,
                                                                                                                                                                             Cleaning & Hygiene
                                                                               ›   Web Services,
                                                                                   Content/Subscription,
                                                                                   CRM, Marketing,                                                                           Hardware, Building
                                                                                                                                                                             & Construction

                                                                VERTICALLY INTEGRATED DISTRIBUTION PORTFOLIO

                                                                                                                                                                   SGH Full Year Result Briefing Presentation FY20
Progress on our Strategic Agenda Since October 2018
24
› Our last 24 months has been the most transformative years in Stealth’s corporate
history completing three acquisitions, establishing a Joint Venture in the UK with
Bisley Workwear and growing sales from $23.5m to $68.1m in 2 years.
20
› Our primary objective is to provide a satisfactory return to shareholders by F Y 20
10 July 20
remaining focused to manage businesses for long term success and value creation.
9 Mar 20 • FY20 annual sales
increased 8% ($5m)
8 Jan 2020 pcp FY19
• Responded to
COVID-19 • Won A$1.5m of new
orders via BSA Brands
7 Oct 2019 • Changed Africa • Restructured UK to supply Bisley
Strategy operations Workwear into Africa
6 Aug 2019 removing $1.4m customers during
• Acquired • Cancelled
FY2 019 Protect-A- contract with
of annual costs. FY21 surpassing total
5 May 2019 Load Brand largest • UK economy revenue earned by
• FY19 result customer went into lock BSA in FY20.
4 Mar 2019 • Revenue Capital Drilling down.
• Acquired increased by in Africa to • Essential product
Industrial Supply $40m focus on serving
3 Feb 2019 sales in Australia
• JV with Bisley Group Tier 1 increased.
Workwear in • Established an customers and
the UK Australia-wide high margin • Sales in period
2 Dec 2018 • H1 report March to June
• Formal Trading distribution business only
1 • Sales growth footprint adding 27 declined pcp.
Oct 2018 at double partnership with
• Heatleys UK’s Troy group new locations
digit levels
integration offers gateway to
• ASX Listing completed ~420 trade outlets
• Heatleys
acquisition
SGH Full Year Result Briefing Presentation FY20Result FY20
Transformational Growth Trajectory Since July 2018
Listed on the ASX October 2018
25
Approximate Growth
30 June 2020 30 June 2019 30 June 2018
Since June 2018
› Statutory Revenue $68.1 million $63.1 million $23.5 million $44.6 million
› Annual Sales to customers based in Australia $57.1 million ~$51.5 million $3.1 million $54.0 million
› Annual Sales to customers based in UK $0.6 million $0.2 million $0 million $0.6 million
› Annual Sales to customers based in Africa (strategic reduction, low margin) $10.4 million $22 million $18 million ($7.6 million)
› Employees 153 162 48 105
› Business Customers ~3,000 ~3,000 ~80 2920+
› Suppliers (reduction to FY19 securing efficiency gains) 1,060 ~1,700 ~620 ~640
› Location: Own Distribution, Distributor, Affiliates 103 44 5 98
› Own Branch office trade store locations 9 10 3 6
› Inventory on Hand in Distribution Centres $7.9 million $6.3 million $0.3 million $7.6 million
25Strategic Growth Priorities in 2021
We are a growth company: - Our aim is to grow annual revenue to over $200 million at an EBITDA margin of 8% plus in 2025
26
Continue to invest in expansion: We set the bar high to trigger growth events where we stand to outperform
BUILDING AUSTRALIA’S LEADING MULTINATIONAL DISTRIBUTION GROUP
We believe it is possible over the long-term by
1 Serving customers of all sizes and
types in business and retail markets 2 Growing our core business by
aligning our sales force to develop 3 Growing outside our core to
adjacent fields; 4 Building a fully-integrated shopping
experience underpinned by an
(B2B) and (B2C) different customer types and › expanding geographically; enlarged distribution network.
Industry segments. › expanding product range;
› new distribution channels;
› growing customer segments;
› more value add services.
5 Completing value accretive
acquisitions and partnership 6 Significantly expanding our
eCommerce digital and supply chain. 7 Value chain integration creating
more income and profit generating 8 Develop our People
Commencement of the Stealth Institute of
Excellence.
arrangements to add depth, scale, ‘online, instore, onsite, click & collect options, activities.
capability or vertical channels. and more data driven decision making’. › Fulfillment & logistics services;
› Online, Onsite, Vending & Instore solutions
› Content, subscription, marketing programs
and Web services.
› We are well placed to continue to evaluate numerous organic and strategic opportunities. › We will capitalise on improved market conditions.
› Key point in our strategy is making complementary value generating acquisitions › We have a strong board and management team in place to execute.
SGH Full Year Result Briefing Presentation FY20Outlook Result FY20
High Impact Strategies that create long-term shareholder value.
27
We are cautiously optimistic of favourable market share gain by an extremely rapid allocation of growth events. We will maintain our disciplined investment approach &
optimisation of our distribution network. In FY21, our budgeted spend towards growth related activities will be approximately 2.2% of Revenue ($1.5m).
IN FY21 - BUSINESS REMAINS RESILIENT THROUGH UNPRECEDENTED PERIOD.
1 › Portfolio actions taken during the year have enabled a significantly stronger business. We expect growth from scaling up our core.
2 › The diversity of our portfolio supports recurring and future growth in sales (customer projects reopening particularly in Western Australia).
3 › Positive signs of the UK market opening up. Sales demand is expected to return in H2 of FY21.
4 › A relentless focus is growing to meet the evolving needs of customers in Business (B2B) and Retail (B2C) markets, and improving the customer experience.
5 › Launch of Online B2C leveraged by transitioning ~34,000 existing retail customers from a Telephone sales model to a Retail shopping model.
(Online, Click & Collect, Instore, Vending)
› Launch of the Stealth Institute of Excellence,
6 A leadership, personal + professional development, training and intern framework. The aim is to be an “employer of choice” providing a ‘ job for life pathway’ for existing & new employees.
Program delivers job specific learning, skills for promotion, and mentorship that will benefit the individual and the Company.
7 › All businesses are well-positioned for success, expected to deliver improved profit earnings contributing to a Group uplift in FY21.
8 › 2025 Strategy not just incremental – broader mindset to adopt big moves that deliver material impact from organic, strategic and acquisition areas.Compelling Investor Value Proposition
28
INVESTMENT HIGHLIGHTS
1 › Competitively advantaged offering with diversified portfolio, repeat customers and end markets coverage.
2 › An Industry leader in large, fragmented and highly-attractive market. History of successful growth.
3 › Multiple levers for growth and value generation impacted by organic and strategic events.
4 › More income and profit generating activities in all stages of the Supply Chain.
5 › Commitment to growth principles driven by an outstanding employee culture.
6 › Long-term strategy, portfolio and prospects remains intact.
7 › Strong board and management team with a disciplined approach to capital management and business investment.
8 › Share price not reflecting the value and potential of the companies growth aspirations, where we aim to outperform.
SGH Full Year Result Briefing Presentation FY20Section 5 - Appendices “ Competitively advantaged as a diversified business, in different sectors, supported by a strong supply chain ”
Our Supply Chain Network
Serving more than 3,000 Business Customers (B2B) and 34,000 Retail Consumers (B2C)
                                                                                                                                                                 30
                                                                                                  GROUPS DEPTH AND SCALE

                                                                                     Employees                              153

                                                                                     Branch Locations                        9

                                                                                     Independent
                                                                                     Merchant Trade Stores                   25
                                                                                     Australia

                                                                                     Affiliate Distributor
                                                                                     Trade & Retail Stores                   78
                                                                                     International

                                                                                     Product SKU’s held in our
                                                                                     Distribution Centres                >40,000

                                                                                     Size of Distribution Centres      10,300sqm

                                                                                     Suppliers                            >1,060

                                                                                                                    SGH Full Year Result Briefing Presentation FY20
Group Locations
31
Bisley Workwear stocked in 74 UK trade stores
NORTH Australia locations
8 Distributors
NORTHERN TERRITORY
MIDLANDS 1x ISG Member
12 Distributors
NORTHERN
IRELAND
8 Distributors SOUTH
46 Distributors
QUEENSLAND
8 x ISG Members
KALGOORLIE
1x Heatleys store
1,700sqm DC.
PERTH
NEW SOUTH WALES
SGI Head Office
5 x ISG Members
2x Heatleys Stores
DC 5,000 sqm
A.C.T
BUNBURY 1x ISG Member
1x Heatleys store SOUTH AUSTRALIA
1,600sqm DC. 1x Heatleys store
1,500 sqm DC VICTORIA
4 x ISG Members ISG Head Office
5 x ISG Members
TASMANIA
1 x ISG Member
SGH Full Year Result Briefing Presentation FY20Heatleys Australia Operations
Our largest customer and service markets are currently Western Australia & South Australia
32
CANNING VALE WINGFIELD BRANCH OFFICE (SA)
BRANCH OFFICE /
DISTRIBUTION
CENTRE (WA)
KALGOORLIE
BRANCH OFFICE BASSESNDEAN BRANCH OFFICE (WA)
(WA)
BUNBURY BRANCH
OFFICE (WA)
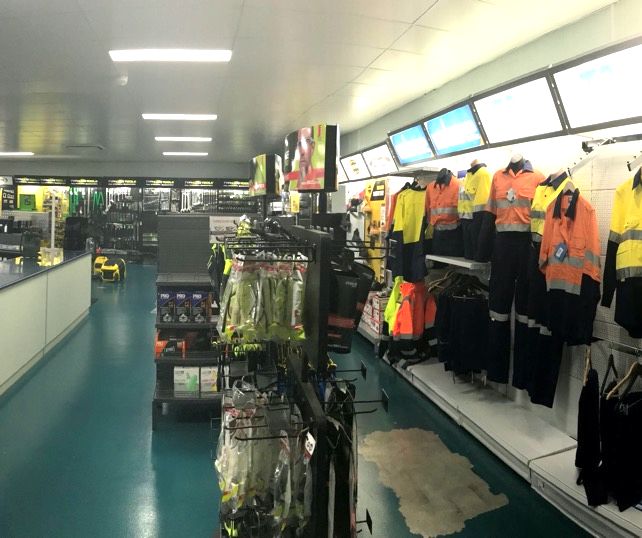
SGH Full Year Result Briefing Presentation FY20A Look Inside Of A Heatley's Trade Store and Distribution Centre
33
INSIDE OUR DISTRIBUTION CENTRES
INSIDE OUR TRADE STORES
SGH Full Year Result Briefing Presentation FY20A Look at BSA Brands (UK)
34
Launch May19
to 48 new customers
Instore
‘Trade Retail
Bristol
Birmingham
Shop’
Manchester
Edinburgh
London
(L to R – James Cartwright, Jo Dalton, Jessica Rich, Adam Sherwood,
David Gazal, Mike Arnold, Toni Westlake, Luke Cruskall, Jo Dyson)
Investment in
Customer Trade
Billboard Bus
Trade Days Shows
Advertising
SGH Full Year Result Briefing Presentation FY20Sales Channels and Customer Markets
Reaching our Customers Across Multiple Industries
35
Customers benefit from our vast selection of products, purchasing power, comprehensive distribution network, and the convenience of multiple choice for supply.
CONNECTING OUR VAST SELECTION OF & SERVICES ACROSS MULTIPLE SALES CHANNELS
MULTIPLE SALES
CHANNELS
Sales and Service By Phone Trade Branch Stores Affiliate Trade Stores Independent merchants' Affiliate Retail Stores Website 3rd party Catalogues
Representatives Internal sales and network partners Click & Collect eCommerce channels Webshops Vending Machines
Customer Service Pop Up Lockers Onsite Solutions
BUSINESS CUSTOMERS & RETAIL CUSTOMERS
Trade & Industry Resources
Resources Infrastructure Manufacturing Engineering Retail Consumers
MAIN CUSTOMER
MARKETS
Industrial Building/Construction Transportation Government Contractors Online Shoppers
SGH Full Year Result Briefing Presentation FY20Peer and Competitor Landscape Sample
36
E-Commerce
1
Competitors includes Amazon, Alibaba, eBay, Catch, Bunnings, Total Tools, Kogan, JD.com, Rakuten, etc…
Business Competitors (extremely fragmented)
2
Grainger, Bunzl, Blackwood’s, Atom, Metcash, Amazon, Arco, Brady, various procurement houses, independents.
Retail Competitors
3
Bunnings, Amazon, Metcash, Total Tools, Trade Stores, RSEA, Totally Workwear, Arco, Suppliers, etc.
Others
4
Various other category or service specific company types in the fragmented markets in which we operate.
SGH Full Year Result Briefing Presentation FY20LAST PAGE
Full Year Results Briefing
Presentation FY20
1 September 2020
ASX Code : SGI
37You can also read