No. 179 April - June 2021 - www.koreanre.co.kr - Korean Re
←
→
Page content transcription
If your browser does not render page correctly, please read the page content below
April - June 2021
                     No. 179

www.koreanre.co.kr
April - June 2021

                                                                                                       No. 179

                                      Korea’s GDP Growth in the First Quarter of 2021                                 3
                                      Korea’s Export Growth Performance and Prospect

                                      One Year of COVID-19: How the Pandemic Has Affected the Korean Economy

                                      Korea’s Default Risk at Lowest Since 2007

                                      Review of the Korean Insurance Market in 2020                                  11
                                      RBC Ratios of the Korean Insurance Industry as of December 2020

                                      Review of Overseas Business Operations of Korean Insurance Companies in 2020

                                      Initiatives to Make it Easier to Purchase Compulsory Fire Insurance

                                      Growth Trend of the Liability Insurance Market in Korea

                                      Korean Re's Business Results for 2020 and the First Quarter of 2021            21
                                      - Business Results for 2020
                                      - Business Results for the First Quarter of 2021

                                      Korean Re’s Internal Model Development Project

                                      Korean Re Insurance Webinar for the First Half of 2021

Quarterly Publication No. 179 in June 2021
Publisher : Jong-Gyu Won / Editor in Chief : Jin Hyung Lee
Published by Korean Re Research Institute of Insurance & Finance
Korean Reinsurance Company(www.koreanre.co.kr)
Korean
Economy

Bulletin | 01 Korean Economy

    Korea’s GDP Growth in the First Quarter of 2021

    The Korean Economy continued to gain recovery                       Equipment investment expanded by 6.1% during
    momentum in the first quarter of 2021. Its                          January – March, leading the faster-than-expected
    gross domestic product (GDP) increased by 1.7%                      recovery. Businesses spent more money on
    compared to the last quarter of 2020, allowing the                  production facilities in line with rises in global
    economy to get back to pre-pandemic levels. The                     demand and trade volume. Corporate investment
    primary drivers of growth were a strong rebound in                  spending increased solidly both in machinery and
    fixed investment and robust export performance.                     transportation facilities.
    Korea’s GDP expanded by 1.9% year on year,
    beating expectations of most economists.

                                                  Quarterly Economic Growth
                                                                                                                            (Unit: %)

                                                            2019                                     2020                    2021

                                             Q1       Q2           Q3        Q4       Q1       Q2           Q3      Q4        Q1
                                            -0.2       1.0          0.4       1.3     -1.3      -3.2      2.2        1.1       1.7
                     GDP
                                            (1.9)     (2.3)        (2.1)     (2.6)    (1.5)    (-2.6)   (-1.0)     (-1.1)     (1.9)
                                                                                                                               1.2
            Consumer Spending                0.2      0.7          0.5       0.9      -6.6      1.2         0.2    -1.3
                                                                                                                              (1.2)
                                                                                                                               1.6
           Government Spending               1.0      1.6          1.7       1.9      1.6       1.0         0.1    -0.4
                                                                                                                              (2.3)
                                                                                                                               1.3
          Construction Investment           -0.2      2.4          -3.3      5.3      0.1      -2.9         -3.9    3.5
                                                                                                                             (-1.8)
                                                                                                                              6.1
           Equipment Investment             -8.3      3.5          0.3       3.4      0.1       0.7         5.8    -0.6
                                                                                                                            (12.4)
            Intellectual Property                                                                                              0.2
                                             1.2      0.1          0.7       0.4      1.2       1.8         0.8     1.3
                 Investment                                                                                                   (4.2)
                                                                                                                               2.0
                    Exports                 -4.2      2.2          3.7       0.5      -0.8    -15.9     16.3        5.3
                                                                                                                              (5.1)
                                                                                                                               2.9
                    Imports                 -3.8      3.9          -0.1      -0.6     -2.6     -5.8         5.9     1.5
                                                                                                                              (4.1)

    *Figures in (   ) refer to year-on-year growth rates. Balance of payments basis data is used for exports.
    (Source: Bank of Korea, June 9, 2021)

    Korea’s exports also grew robustly in the first                     cars and chips helped the export-driven economy
    three months of 2021 amid growing shipments of                      perform relatively well throughout the COVID-19
    automobiles, semiconductors and mobile phones.                      pandemic.
    Strong global demand for its products such as

4
Private consumption recovered to a 1.2% increase           The brisk first-quarter GDP expansion led to 2021
after shrinking by 1.3% in the preceding quarter.          outlook upgrades by the Bank of Korea (BOK) and
The rebound was attributable mostly to eased               many other institutes. In May, the central bank
social distancing measures in February 2021. As            raised its economic growth outlook for 2021 to
consumer sentiment improved, there was a pickup            4% from its previous forecast of 3% in February.
in purchases of both durable goods such as cars            This upgraded outlook reflects improving global
and electronics and nondurable goods. In the               economic conditions thanks to the quickening pace
meantime, government spending rose by 1.6%                 of vaccination especially in advanced economies as
compared to a 0.4% decline three months earlier.           well as expectations that the country’s monetary
                                                           policy will stay mostly accommodative.

                                      Korea's GDP Growth (2012-2021(E))
                                                                                                    (Unit: %)

      5

                                                                                                      4.0
      4
                      3.2       3.2                            3.2
                                             2.8    2.9                  2.9
      3
            2.4
                                                                                  2.0
      2

      1

      0
           2012      2013      2014          2015   2016      2017      2018     2019      2020     2021(E)

     -1
                                                                                            -1.0

     -2

     (Source: Bank of Korea, May 27, 2021)

The BOK also made an upward adjustment of its              year depending on the pace of economic recovery.
inflationary forecast for 2021 to 1.8% from 1.3%.          The central bank has frozen its key interest rate at
Although inflationary pressure still remains low, the      0.5% since the rate was slashed to that record low
BOK signaled that a rate hike may come later this          level in May 2020.

                                                                                                                  5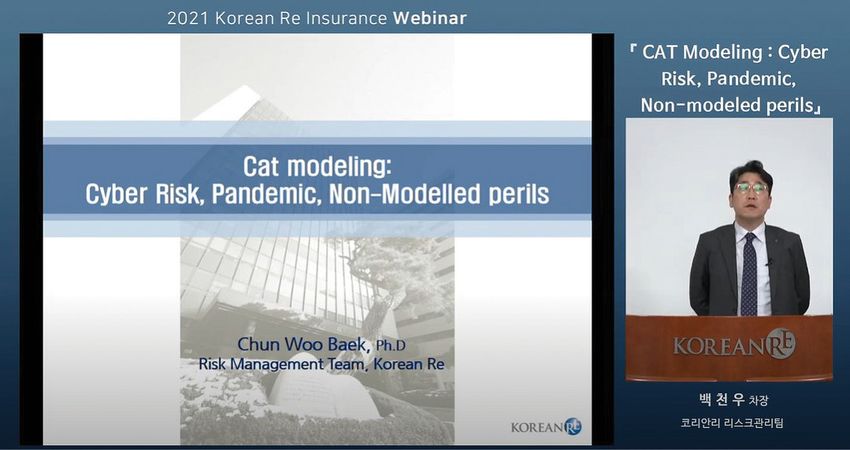
Bulletin | 01 Korean Economy

    Korea’s Export Growth Performance and Prospect

    Korea’s exports surged by 12.5% to USD 146.5                        external demand rising strongly on the back of
    billion in the first quarter of 2021 compared to a                  huge fiscal stimulus programs in many economies
    year earlier, recording the largest quarterly volume                around the world. Export recovery has continued
    since the fourth quarter of 2018. The automobile,                   for three quarters in a row since the third quarter
    shipbuilding, petrochemical, and semiconductor                      of 2020.
    industries led the robust growth of exports, with

                                   Korea's Exports and Export Price Index (2019-2021)
         (Unit: USD billion)
         150                                                                                                              102
                  100.1                                                                                          99.7
         145                                                                                                              100
                                98.4
         140                                                                                                              98
                                          95.7
                                                                                                                          96
         135                                             93.9                                          93.7
                                                                                                                          94
         130                                                        91.8
                                                                                              90.5                        92
         125
                                                                                                                 146.5    90
         120                                                                                           141.9
                                138.5                                            87.5
                                          134.7         136.4                                                             88
                  132.7
         115                                                        130.2                     130.1
                                                                                                                          86
         110                                                                                                              84
         105                                                                    110.3                                     82
         100                                                                                                              80
                Q1 2019        Q2 2019   Q3 2019      Q4 2019      Q1 2020    Q2 2020       Q3 2020   Q4 2020   Q1 2021

                                                  Exports (Left)       Export Price Index (Right)

         * Customs-basis trade data
         (Source: Export-Import Bank of Korea)

    Korea saw its exports to major trading partners                     fueled largely by demand for Korean bio-health
    such as China and the U.S. record double-digit                      products including COVID-19 test kits, and eco-
    growth in the January to March period of 2021.                      friendly cars amid strengthening environmental
    Exports to China jumped by 25%, which was partly                    regulations in the EU. Exports to the U.S. rose by
    driven by the low base in the first quarter of the                  19.9% thanks to strong growth in memory chips
    previous year when industrial activities had come                   and car sales as consumer sentiment improved on
    to an abrupt halt in China due to the COVID-19                      massive fiscal and monetary stimulus in the world’s
    pandemic. Korea’s trade with the EU also soared,                    biggest economy.
    with exports to the region growing by 24%. It was

6
The outlook for Korea’s second-quarter exports in the nation’s major export destinations as well
looks rosy as the export leading index for the April as a hike in export prices driven by rising prices
to June period increased to 125.5 compared to of international oil and DRAM, a type of random-
116.5 in the same period of last year and 121.1 in access semiconductor memory. In particular, the
the first three months of this year. Export gains prices of semiconductors are expected to remain
are expected to be a ten-year high of 35% in the under upward pressure as production capacity
second quarter of 2021. Korean exporters are likely seems to fall short of meeting rising demand.
to benefit from the economic recovery momentum
One Year of COVID-19: How the Pandemic Has Affected the Korean Economy
COVID-19 has caused a significant impact on the major impacts of COVID-19 on consumer spending,
Korean economy in many aspects, reducing its jobs, industry, and the overall economy in the year
real GDP growth by over 3%p. The Korea Institute that followed.
for Industrial Economics and Trade has traced the
COVID-19 Impacts on the Korean Economy
(Unit: %)
Classification Trend(A)* 2020(B) Gap (B - A)
Real GDP 2.8 -1.0 -3.7%p
Employment (thousand persons) 238 -219 -457
Private Consumption 2.5 -4.9 -7.4%p
Equipment Investment 2.6 6.8 4.2%p
By Expenditure Construction Investment 3.2 -0.1 -3.4%p
Exports 2.1 -2.5 -4.6%p
Imports 3.4 -3.8 -7.2%p
Manufacturing 2.4 -1.0 -3.4%p
By Industry
Services 3.1 -1.2 -4.3%p
* GDP trend estimates are the average annual growth rates of the previous five years, and the employment trend estimate
is the average growth rate of the previous three years.
(Source: Korea Institute for Industrial Economics and Trade, May 10, 2021)
7Bulletin | 01 Korean Economy
Private consumption and employment have borne a reduction of 460,000 jobs. This means that the
the brunt of the pandemic. Consumer spending economy was hit by the second biggest shock after
decreased by more than 7%p compared to the the Asian financial crisis in 1998 in terms of private
level that had been estimated without taking consumption and employment.
into account pandemic effects, while there was
Comparison of Impacts from Economic Crises
First Oil Crisis Second Oil Crisis Asian Financial COVID-19
(1975) (1980) Crisis (1998) Crisis (2020)
Impact on Real GDP (%p) -2.6 -12.3 -3.9 -3.7
Impact on Private Consumption (%p) -2.7 -7.39 -3.2 -7.41
Impact on Employment
-222 -316 -311 -457
(thousand persons)
Sharply reduced consumer spending has been biotechnology and semiconductor even enjoyed
associated with the fact that the service industry unexpected gains due to changes in lifestyles in the
has suffered greater demand shocks than the wake of the coronavirus pandemic. For instance,
manufacturing industry through the coronavirus demand for computers has soared in step with the
crisis. The pandemic had disproportionately huge rising trend of remote work and distance learning,
impacts on the service sectors, such as food and leading to a jump in sales of desktops, laptops and
beverages, accommodation, retail, and hospitality, computer chips.
because they traditionally depend on face-to-face
communications. The economy is now on track to recovery after
bottoming out in the second quarter of 2020, but
As such, the pandemic-induced economic shocks some sectors of the economy still remain tightly in
have turned out quite uneven by industry sector, Covid-19’s grip. In other words, while enthusiasm
and this was one of the most striking features is high about an economic rebound, there is some
of the recent recession. More so than any prior divergence in the pace of recovery by sector and
economic recession, the COVID-19 crisis has industry. The labor market, private consumption,
ravaged certain industries, like travel and transport, and the service industry are far from getting back
while leaving others relatively unscathed or less to normal.
impacted. Some sectors including online shopping,
8As opposed to those sectors, the manufacturing growth. In May 2021, Korea’s exports surged by
industry showed solid gains, with production 45.6% on-year, recording the sharpest expansion in
output rebounding to the pre-pandemic level. 32 years, as demand for Korean products including
Export recovery is also accelerating quickly, chips is rising.
providing strong momentum to overall economic
Korea’s Default Risk at Lowest Since 2007
Korea’s default risk dropped to the lowest level a type of insurance against default risk by a country
in mid-June 2021 since April 2007 in the midst or a company, and the CDS premium is a major
of indications that the economy was recovering indicator of credit risk on sovereign or corporate
fast from the pandemic. The country’s five-year debt. The lower the CDS premium is, the lower the
sovereign credit default swap (CDS) premium credit risk of the bond issuer is.
declined to a low of 18bp on June 14, 2021. A CDS is
Korea’s Five-Year CDS Premium
(Unit: bp)
30
25
20
15
July 2020 Oct 2020 Jan 2021 Apr 2021
(Source: www.worldgovernmentbonds.com)
9Bulletin | 01 Korean Economy
CDS Premium by Economy (as of May 5, 2021)
(Unit: bp)
Israel 41
Thailand 41
China 37
Spain 34
Hong Kong 33
Portugal 31
France 23
Korea 19
Canada 18
Japan 17
New Zealand 17
Australia 15
Ireland 15
Belgium 12
UK 12
Germany* 10
Denmark 8
Switzerland 7
0 5 10 15 20 25 30 35 40 45
* Other countries with the CDS premium of 10 bp include Norway, the U.S., Finland, the Netherlands, Sweden,
and Austria.
(Source: Ministry of Economy and Finance)
Korea saw its CDS premium reach as high as 57bp May 2020 and February 2021. Also, the foreign
on March 23, 2020 at the onset of the coronavirus exchange reserves that Korea held amounted
pandemic. Since then, it has stabilized to the pre- to USD 452.3 billion at the end of April 2021,
pandemic level, with the economy showing signs representing the 9th largest in the world.
of robust recovery. The recent decline in the CDS
premium is noteworthy as CDS premiums for many In addition, the country has maintained strong
other economies have been rising since April 2021. sovereign credit ratings from major international
As of early May 2021, Korea’s CDS premium was the credit rating agencies. Although 113 countries
17th lowest level globally and the lowest among around the world have experienced downgrades
emerging economies. of their ratings or rating outlooks since last year,
strong credit ratings on Korea have been affirmed
In spite of some shocks from COVID-19, the recently by S&P and Moody’s. In late April, S&P
Korean economy has remained relatively resilient Global Ratings affirmed South Korea’s credit rating
throughout the pandemic, demonstrating its at AA with a stable outlook, followed by Moody’s
strong fundamentals. Even during the peak of the affirmation of Aa2 with a stable outlook. The Aa2,
pandemic when global demand and trade volume or the third-highest on the Moody's rating table,
plunged, the country continued to post current has been kept in place for the country since 2015.
account surplus for ten months in a row between
10Insurance Market
Bulletin | 02 Insurance Market

   Review of the Korean Insurance Market in 2020

   In 2020, the COVID-19 pandemic caused partial               The insurance market showed a 4.3% increase in
   disruption to face-to-face marketing activities,            premium income to KRW 221.9 trillion in 2020,
   but insurance market growth in Korea was faster             according to preliminary figures released by
   than expected as government stimulus measures               the Financial Supervisory Service. Life insurance
   following the outbreak of COVID-19 provided a               premiums increased by 2% to KRW 119.6 trillion on
   temporary boost to the market. However, this                the back of savings insurance. Non-life insurance
   growth momentum is unlikely to last, with the               premiums expanded by 7% to KRW 102.3 trillion,
   impact of increased money supply being limited to           backed by growth in all lines of business. In
   boosting savings demand in the short-term rather            particular, motor insurance premiums grew by
   than creating broader insurance demand in the               11.6% to KRW 17.5 trillion thanks to rate increases
   long-term.                                                  in 2019 and early 2020 and rapidly expanding
                                                               online sales of motor insurance.

                                                       Premium Income
                                                                                                    (Unit: KRW trillion)

                                              2019                       2020                     Change (%)

           Life Insurers                     117.26                     119.58                       2.0

         Non-Life Insurers                    95.59                     102.32                       7.0

                Total                        212.85                     221.90                       4.3

   (Source: Financial Supervisory Service)

   Improved underwriting performance allowed the               3,454.4 billion. Their underwriting losses narrowed
   insurance industry to deliver increased net income          due to improved business results from savings
   results. Insurers’ net income jumped by 13.9% to            insurance and decreased reserving for guaranteed
   KRW 6,080.6 billion. Despite a decline in investment        businesses, such as guaranteed minimum death
   profit amid low interest rates, life insurers reported      benefits and annuity payouts.
   a 10.9% increase in net income, which totaled KRW

                                                         Net Income
                                                                                                    (Unit: KRW billion)

                                              2019                       2020                     Change (%)

           Life Insurers                     3,114.0                    3,454.4                      10.9

         Non-Life Insurers                   2,223.8                    2,626.2                      18.1

                Total                        5,337.8                    6,080.6                      13.9

   (Source: Financial Supervisory Service)
For non-life insurers as well, 2020 was a year of been a decrease in motor claims due to a reduced
strong bottom-line growth, with net income soaring use of vehicles amid social distancing. There has
by 18.1% to KRW 2,626.2 billion. This improvement also been a drop in outpatient visits to hospitals
was largely driven by reduced loss ratios of motor for non-urgent and elective medical treatments,
and long-term insurance lines. One of the many which temporarily brought down the loss ratios of
knock-on effects of the COVID-19 pandemic has accident and health insurance.
ROA and ROE
(Unit: %)
2019 2020 Change (%p)
Life Insurers 0.35 0.36 0.01
ROA Non-Life Insurers 0.72 0.79 0.07
Total 0.45 0.48 0.03
Life Insurers 3.87 3.76 -0.11
ROE Non-Life Insurers 5.48 5.87 0.39
Total 4.41 4.45 0.04
(Source: Financial Supervisory Service)
Total Assets and Shareholders’ Equity
(Unit: KRW trillion)
2019 2020 Change (%)
Life Insurers 918.16 977.28 6.4
Total Assets Non-Life Insurers 320.74 343.87 7.2
Total 1,238.91 1,321.15 6.6
Life Insurers 87.05 96.58 11.0
Shareholders’
Non-Life Insurers 42.95 46.51 8.3
Equity
Total 129.99 143.09 10.1
* Individual figures may not add up to the total shown due to rounding.
(Source: Financial Supervisory Service)
13Bulletin | 02 Insurance Market
In tandem with net income growth, the profitability KRW 1,321.2 trillion. Total shareholders’ equity of
indicators of the insurance industry also showed the insurance industry expanded by 10.1% to KRW
modest improvement in 2020. The return on 143.1 trillion, driven by an increase in retained
assets (ROA) ratio of insurers inched up to 0.48%, earnings and mark-to-market gains on available-
while the return on equity (ROE) ratio increased for-sale securities in a persistently low interest rate
to 4.45%. As of the end of 2020, total assets of the environment.
insurance industry rose by 6.6% year on year to
RBC Ratios of the Korean Insurance Industry as of December 2020
The average risk-based capital (RBC) ratio of their average RBC ratio decrease by 6.1%p to
insurance companies in Korea declined by 8.8%p 297.3%, while the ratio of non-life insurers went
quarter on quarter to 275.1% at the end of down by 13.5%p to 234.2%.
December 2020. Life insurance companies saw
RBC Ratios of Insurers in Korea
(Unit: %)
320
310 301.1 303.4
296.0 297.3
300 292.6
290 285.3 284.5
281.1
280 272.1 271.2 286.5 283.9
267.6 282.1
270 263.3 276.4 275.1
258.2 273.7
260 268.9 266.5
257.9 261.9 261.1 259.1
250 256.2
249.9 253.5 251.7
240 246.5 247.7
242.7 242.4 239.6 240.0
230 238.7 234.8 234.2
233.7
220
210
200
Dec Mar June Sep Dec Mar June Sep Dec Mar June Sep Dec
2017 2018 2019 2020
Life Insurers Average Non-Life Insurers
(Source: Financial Supervisory Service)
Insurance companies showed a growth in other at the end of December 2020 from 1.43% three
comprehensive income arising from stock price months earlier. As a result, the amount of available
gains, although mark-to-market gains on bonds capital increased by KRW 0.9 trillion to KRW 174.5
reduced due to an increase in interest rate. The trillion as of December 31, 2020.
yield on ten-year Korea Treasury rose to 1.71%
14Meanwhile, insurers saw their required capital exploring various options in terms of both capital
expand by KRW 2.2 trillion to KRW 63.4 trillion as requirements and available capital positions to
credit and market risk amounts grew in line with boost their RBC ratios.
increasing assets under management. The value of
insurers’ assets under management increased to The RBC ratio is a key measure of how financially
KRW 1,047.2 trillion at the end of the fourth quarter strong an insurer is, indicating its ability to absorb
of 2020 from KRW 1,034.3 trillion three months losses and pay insurance claims to policyholders.
before. Insurers are required to maintain the ratio at 100%
or above. The supervisory authorities monitor the
Solvency capital management has remained RBC ratios of insurers, and in case of any signs
one of the biggest challenges for the insurance of deterioration in the ratio, they will guide the
industry in Korea with the implementation of IFRS financially weakening insurer to take proactive
17 scheduled for 2023 along with a new risk-based actions such as more rigorous stress testing and
capital (RBC) regime called the Korean Insurance capital raising.
Capital Standards (K-ICS). Insurers have been
Changes in RBC Ratios of the Korean Insurance Industry
(Unit: KRW trillion)
Q3 2020 Q4 2020 Change in
As of Period End Available Required RBC Available Required RBC RBC Ratio
Capital Capital Ratio(%) Capital Capital Ratio(%) (%p)
Life Insurers 120.4 39.7 303.4 122.2 41.1 297.3 -6.1
Non-Life Insurers 53.2 21.5 247.7 52.3 22.3 234.2 -13.5
Total 173.6 61.2 283.9 174.5 63.4 275.1 -8.8
(Source: Financial Supervisory Service)
Review of Overseas Business Operations of Korean Insurance Companies in 2020
As of the end of 2020, ten insurers - three life and four in Indonesia and Vietnam each. Outside
insurers and seven non-life insurers - had 35 Asia, there are nine units in the United States and
overseas business units in 11 countries around the three in the United Kingdom. In 2020, two branches
world. Many of the overseas business operations of were newly established – one in China by Korean
Korean insurers are based in Asia with five in China Re and the other in Vietnam by Hanwha Life.
15Bulletin | 02 Insurance Market
Overseas Business Operations of Korean Insurers (as of Year End)
(Unit: Number of Offices)
2019 2020
Subsidiary Branch Total Subsidiary Branch Total
Life Insurers 6 - 6 7 - 7
Non-Life Insurers 18 10 28 17 11 28
Total 24 10 34 24 11 35
(Source: Financial Supervisory Service)
By type of business, there are 27 insurance branches. In addition to these subsidiaries and
business operations, while five entities are branches, there are 36 representative offices of
operating as financial investment businesses. Korean insurers in 12 jurisdictions around the
A subsidiary is the most common form of the globe.
overseas entities, with 24 subsidiaries and 11
Net Income of Overseas Business Operations of Korean Insurers (as of Year End)
(Unit: USD million)
Life Insurers Non-Life Insurers Total
2019 2020 2019 2020 2019 2020
Insurance 19.9 12.7 52.0 48.8 71.9 61.5
Financial Investment -2.1 -16.1 0.1 0.2 -2.0 -15.9
Total 17.8 -3.4 52.1 49.0 69.9 45.6
(Source: Financial Supervisory Service)
In 2020, the Korean insurance industry saw operations in Asia showed relatively good
their business results from overseas operations performance.
decline mostly due to the impact of COVID-19 on
their business. Their net income decreased by Life insurers suffered setbacks on the face-to-
34.8% year on year to USD 45.6 million. Insurance face marketing front in the wake of COVID-19, and
business operations recorded USD 61.5 million falling interest rates increased the value of the
in net income, down 14.5% from the previous liabilities, putting greater strain on life insurers.
year due to increased losses related to COVID-19. Non-life insurers experienced a rise in loss ratios
Financial investment operations remained in the due to civil disorder events in the U.S. and natural
red with a net loss of USD 15.9 million. Although catastrophes.
the business results varied by country to country,
16As of year-end, the total assets held by the overseas billion as non-life insurers experienced a drop in
business units of Korean insurers increased by 2.2% insurance claims payable. The amount of total
to USD 5.41 billion, representing 0.7% of their total equity jumped by 9.5% to USD 2.41 billion due to
assets. Despite an increase in technical reserves positive net income and additional capital injection
of life insurers, the liabilities declined to USD 3 for some entities.
Financial Position of Overseas Business Operations (as of Year End)
(Unit: USD million)
Life Insurers Non-Life Insurers Total
2019 2020 2019 2020 2019 2020
Assets 1,830 2,044 3,463 3,366 5,293 5,410
Liabilities 698 823 2,393 2,176 3,091 2,999
-Technical Reserves 611 737 1,521 1,619 2,132 2,356
Equity 1,132 1,221 1,070 1,190 2,202 2,411
(Source: Financial Supervisory Service)
Initiatives to Make it Easier to Purchase Compulsory Fire Insurance
In Korea, the compulsory fire insurance property damage caused by fire. Owners of special
requirement is imposed on property owners with buildings are required to buy necessary insurance
regard to specified types of buildings, defined as coverage under the Act on the Indemnification for
special buildings, which are at risk of large fire Fire-Caused Loss and the Purchase of Insurance
losses such as third party death, bodily injury, and Policies.
Compulsory Fire Insurance Coverage Types and Limits
Type of Damage Coverage Limit
Death: KRW 150 million
Third Party Bodily Injury and Death (per person) Permanent Disability: KRW 150 million
Bodily Injury: KRW 30 million
Third Party Property Damage (per event) KRW 1 billion
First Party Damage Applicable Sum Insured
(Source: Financial Services Commission)
17Bulletin | 02 Insurance Market
Under the compulsory fire insurance policy in Most of all, property owners find it challenging
Korea, the statutory third party liability limits and time-consuming to contact multiple insurance
are KRW 150 million per person for death and companies to figure out which insurers are willing
permanent disability, KRW 30 million for other to offer insurance coverage. Another challenge is
bodily injury, and KRW 1 billion per event for that insurers try to avoid accepting some special
damage to third party property. buildings because they are considered to present
extremely high risk. In particular, some chemical
The types of properties defined as special buildings plants, waste recycling, and plastic manufacturing
include the following: factories are declined by most insurers.
- Commercial buildings with 11 stories or more
In response, the Financial Services Commission
- Apartment complexes with at least one building
(FSC) is taking a set of measures to address those
of 16 stories or more and others of 15 stories or
issues. First of all, it is working with the Korean Fire
less
Protection Association (KFPA) to create and operate
- Buildings where areas above 2,000 square meters
a search system for fire insurance applications
are occupied by schools, department stores,
through which insurers can access applications
restaurants, supermarkets, cinemas, subway
that have been declined by other insurers. In
stations etc.
other words, when a prospective insurance buyer
- Railway stations, malls, markets, hospitals,
submits an application to a single insurer and that
educational establishments, factories, public
insurer declines to accept the application, other
venues, broadcasting stations, accommodation
insurers may access the application information
facilities and hotels above 3,000 square meters in
with the consent of the applicant and initiate their
floor area
underwriting process to evaluate the risk. This
- Government-owned buildings above 1,000 square
will make it easier for insurance buyers to get the
meters in floor area
insurance coverage as required by law without the
- Indoor shooting ranges
need to contact multiple insurers.
The scope of special buildings has been expanded
Secondly, the FSC approved a joint underwriting
to increase the fire insurance take-up rate and
agreement between the KFPA and non-life insurers,
to ensure that social safety net is strengthened
which allows them to collectively underwrite high-
against the risk of fire events. However, there are
risk businesses to provide insurance to those
some special buildings that are left uninsured
who may have difficulty obtaining coverage from
due to difficulties in obtaining relevant insurance
the standard market. Under this agreement, any
coverage. As of late November 2020, about 7%
applications that have not been accepted through
of 50,747 special buildings or 3,623 buildings
the search system will be automatically placed to
remained uninsured.
the joint underwriting group.
18Growth Trend of the Liability Insurance Market in Korea
The liability insurance market in Korea has been awareness prevented the market to grow and
growing fast amid rising awareness of liability develop. However, there has been an uptick in
coverage and the government’s initiatives to demand recently due to increasing incidences
introduce new compulsory insurance plans to of man-made disasters and growing interest in
reinforce protection of accident victims against the insurance covering the commercial sector against
costs of recovering from an accident that someone various business risks, such as negligence claims
else has caused. Traditionally, low demand for and cyber breaches.
liability coverage mostly resulting from a lack of
Trend of Liability Insurance Premiums (2016 - 2020)
(Unit: KRW billion)
Average Annual
2016 2017 2018 2019 2020
Growth Rate
General Liability 440.4 482.5 527.1 573.4 592.8 7.7%
Professional Liability 205.6 213.1 219.5 243.9 297.5 9.7%
Product Liability 145.4 141.9 159.2 187.3 234.7 12.7%
Total 791.3 837.6 905.9 1,004.6 1,124.9 9.2%
* Individual figures may not add up to the total shown due to rounding.
(Source: General Insurance Association of Korea)
There are three major lines of liability
Breakdown of the Liability Insurance
insurance, i.e. general liability,
Market in 2020
professional liability, and product
liability. The liability insurance market
was worth over KRW 1.1 trillion in
Product
terms of premium income as of late Liability
2020, up 12% from the previous year. 20.9%
General
General liability premiums increased
Liability
by 3.4% year on year to KRW 592.8 Professional 52.7%
billion, representing 53% of the entire Liability
liability market. Professional liability 26.4%
and product liability premiums rose by
22% and 25.3%, respectively to KRW
297.5 billion and KRW 234.7 billion. (Source: General Insurance Association of Korea)
19Bulletin | 02 Insurance Market
Liability Insurance Market Growth
(Unit: %)
30
25.3
25 22.0
20 17.6
15 12.2 12.0
10.9 11.1
9.6
10 8.2 9.3 8.8
5.8
5 3.7 3.0 3.4
0
-5 -2.4
2017 2018 2019 2020
Total General Liability Professional Liability Product Liability
(Source: General Insurance Association of Korea)
The demand for general liability is driven by a series 2020, the Ministry of Justice announced new bills
of newly introduced compulsory liability insurance to propose the enactment of the Class Action Act
policies, including liability for owners of dangerous that will expand the availability of class action
dogs in 2021, elevator operators’ liability, and cyber suits to all industries as well as the amendment of
liability for a wide range of personal data-handling the Commercial Act, which will allow for awards
organizations in 2019. The scope of properties of punitive damages for intentional or grossly
subject to compulsory man-made disaster liability negligent conduct in all commercial causes of
insurance was expanded in 2020 to include public action irrespective of industry. Currently, class
rental apartments and multi-family housing with action lawsuits are allowed only in relation to
15 stories or lower. Discussion is also currently certain areas including financial securities with
underway among government agencies regarding regard to violations like false disclosure and unfair
the need for compulsory insurance for users of practices. When the proposed legislative bills are
electric kickboards or scooters due to an increasing enacted into laws, the demand for directors and
number of road accidents involving such personal officers (D&O) liability insurance is expected to
mobility devices. increase significantly.
The professional liability insurance market is also As the market for professional liability insurance
expected to grow continuously as the number such as D&O coverage is largely affected by
of medical malpractice disputes has been rising, a changing social environment, demand is
leading medical professionals to take greater expected to keep growing in Korea alongside the
interest in obtaining insurance coverage against strengthening of consumer rights and consumer
malpractice claims. protection measures. Shifting toward a litigious
culture is another ongoing social development that
In addition, legislative changes may boost demand may drive up demand for liability coverage.
for professional liability insurance. In September
20Korean Re News
Bulletin | 03 Korean Re News

     Korean Re's Business Results for 2020 and the First Quarter of 2021

     Business Results for 2020

     Korean Re continued to grow its top line despite     In line with the rise in gross written premiums, our
     challenging market conditions in 2020. We            net written premiums expanded by 6.1% to KRW
     recorded a 4.1% growth in premium income, which      5,863.0 billion in 2020. The overall retention rate
     totaled KRW 8,377.1 billion, backed by our strong    increased slightly from 68.7% in 2019 to 70.0%
     position in the domestic market and rate hardening   in 2020 mainly due to our strategy to increase
     across overseas markets.                             retention of profitable reinsurance contracts.

     Following a robust growth of 7.5% in 2019, our       The underwriting results of Korean Re slightly
     overseas business grew by 8.6% in 2020, with         weakened in 2020 due to large losses in domestic
     gross written premiums reaching KRW 2,174.6          commercial lines and the COVID-19 impact on our
     billion. This higher growth was driven by market     overseas business. As a result, our combined ratio
     hardening effects and our effort to expand into      increased by 0.3%p to 100.3% for the year. Even
     non-property lines of business such as casualty,     though COVID-19 led to considerable losses on our
     motor and life.                                      overseas business, which amounted to KRW 48.2
                                                          billion, the combined ratio of our overseas business
     The growth rate of our domestic business             decreased from 99.7% in 2019 to 98.7% in 2020
     decreased to 2.7% in 2020 from 6.1% in the           thanks to a large decline in natural catastrophe
     previous year. Personal lines of business grew by    losses and rate increases. Tightened underwriting
     1.6% in 2020. The slower growth of personal lines    guidelines for marine and engineering lines and
     of business was the result of our profit-oriented    the expansion of casualty, motor, and life lines also
     underwriting strategy under which we remained        contributed to the improvement of profitability in
     highly selective in underwriting risky insurance     overseas business.
     products and non-renewed underperforming
     businesses.                                          The combined ratio of domestic commercial lines
                                                          surged to 99.7% for the year, up 6.5%p from the
     The growth of our domestic commercial business       prior year due to increases in the frequency of large
     slightly slowed to 4.4% in 2020 from 6.0% in 2019,   loss events and typhoon losses. The combined ratio
     but the traditional commercial portfolio excluding   of domestic personal lines improved to 101.2%
     crop and guarantee insurance showed a strong         in 2020 because of a stabilized loss ratio and rate
     growth rate of 12.2% thanks to the recent upward     increases. We expect that the profit-oriented
     movement of reinsurance pricing.                     growth strategy will be maintained and our efforts
                                                          to reduce participation in underperforming treaties
                                                          will help improve our combined ratio for 2021.

22
Our investment operations delivered strong results to maintain an asset mix that best reflects our risk
in 2020 due to an increase in profit from sale of and return profile. To this end, we have consistently
bonds by KRW 43.9 billion and a sound investment reduced our redundant holdings of short term
yield on loans. We recorded KRW 236.7 billion in funds and allocated more assets to senior loans
net investment income, with an investment yield of and alternative investment vehicles that can
3.8% in spite of some impairment losses including generate long-term stable investment income. We
KRW 9.0 billion for KDB Life equity invested in 2009. expect that asset allocation will be continuously
monitored and optimized flexibly considering
This solid investment yield came amid a persistently changes in economic environment and our risk
low yield investment climate. Since 2016, we have appetite.
focused on rebalancing our investment portfolio
Korean Re’s Business Results for 2020 and the First Quarter of 2021
(Unit: KRW billion)
2019 2020 Change (%) Q1 2020 Q1 2021 Change (%)
Gross Written Premiums 8,043.4 8,377.1 4.1 1,994.2 1,975.7 -0.9
Net Written Premiums 5,527.0 5,863.0 6.1 1,387.2 1,439.7 3.8
Underwriting Income -4.2 -25.2 - -3.6 12.4 -
Combined Ratio (%) 100.0 100.3 0.3%p 99.8 98.6 -1.2%p
- Loss Ratio (%) 85.6 85.7 0.1%p 87.4 85.3 -2.1%p
- Expense Ratio (%) 14.4 14.6 0.2%p 12.4 13.3 0.9%p
Investment Income 235.8 236.7 0.4 52.9 52.2 -1.3
Operating Income 238.7 219.1 -8.2 56.9 65.1 14.4
Net Income 191.2 150.4 -21.3 45.0 56.5 25.6
Operating Assets 6,220.7 6,417.6 3.2 6,129.9 6,443.4 5.1
Total Assets 11,708.7 12,411.6 6.0 12,034.6 12,223.0 1.6
Shareholders’ Equity 2,461.1 2,463.1 0.1 2,402.5 2,426.1 1.0
Return on Equity (%) 9.8 6.1 -3.7%p 7.4 9.4 2.0%p
* The above figures are based on the company’s separate financial statements.
** Excluding foreign currency evaluation effect: underwriting income, investment income, combined ratio.
23Bulletin | 03 Korean Re News
Business Results for the First Quarter of 2021
Korean Re delivered strong business results for the business. The contraction reflected non-renewal of
first quarter of 2021 with net income surging by unprofitable accounts in some territories and the
25.6% to KRW 56.5 billion. A combination of factors high base in the same period of the previous year
contributed to our bottom-line results, including due to large-volume processing of statements of
stable investment performance and improved accounts from overseas life business. However,
underwriting results driven by a decrease in the ongoing market hardening is expected to help
severity of large-loss events and a favorable pricing boost the top-line of our overseas business later
environment. We turned a profit with underwriting this year.
income of KRW 12.4 billion despite the recognition
of additional COVID-19 losses on our overseas We saw our domestic business grow by 1.7% in
business. The combined ratio improved to 98.6% the first three months of the year compared to the
compared to 99.8% a year earlier. Investment same period of the prior year. Commercial lines
income amounted to KRW 52.2 billion on the back of business showed some contraction in premium
of profit on loans and alternative investments, growth mostly due to the base effect from one-
generating an investment yield of 3.3%. off premium growth involving satellite launch
insurance in 2020. Personal lines of business
However, we suffered a setback in premium recovered to a 4.1% growth backed by long-term
growth. Our gross written premiums declined by and motor businesses, but we continued to stay
0.9% to KRW 1,975.7 billion in the first quarter focused on portfolio management to improve the
of 2021 due to a sharp reduction in overseas profitability of personal lines.
Combined Ratio
(Unit: %)
110.0
105.0 104.6
101.9 101.9
99.8
100.0 98.6
95.9
95.0
92.0
90.0 87.9
85.0
80.0
Commercial Personal Overseas Total
Jan - Mar 2020 Jan - Mar 2021
24Korean Re’s Internal Model Development Project
Korean Re has been working to develop internal account the nature and characteristics of their
models that can provide a more accurate and businesses. While the standard model applies
sophisticated picture of its insurance risk profile. pre-defined shock scenarios, the internal model
This development project is part of its efforts to uses risk multipliers based on a company-specific
deal preemptively with requirements under IFRS 17 risk profile. Insurers will be allowed to substitute
and the Korean Insurance Capital Standards called internal models for the standard model subject to
K-ICS, both of which are scheduled to take effect in supervisory approval.
2023.
The use of internal models is expected to help
K-ICS is based on the European Solvency II insurers precisely measure the risks they are
valuation system, and the parallel implementation exposed to. When internal models are fully
of K-ICS and IFRS 17 is expected to increase capital embedded in the management processes, they
requirements for insurers as they will be required will enable insurance companies to carry out
to apply the fair value approach in measuring important tasks more effectively such as risk capital
their insurance liabilities. Under the new solvency assessment, business performance monitoring,
regime where a principle-based approach is taken, and strategic asset allocation. Recognizing these
insurers are encouraged to establish and use benefits of using internal models, Korean Re plans
internal models along with the standard model to build robust internal models by the end of
as internal models allow a better assessment January 2022.
of the risks of individual companies, taking into
Korean Re Insurance Webinar for the First Half of 2021
On May 21, Korean Re held its first insurance the business of personal data management
webinar for 2021 to promote discussion about so called MyData and its implications for the
latest market issues and trends including the rise of financial services industry. A prominent professor
artificial intelligence (AI) and catastrophe modeling. from Kyung Hee University gave a lecture on the
Over 280 persons from the local insurance industry concept of MyData and five different business
attended the webinar, which was designed to models involving MyData. He also discussed the
help participants improve their understanding of importance of getting the hang of the MyData
key topics for the insurance market and provide business for financial companies. As personal
insights into important market developments. data has increasingly significant value from social,
economic, and practical perspectives, the MyData
The webinar consisted of three sessions where business has been attracting a great deal of
each speaker gave an informative presentation interest across industries, making the session on
on a different topic. The first session was about this topic all the more meaningful.
25Bulletin | 03 Korean Re News
For the second session, a distinguished professor The third session was about catastrophe (CAT)
from Seoul National University gave a presentation modeling, a follow-up to last year’s webinar
on the artificial intelligence industry in the context session. A deputy general manager from the
of the Digital New Deal, one of the two major Risk Management Team of Korean Re delivered a
pillars of the Korean New Deal that the Korean presentation on the topic of Cat Modeling: Cyber
government announced to spur economic growth Risk, Pandemic, and Non-Modeled Perils. Cyber risk
and innovation. The Digital New Deal aims to and pandemics are recognized among the most
transition Korea to a digital economy that centers alarming risks by businesses, and the modeling
on technologies such as AI and big data. He shed of such risks has become an important topic for
light on what social and economic changes are those who want and need to reinforce their risk
being brought about by the development of AI and management. The speaker addressed how cyber
what the future of AI will look like, while discussing risk and pandemic models work and elaborated
the need for companies to build competitiveness in on types of non-modeled risk, stressing the
AI-based business capabilities. importance of understanding and managing non-
modeled catastrophe risks.
26HEAD OFFICE
68 Jongno 5 Gil, Jongno-gu, Seoul, 03151, Korea
Tel : (82-2) 3702-6000
Fax : (82-2) 3210-8801
http://www.koreanre.co.kr
Singapore Branch London Liaison Office Bogota Liaison Office
8 Cross Street, #09-02/03 Manulife Tower Room No.703, Gallery 7 of Lloyd’s Carrera 9 No. 77 - 67
Singapore 048424 1986 B/D, One Lime Street, Oficina 406 - Edificio Torre Unika,
Tel : (65) 6227-6411 London EC3M 7HA, UK Bogotá D.C. - Colombia
Fax : (65) 6227-2778 Tel : (44-20) 7265-0031 Tel : (57-1) 746-4521
E-mail : singapore@koreanre.co.kr Fax : (44-20) 7481-8412 E-mail : bogota@koreanre.co.kr
E-mail : london@koreanre.co.kr
Labuan Branch Tokyo Liaison Office Worldwide Insurance Services Ltd.
Brighton Place, Lot U0213-U0215, Marunouchi Mitsui Building 5th Fl. No. 508 Suite 3606, 36/F. Central Plaza
Jalan Bahasa 87000 Labuan F.T. Malaysia 2-2-2 Marunouchi, Chiyoda-ku, 18 Harbour Road, Wanchai, Hong Kong
Tel : (65) 6227-6411 Tokyo, Japan Tel : (852) 2877-3117, 3127
Fax : (65) 6227-2778 Tel : (81-3) 3201-1673 Fax : (852) 2877-2019
E-mail : singapore@koreanre.co.kr Fax : (81-3) 3215-5585 E-mail : mailbox@wis.com.hk
E-mail : tokyo@koreanre.co.kr
Dubai (DIFC) Branch New York Liaison Office Korean Re Underwriting Ltd.
Unit 1102B, Level 11, Gate Building (East), 295 Madison Avenue, suite 1808, Room No.703, Gallery 7 of Lloyd’s
DIFC, Dubai, UAE PO Box 506869 New York, NY 10017, U.S.A. 1986 B/D, One Lime Street,
Tel : (971-4) 355-5028 Tel : (1-212) 233-3252, 3 London EC3M 7HA, UK
Fax : (971-4) 355-0788 Fax : (1-212) 349-0210 Tel : (44-20) 7265-0031
E-mail : dubai@koreanre.co.kr E-mail : newyork@koreanre.co.kr Fax : (44-20) 7481-8412
E-mail : london@koreanre.co.kr
Shanghai Branch Beijing Liaison Office Korean Reinsurance Switzerland AG
4702 Jinmao Tower, 88 Century Avenue, Unit 10F-A2, Merchants Tower, Brandschenkestrasse 47, CH 8002 Zürich,
Pudong New Area, Shanghai, Jianguo Road No. 118, Chaoyang District, Switzerland
China P.C. 200121 Beijing 100022 China Tel : 41(0) 43-336-2060
Tel : (86-21) 5888-7879 Tel : (86-10) 6590-6276, 6277 Fax : 41(0) 43-336-2061
Email : shanghai@koreanre.co.kr Fax : (86-10) 6590-6278 Email : info@koreanre.ch
E-mail : beijing@koreanre.co.kr https://www.koreanre.ch
Disclaimer
Although utmost care has been taken to ensure the accuracy and reliability of the information used in this publication,
Korean Re assumes no responsibility therefore. No information provided constitutes, or shall be taken to reflect, Korean
Re’s position. The information does not constitute any recommendation or advice to effect any transaction or legal act of
any kind whatsoever, and in no event shall Korean Re be liable for the consequences of use of such information, nor for any
infringement of third party intellectual property rights which may result from its use.You can also read