INVESTOR REPORT - Wilson Realty
←
→
Page content transcription
If your browser does not render page correctly, please read the page content below
I N V E S TO R R E P ORT

“ Wa t e r f o r d ” , Wa t e r f o r d C o u r t , B u n d a l l , Q L D
I M P ORTA N T N O T I C E S

2
    U P DAT E D I N F O R M AT I O N                       A S H TO N R O W E O N LY C O N D U C T
                                                           R E S E A R C H A N D D O N OT AC T A S A S A L E S
    Information may be subject to change from time to      AG E N T
    time and updated information can be obtained at
    any time by contacting Ashton Rowe on                  Ashton Rowe conduct comprehensive commercial
    info@ashtonrowe.com.au or visiting our website,        and residential property research only. Ashton
    www.ashtonrowe.com.au.                                 Rowe do not act as sales agents on behalf of
                                                           developers or any real estate agents. Ashton Rowe
    DISCLAIMER                                             are remunerated for the Investor Report only.

    Whilst this information has been carefully             T H I S I S N OT I N V E S T M E N T A DV I C E . YO U
    compiled, no warranty or promise as to its             S H O U L D S E E K YO U R O W N F I N A N C I A L
    correctness is made or intended. The information       A DV I C E
    outlined within this document also represents
    subjective interpretation by Ashton Rowe               This report does not take into account the
    (ACN 144 714 509) and should not be relied upon        investment objectives, financial situation and
    for investment decisions. Interested parties should    particular needs of investors. It is important
    undertake independent inquiries and investigations     that you read the entire document and any
    to satisfy themselves that any details herein are      supplementary amendments in full before making
    true and correct. No forecasts are being made by       any investment decisions. It is particularly
    Ashton Rowe about potential investment returns.        important that you consider the risk factors that
    Past information about yield and growth does           could affect the financial performance of the
    not imply that such gains or growth will be made       property. You should carefully consider these
    in the future. The material in this publication is     factors in light of your particular investment needs,
    copyright. This document cannot be reproduced          objectives and financial circumstances (including
    without the express permission of Ashton Rowe.         financial and taxation issues) and seek professional
                                                           advice from your own professional advisors before
    Date compiled 5 June 2014.                             deciding to invest.

    The product and pricing information contained          INTEGRITY OF THE CONTENT
    within this document is based on price lists and
    third party information obtained throughout            While Ashton Rowe believe it is unlikely that the
    the course of our research. This information has       electronic version of the report will be tampered
    been verified to the best of our ability, but Ashton   with or altered in any way, Ashton Rowe cannot
    Rowe accept no responsibility for reliance on this     give any absolute assurance that this will not occur.
    information. This information has been prepared        Any investor in doubt concerning the validity or
    independent of the vendor and at our own               integrity of an electronic copy of the report should
    discretion.                                            immediately request a paper copy of the document
                                                           directly from Ashton Rowe.

                                                           U S E F U L I N F O R M AT I O N

                                                           Throughout this report certain defined terms are used.
                                                           Defined terms appear in the glossary in Appendix F.
                                                           All financial amounts in this report are expressed in
                                                           Australian Dollars ($AUD) unless otherwise stated.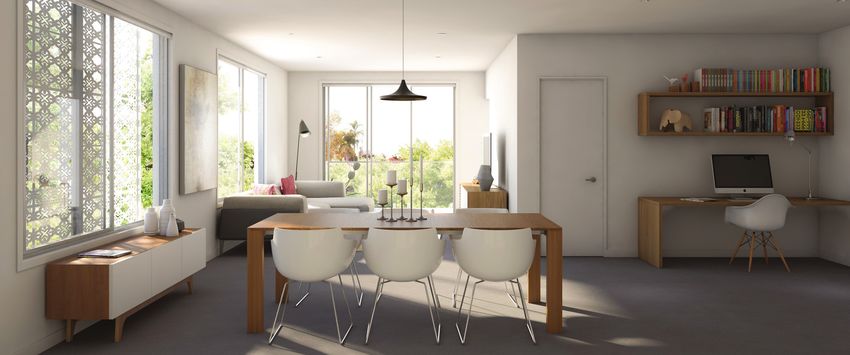
CONTENTS
                                                                                 1

S E C T I ON I       E X E C U T I V E S U M M A RY                          2

S E C T I ON I I     OV E RV I E W O F P R O P E R T Y                       4

S E C T I ON I I I   L O CAT I O N                                           6

S E C T I ON I V     M A R K E T A N A LY S I S                              7

S E C T I ON V       PROJECT TEAM                                           10

S E C T I ON V I     E X A M P L E CA S H F L O W R E Q U I R E M E N T S   12

S E C T I ON V I I   S E N S I T I V I T Y A N A LY S I S                   14

APPENDIX A           T Y P I CA L F L O O R P L A N S                       18

APPENDIX B           FIXTURES & FITTINGS                                    22

APPENDIX C           I N D E P E N D E N T R E N TA L A P P R A I S A L     23

APPENDIX D           D E P R E C I AT I O N S C H E D U L E                 25

APPENDIX E           UNIT ENTITLEMENTS                                      29

APPENDIX F           A D D I T I O N A L I N F O R M AT I O N               32
S E C T I ON I

                 S E C T I ON I

                 E X E C U T I V E S U M M A RY
    2
                 A S H TO N R O W E I S O N E O F AU S T R A L I A’ S L E A D I N G P R O P E R T Y R E S E A R C H A N D I N V E S T M E N T F I R M S
                 S P E C I A L I S I N G I N R E S I D E N T I A L P R O P E R T Y.

                 This report is designed to assist potential investment buyers in the selection and understanding of suitable residential
                 investment properties. Our experienced research analysts have conducted extensive and objective research culminating in this
                 Investor Report. This report analyses and validates investment opportunities based purely on their investment fundamentals
                 and seeks to identify properties with a solid combination of capital growth potential, rental yield and risk.

                 C A P I TA L G R O W T H ( U N I T S )

                   LAST THREE YEARS*                                   LAST 12 MONTHS*                              L O N G T E R M F O R E CA S T *

                   -1.0% per annum                                      9.9%                                        2% per annum

                 *Source: Ashton Rowe Research and Residex Bundall Report March 2013

                 The average rate of capital growth for units in Bundall over the last three years was -1.0% per annum, slightly below
                 the 10 year average of 0.8%. The Bundall residential unit market has underperformed the Brisbane metropolitan
                 unit market over the last three years by an average of 0.9% per year.

                 R E N TA L Y I E L D ( U N I T S )

                   C U R R E N T AV E R AG E Y I E L D                                              E S T I M AT E D G R O S S Y I E L D S O F I N V E S T M E N T
                                                                                                    U N I T S I N WAT E R F O R D *

                   6.8%                                                                             5.7%
                 Source: Ashton Rowe Research and Residex Bundall Report March 2014. * Based on the average price of 1 bedroom plus Study units in the project and rental appraisals
                 provided by local agents in the appendix.

                 Over the last 10 years, the average rental yield for units in Bundall was 6.0%, slightly below the current yield of 6.8%

                 The yields shown above are based on today’s market rates. Potential gross yields for units in the project are based on
                 the current price list of units in that development and independent rental appraisals performed by local real estate
                 agents (see Appendix D).

                 MARKET DRIVERS

                   R E C OV E RY P H A S E             Bundall indeed South East QLD is in the recovery phase of the property cycle placing
                   OF PROPERTY                         it in good stead to achieve growth over the short term in an environment of stable
                   CYCLE                               interest rates.

                   E M P L OY M E N T                  The workforce on the Gold Coast is forecast to expand by 50.6% from 236,395 in 2011
                   GROWTH                              to 355,895 by 2031.

                   INFRASTRUCTURE                      Major projects including Commonwealth Game Preparation, Broadwater Marine
                   INVESTMENT                          Project and the Gold Coast Hospital Site. The commonwealth Games alone are
                                                       estimated to generate approximately $2 billion for the economy and up to 30,000 full
                                                       time equivalent jobs.

                   AFFORDABILITY                       The Bundall market is on average 8% cheaper than the surrounding suburbs of
                                                       Ashmore, Benowa, Broadbeach waters, Southport and Surfers Paradise. Furthermore
                                                       Bundall Units are currently 22% below the Brisbane Metropolitan average.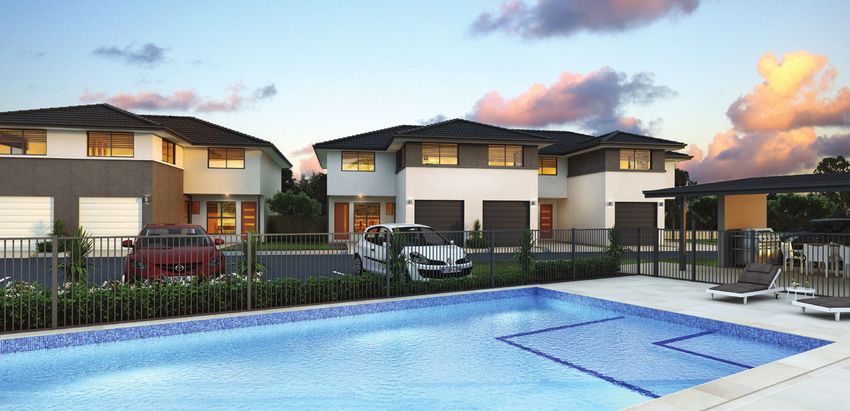
S E C T I ON I
                                                                                                                                                                3
D E V E L OP M E N T E S S E N T I A L S

  ADDRESS                                                       Waterford Court, Bundall

  L O CAT I O N                                                 5.0km South West of Main Beach Surfers Paradise

  DEVELOPMENT TEAM                                              Developer: Matthews Property Group

  TOTA L U N I T S                                              Stage 1: 68 Units

  FIXTURES AND FITTINGS                                         Reverse cycle split system air conditioning to living area and main
                                                                bedroom plus ducted ventilation exhaust for bathroom, Security
                                                                intercom, Delonghi appliances

  S H A R E D FAC I L I T I E S                                 Pool and BBQ area (to be completed in stage 2)

  PA R K I N G & S TO R AG E                                    Dedicated and secure basement storage with undercover parking

  P R OX I M I T Y TO L O CA L A M E N I T I E S                Transport:                          Good
                                                                Retail & Dining:                    Excellent
                                                                Recreation:                         Excellent
                                                                Entertainment:                      Excellent
                                                                Community:                          Excellent
                                                                Medical Facilities:                 Good
                                                                Education:                          Excellent

  OWNERS CORPORATION (STRATA                                    $794.75 - $865.36
  LEVIES) (PER QUARTER)*

  E S T I M AT E D R AT E S                                     Council:                            $400.00*
  (PER QUARTER)**                                               Water and Sewer:                    $297.75 plus consumption

  CONSTRUCTION TIMES                                            January 2015 – December 2015

  S U N S E T C L AU S E                                        36 months after completion

  F I R B A P P R OVA L                                         Purchasers to apply independently
* These figures are an estimate only based on Gold Coast City Council Revenue Statement 2014-2014. Rates based on category 2a permanent rental. Consumption
charged at 3.53 cents per kiloliter.

I N V E S T M E N T O U T L O OK

The Bundall residential unit market remains healthily supported by its high level of amenity, proximity to education
facilities and tight rental market conditions. These factors combined with the measured release of future unit development
and the region entering the recovery phase of the cycle, should see prices increase in the short term.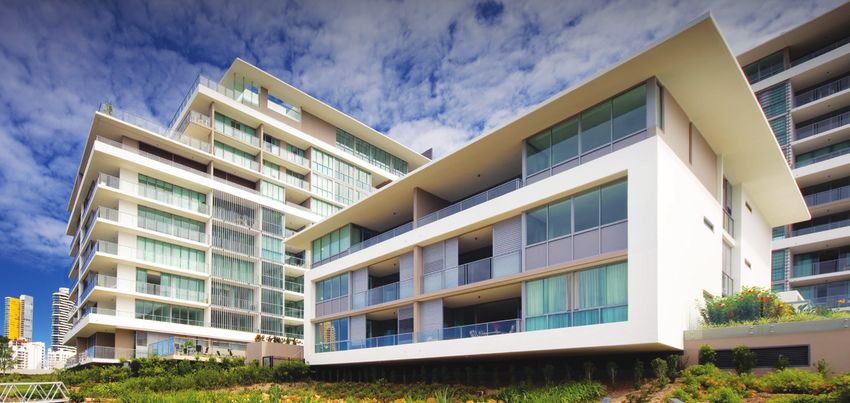
S E C T I ON I I
S E C T I ON I I
OV E RV I E W O F P R O P E R T Y
4
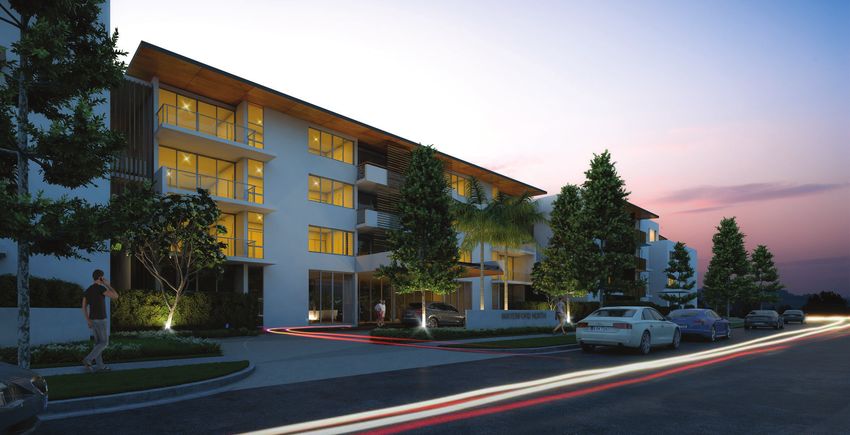
Located 9 minutes from Pacific Fair Shopping Centre, Waterford is a modern 3 level, architecturally designed
apartment building predominately made up of 1 and 2 bedroom apartments. Many apartments enjoy canal views
whilst all feature indoor-outdoor living, efficient floor plans and ceasarstone benchtops.
TYPE INTERNAL EXTERNAL PA R K I N G S TO R AG E PRICE RANGE
AREA AREA
1 BED 58m2 6 - 27m2 Yes Yes $297,900 - $299,900
1 BED + STUDY 57 - 81m2 10 - 59m2 Yes Yes $297,900 - $355,900
2 BED 73m2 9 - 21m2 Yes Yes $409,900 - $419,900
2 BED + STUDY 88m2 9 - 22m2 Yes Yes $409,900 - $419,900
* Sales prices as at 20 May 2014 stage 1 only
Public Transport
Bank
Shopping
Cinema/THEATRE
Entertainment/Bars
Restaurants/Cafes
Open Space
Sport/Recreation
Golf
Medical
School/university
Post Office
Library
Police
Scale 500m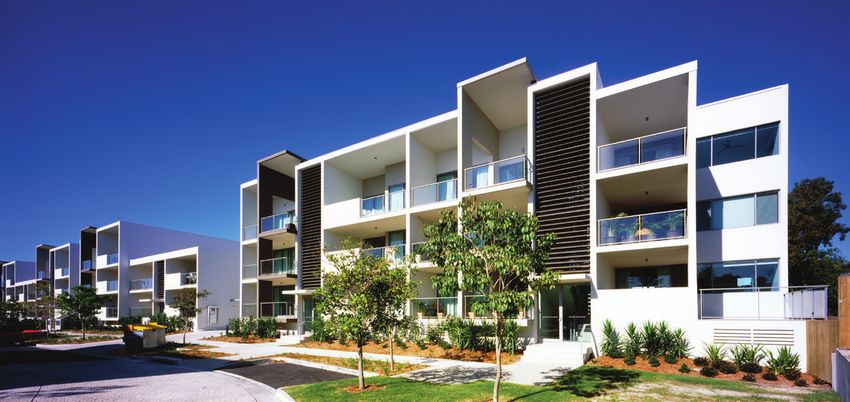
S E C T I ON I I
                                                                                                                       5
P R O X I M I T Y TO L O C A L A M E N I T I E S

The proximity of a variety of local amenities is vital when considering the suitability of an investment property
as these amenities are attractive to prospective tenants. Ashton Rowe classifies its Proximity Ratings by a
combination of distance, quality and quantity on a scale of Excellent - Good - Average - Below Average.

 TRANSPORT (GOOD)

 Local bus routes (to CBD and surrounding neighborhood area)                                   1.1km

 Gold Coast Highway                                                                            3.9km

 Pacific Motorway                                                                              8.0km

 R E TA I L & D I N I N G ( E X C E L L E N T )

 Chevron Island Precinct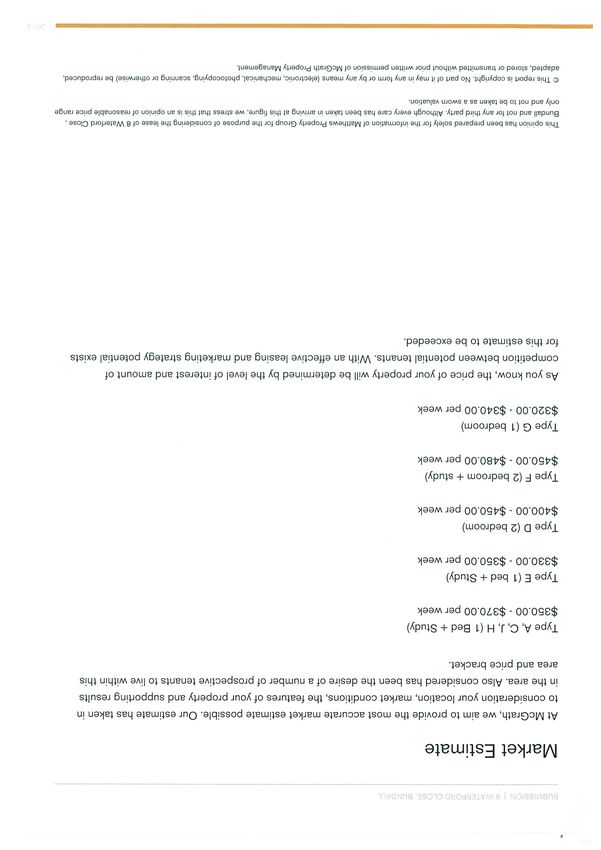
S E C T I ON I I I

                     S E C T I ON I I I

                     L O CAT I O N
      6

                                                                                              Southport

                            QUEENSLAND                                              Ashmore

                                                                                                                M7
                                                    Gold Coast
                                                                               4                                     Surfer’s Paradise
                                                                                          8 WATERFORD CT

                                                                                         Benowa
                                                                                                  Bundall
                                                                               90
                                                                                                                 3

                                                                                                      Broadbeach Waters

                     Located minutes to the heart of main beach Surfers Paradise, Bundall celebrates a global community set amongst
                     the Arts and entertainment quarters of the Gold Coast. Bundall is surrounded by the suburbs of Southport, Surfers
                     Paradise, Benowa and Ashmore.

                     Bundall enjoys all the benefits of Surfers Paradise with regard to quality of life, events and connectivity to beaches
                     whilst maintaining a quiet atmosphere.

                     An analysis of the jobs held by the resident population of Bundall in 2011 shows the three most popular occupation
                     sectors were:

                     • Professionals (431 persons or 21%)
                     • Managers (369 persons or 18%)
                     • Sales Workers (295 persons or 14%)

                     In combination these three occupations accounted for 53% of the employed resident population. On closer analysis
                     of the industries to which these occupations apply, the highest concentration is in Café’s and restaurants (5%),
                     Legal and accounting (4%) followed by Education (3%) The suburb of Bundall is therefore well diversified across
                     industries and has very little exposure to industry specific economic shocks.

                     S U M M A RY
                     • Stands to benefit from major nearby infrastructure investment
                     • Central to major education institutions.
                     • Walking distance to the entertainment and arts precincts.
                     • Appealing blue chip locale with 85% of households paying less than 30% of household income towards the
                        mortgage.
S E C T I ON I V
S E C T I ON I V

M A R K E T A N A LY S I S
                                                                                                                              7

M A C R O - E C ON O M I C M A R K E T A S S E S S M E N T

The global growth slowdown over the last financial year has cleared the way for a continuation of the global recovery
in the near term. Global monetary conditions remaining easy coupled with fiscal tightening across Europe and the
US coming to an end should underpin growth assets in the near term.

In light of cyclical patterns since the 1970’s, (major recessions every 8-10 years with modest growth slowdowns in-
between) Australia remains in a positive part of the cycle. With the resources boom coming to an end, and growth
in China softening, Australia’s position has deteriorated slightly from a year ago. While we expect slower economic
growth over the next 12 months, we are positive that the falling Australian dollar in an environment of stable or
falling interest rates should stimulate areas of the economy such as retail and manufacturing. This, in turn, would fill
some of the gap left by lower mining investment.

G OL D C O A S T M A R K E T A S S E S S M E N T

CA P I TA L G R O W T H

The Gold Coast has underperformed the other major capital cities since 2008 and is now showing signs of
acceleration with dwelling values increasing by 6.6% over the last 12 months for the year ending April 2014. This
subdued performance has taken median house and unit prices to $478,000 and $340,000 respectively. We expect this
market (alongside Adelaide) to be the outperforming regions in the near term with affordability and rental yields
being the primary drivers.

R E N TA L G R O W T H , VACA N C Y A N D A F F O R DA B I L I T Y
Turning our focus to the rental market, residential vacancy rates remain at healthy levels in the tourism centres.
The Gold Coast recorded a tighter vacancy rate, down 0.4 percentage points to 1.9% since September.

Median weekly rents on the Gold Coast have been steadily increasing since the start of 2013, with three bedroom
houses up $20 to $420 per week between December 2012 and December last year – the highest increase in over four
years where median rents have hovered around $400. The median rent of a two-bedroom unit on the Gold Coast
increased $15 per week to $355 over the same period.

With tight rental supply evident in current but un-finalised data, Ashton Rowe expects vacancy rates to remain at
current levels over the next quarter.1

P O P U L AT I O N G R O W T H A N D S U P P LY
Over the last year, there were approximately 2,532 dwellings (1,265 houses and 1,267 units) approved up 258 from
the previous year however 18% lower than the 5-year average. Although this indicates under supply (in the unit
market), the rates of growth achieved in the housing and unit markets are not typical of a market with too little
stock. This evidence coupled with tight vacancy, improving yields and rising sales volumes points towards the region
entering its recovery period in the cycle. In light of this Ashton Rowe has an optimistic outlook for the region.

E M P L OY M E N T G R O W T H
The workforce on the Gold Coast is forecast to expand by 50.6% from 236,395 in 2011 to 355,895 by 2031. As a
share of total Queensland employment, the Gold Coast region has recorded a gradual rise over the past decade from
10.6% in 2001 to 11.4% in 2011.

1        REI NSW December Quarter; Housing NSW December Quarter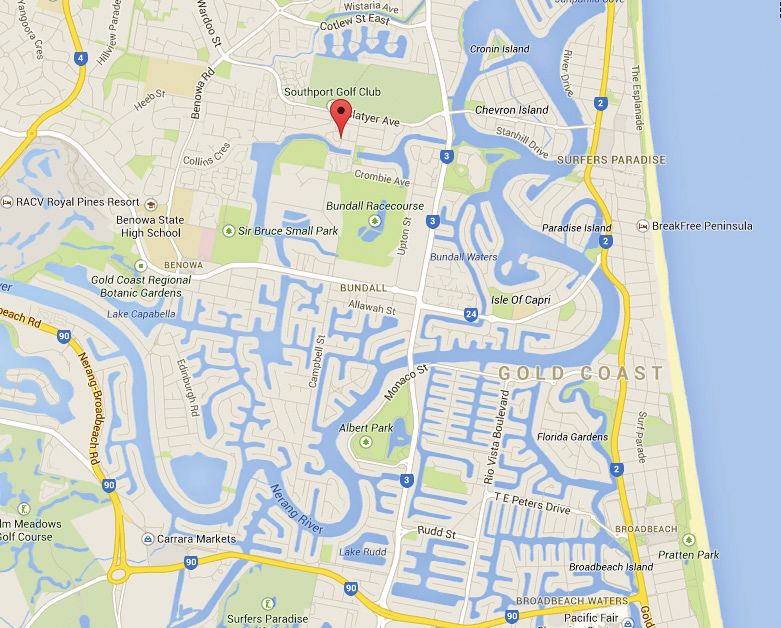
S E C T I ON I V

      8

                   At an industry level, by 2031 the Health Care and Social Assistance, Retail Trade and Accommodation industry
                   sectors are projected to account for the largest employing industries while the largest growth sectors are expected
                   to be Health Care, Mining and Finance and Insurance. In light of Bundall’s employment demographic, it stands to
                   benefit from these growth sectors.2

                   INFRASTRUCTURE AND INVESTMENT
                   The QLD government has released its infrastructure strategy and with it committed funding to certain initiatives
                   throughout QLD and in particular the South East corridor and Gold Coast. These initiatives will have significant
                   short term boosts to employment and long-term benefits to the community as a whole.

                   The Gold Coast 2018 Commonwealth Games (GC2018) will be hosted across a range of new, upgraded and existing
                   sporting venues across the Gold Coast, Brisbane, Cairns and Townsville and will generate approximately $2 billion
                   for the economy and up to 30,000 full time equivalent jobs. Relevant to the Gold Coast however there will be $41
                   million redevelopment of the Southport pool complex, brand new Sports and Leisure Precinct at Carrara and a $38
                   million sports and Leisure Centre at Coomera. Major upgrades will be given to the Gold Coast Hockey Centre,
                   Broadbeach Bowls Club and the Belmont Shooting Centre.

                   The Broadwater Marine Project is a joint initiative of the Queensland Government and Gold Coast City Council
                   seeking private sector investment to deliver what could be the largest integrated tourism development in Queensland’s
                   history. Although in its early stages, it is envisaged include a cruise ship terminal on the Southport Broadwater.

                   The government has now declared the Southport Priority Development Area, which encompasses the Gold Coast
                   Hospital site. Tenders are underway for it demolition which is expected to commence mid-2014. It is envisaged
                   that future development on the site will include a mix of uses including retail, offices, restaurants and apartments.3

                   BUNDALL UNIT MARKET ASSESSMENT
                   In the 3 months to March 2014, the established market saw 32 (down from 41 in same period last year) units sold in the
                   suburb while absorption levels for new dwellings have shown medium levels of uptake. Over the three years to March
                   2014, Bundall has underperformed the wider Brisbane metropolitan unit market by an average of 0.9% per annum.

                             CAPITAL GROWTH (units) – Bundall v Brisbane
                             years ending december 2014

                                9.9%
                                                                                                                      5.0%
                                          -3.3%                     -12.4%      -1.8%                      0.9%                                  -2.9%     -0.3%

                                   MAR 2012                                                                  MAR 2014                                TOTAL

                                                                       MAR 2013
                                                                         Bundall Units                                  Brisbane Units

                   Capital Growth Calculation: In short, the calculation methodology takes “sale pairs” for every property that has at least two sales recorded. These individu-
                   al property growth rates are then combined into a complete growth rate for the chosen suburb. The development of this methodology won an international
                   actuarial award in 1992. More recently, a paper issued by the Reserve Bank of Australia (Australian House Prices: A Comparison of Hedonic and Repeat-
                   sales Measures, James Hansen, 2006) confirmed this methodology to be superior to those based on simple movements in median price.
                   For more visit www.ashtonrowe.com.au

                   Source: Ashton Rowe Research and Investment

                   2            Regional Development Australia Gold Coast Inc.
                   3            Department of State Development, Infrastructure and Planning
S E C T I ON I V
9
R E N TA L Y I E L D S
The median rental yield for units in Bundall was 6.8% at the end of March 2014, well above the 10-year average of 6.0%.
The firm rental market conditions (3.2% vacancy rate) will begin to be eroded in the short term courtesy of capital values
outstripping rental increases characteristic of a market entering the recovery stage of the cycle.
U N I T S U P P LY
Within Bundall and the surrounding suburbs of Ashmore, Southport, Surfers Paradise and Benowa, 3,950 residential
units have been approved (since 2012) while a further 1,785 are in the pipeline subject to approval. It is worth noting
that within Bundall itself, 72 have been approved while a further 195 (part of the Waterford Project) are in planning
subject to approval.
Research of units currently listed for sale on the most commonly used real estate websites (www.domain.com.au and
www.realestate.com.au) demonstrates a limited supply of units in the Bundall area beyond those currently being
built and due for completion.
3,594
1,785
195
72
APPROVED PLANNED
UNITS UNITS
Catchment Area Bundall
Source: Cordell Connect 3 years to March 2014.
The population (as at June 2013) in the Gold Coast City area is estimated at 537,844 people. This is forecast to
increase to 798,400 by 2031 or approximately 14,476 people per annum. With the current average household size in
the area of 2.6 people per dwelling (up from 2.5 per household in 2006), the area requires approximately 5,567 new
dwellings (predominantly units) to be built every year to support this growth. Isolating the catchment area however,
a mere 723 units per year are required indicating slight over supply. With the majority of the supply in Southport
and Surfers Paradise and such little supply in Bundall however, Ashton Rowe is bullish on the future prospects for
well-priced product.
OUTLOOK FOR BUNDALL
The Bundall residential unit market remains healthily supported by its high level of amenity, proximity to education
facilities and tight rental market conditions. These factors combined with the measured release of future unit
development and the region entering the recovery phase of the cycle, should see prices increase in the short term.S E C T I ON I V
S E C T I ON V
PROJECT TEAM
10
D E V E L OP E R – M AT T H E W S P R OP E RT Y G R O U P
Celebrating 35 years with continued success Matthews Property group has established a name for quality and on-
time delivery through a number of Queensland Properties. The first to identify the pivotal position of Broadbeach
and the geographical and demographic centre of growth on the Gold Coast, and acting on that intelligence with the
company’s first high-rise apartment complex “Sonata” including “Ocean Pacific” & “Freshwater Point”.
Anticipating demand well in advance of the market to shape into housing estates from the Gold Coast to the
the Sunshine Coast and at the prized Martha Cove on the Mornington Peninsula Victoria. Our commitment to
development has continued acquiring land in new emerging property hotspots with medium density town home
developments, Rivergreen Ipswich Greater Regional Brisbane under construction and Parkgreen Estate on the
Gold Coast now completed. Desert Ash Grove Home & Land on the Sunshine Coast and new exciting lifestyle
developments, Waterford Apartment Gold Coast in the Magic Millions and Arts Precinct in 2014. ”This focus
typifies the Matthews approach”
PRE VIOUS PR OJECTS
Ocean PacificS E C T I ON V
11
The Zone
Macadie Way
CJ JonesS E C T I ON V I
S E C T I ON V I
E X A M P L E CA S H F L O W R E Q U I R E M E N T S
12
Our financial analysis is provided as an estimate of the return and investment potential of typical
one bedroom + study apartments (most likely investment options) within Waterford by Matthews Property Group
given a certain set of standard assumptions.
ASSUMPTIONS T Y P I CA L O N E B E D R O O M + S T U DY A PA R T M E N T N OT E S
(1211)
EQUITY REQUIRED 20% of purchase price
I N T E R E S T R AT E F O R L OA N 4.62% 1
I N F L AT I O N 2.5% per annum 2
VACA N C Y R AT E 2% per annum 3
GROSS RENT $360 per week 4
G R O S S S A L A RY $100,000 5
CA S H F L O W A N A LY S I S UNIT 1211 N OT E S
PURCHASE PRICE $325,900
DEPOSIT REQUIRED $65,180
PURCHASE COSTS $1,400 6
D E P R E C I AT I O N ( M A X Y E A R 1 )
BUILDING $4,441
7
FIXTURES & FITTINGS $7,251
E S T I M AT E D I N C O M E / ( C O S T )
YEAR 1 $65 per week
8
YEAR 5 $42 per week
YEAR 10 $37 per week
CA P I TA L G R O W T H P OT E N T I A L
IN 5 YEARS $359,820 9
IN 10 YEARS $397,270
R E N TA L Y I E L D S
GROSS 5.63%
ONGOING ANNUAL EXPENSES UNIT 1211 N OT E S
S T R ATA ( A D M I N & S I N K I N G ) $3,266 10
R AT E S $2,791 11
P R O P E R T Y M A N AG E M E N T F E E
$1,369 12
( I N C L . L E T T I N G F E E / VACA N C Y )
INSURANCE $330 13S E C T I ON V I
13
N O T E S O N F I N A N C I A L A N A LY S I S
1. Interest-only investment loan using prevailing mortgage rate sourced from the market (standard variable
offset comparison rate)
2. Inflation based on the Consumer Price Index (CPI) long term Federal Government target.
3. The 2% Vacancy Rate applies to the assumed time that the unit is untenanted every year and is a conservative
estimate reflective of market vacancy rates.
4. Rental figures based on independent rental appraisals performed by McGrath (see Appendix C).
5. Marginal Tax Rates depend on gross salary.
6. Purchase costs include QLD stamp duty and estimated conveyancing fees. Great Start concession has been
excluded from the analysis.
7. Depreciation estimates as per indicative estimates performed by BMT (see Appendix D).
8. Estimated income/(cost) per month is what the typical investor in this example would receive or pay assuming their
personal tax rate was adjusted at the start of a tax year to take account of the investment property only. Please note a
negative figure is shown in accounting terms, ie $(5). In addition, often the income will fall (or costs will rise) slightly
over the first 5 years as the impact of depreciation lessens. Investors should seek expert financial advice.
9. Capital growth calculated using the Residex eight-year forecast for the suburb.
10. Owners corporation estimates provided by Matthews Property Group (comprised of administration and
sinking fund)
11. Rates for units within Waterford have been estimated at the 2013/14 rate assessed by Gold Coast City
Council and QLD Water as provided by Matthews Property Group
12. Property management fees vary between the area and agent. In these examples, due to the high levels of competition
in the area amongst letting agents, Ashton Rowe have assumed a fee of 5% + GST. Ashton Rowe also assumes a
letting fee is charged (one week’s rent) and makes an allowance for vacancy rates (see Note 3).
13. Indicative quotes from EBM are $330 per annum for landlords insurance.
This is not investment advice. You should seek your own financial advice.
This analysis does not take into account the investment objectives, financial situation and particular needs of investors. It is
important that you read the entire document and any supplementary amendments in full before making any investment decisions.
It is particularly important that you consider the risk factors that could affect the financial performance of the development.
You should carefully consider these factors in light of your particular investment needs, objectives and financial circumstances
(including financial and taxation issues) and seek professional advice from your own professional advisors before deciding to
invest.
Whilst this information has been carefully compiled, no warranty or promise as to its correctness is made or intended. The
information outlined within this document also represents subjective interpretation by Ashton Rowe and should not be relied
upon for investment decisions. Interested parties should undertake independent inquiries and investigations to satisfy themselves
that any details herein are true and correct. No forecasts are being made by Ashton Rowe about potential capital gains. Past
information about capital gains does not imply that such gains or growth will be made in the future. The material in this
publication is copyright. This document cannot be reproduced without the express permission of Ashton Rowe. Date compiled
5th June 2014. This information is current for six months from compilation.
Ashton Rowe conducts comprehensive residential property research only. Ashton Rowe does not act as sales agents on behalf of
developers or real estate agents. Ashton Rowe is remunerated for the Investor Report only.S E C T I ON V I I
S E C T I ON V I I
S E N S I T I V I T Y A N A LY S I S
14
In this section we analyse the impacts on the estimated monthly cashflow requirement and capital gain (where
applicable) of changes to the standard financial assumptions and market conditions used in the previous section on
cashflow analysis for the typical one bedroom + study apartment in Waterford. In each scenario we only alter one
input whilst keeping the remaining inputs constant as set out in the example in the previous section.
S C E N A R I O ON E – C H A N G E S TO M ORT G A G E I N T E R E S T R AT E S
YEAR ONE INCOME/ (COST) ($ PER MONTH)
$520
$388
$260
$132
$0
DECREASE BY 2% DECREASE BY 1% TODAY’S RATE INCREASE BY 1% INCREASE BY 2%
2.62% 3.62% 4.62% 5.62% 6.62%
When mortgage interest rates rise, the monthly income from an investment property decreases (or the holding cost
rises), due to the increase in the cost of the investment loan (assuming the loan is variable in nature and linked
to the underlying RBA interest rate). In this scenario, a 1% increase in the interest rate will lead to a decrease
of approximately $128 per month in the income of holding this investment property, in the first year (that is
$260 minus $132 per month).
Conversely, if mortgage interest rates are not as high as the current market rate of 4.62% 1, the monthly income
can increase significantly. For example, if the mortgage interest rate were 2% lower than the current rate then the
investor would have over $260 per month more income, even with the other conservative assumptions.
Changes to interest rates will not directly impact capital gains, although in reality, interest rate changes can have
indirect effects on demand, supply and hence the price of property. However, analysis of this kind is outside the
scope of this report. Investors should consult their professional adviser on this matter.
1 Ubank Uhome loanS E C T I ON V I I
15
S C E N A R I O T W O - C H A N G E S TO U N D E R LY I N G I N F L AT I ON
YEAR TWO INCOME/ (COST) ($ PER MONTH)
$180 $188 $192 $196
$176
DECREASE BY 0.5% NO CHANGE INCREASE BY 0.5% INCREASE BY 1% INCREASE BY 1.5%
2% 2.5% 3% 3.5% 4%
In the cashflow analysis, inflation influences changes in rental income and expenses (such as insurance and
maintenance). However, because rental income is a larger part of a investment property’s cashflow than the
associated expenses, it follows that an increase in inflation will actually decrease the cost of holding an investment
property in subsequent years (or increase the overall income produced as in this example). In this scenario, a
1% increase in the assumed underlying inflation (to 3.5% per annum) will lead to an increase of $12 per month in
the income produced from this investment property in the second year (we choose the second year as inflation does
not impact Ashton Rowe’s cashflow modelling in year one).
It is apparent that due to the positive impact on rental income (or negative, depending on the direction of the
change) combined with the negative (or positive) impact on expenses, changes to inflation will make only minor
overall changes to the holding cost of the investment property. However, it must be stated that this assumes that
rental income and expenses are all effected by inflation in the same way, which may not always be the case.
In addition, unlike changes to interest rates, inflationary changes can have a direct impact on capital gains. Any
rise in general prices will most likely lead to price increases in property, hence greater capital gain. However, this is
subject to the prevailing market conditions.S E C T I ON V I I
16
S C E N A R I O T H R E E - A C H I E V I N G D I F F E R E N T C A P I TA L G R O W T H
PROPERTY VALUE (EQUITY)
AT END OF YEAR 10
$530,857 ($484,085)
Capital Growth is 2% pa higher (5%)
Capital Growth is 1% pa higher (4%)
$482,412 ($208,640)
Capital Growth is 1% pa lower (2%)
Capital Growth = Residex Forecast (3%)
$437,982 ($164,211)
Capital Growth is 2% pa lower (1%)
$397,290 ($123,499)
$359,996 ($86,225)
PROPERTY VALUE (EQUITY)
AT START OF YEAR 1
$325,900 ($52,129)
START YEAR 1 YEAR 2 YEAR 3 YEAR 4 YEAR 5 YEAR 6 YEAR 7 YEAR 8 YEAR 9 YEAR 10
A change in the capital growth rate will not directly impact the holding cost of an investment. However, as shown
in the chart above, it will have a direct impact on the capital/equity position of the investment over its lifetime. The
figures above show the value (and equity) position of the property over 10 years assuming no extra loan is paid off
above the interest-only component.
The figures above assume that the asset is not sold, when it would be subject to capital gains tax (CGT).S E C T I ON V I I
17
S C E N A R I O F O U R - A C H I E V I N G D I F F E R E N T R E N TA L Y I E L D S
YEAR ONE INCOME/ (COST) ($ PER MONTH)
$300
R E N TA L RENT PER GROSS
$260
E S T I M AT E WEEK YIELD
$220
5 % A B OV E $370 5.91%
NO CHANGE $360 5.63%
5% BELOW $342 5.35%
LOWEST RENTAL NO CHANGE HIGHEST RENTAL Source: Independent rental appraisals from local real estate agents
ESTIMATE ESTIMATE
Rent is the single largest income factor for an investment property. Assuming all other things remain equal, when a
property achieves a higher rental return, income produced will rise (or the holding cost will fall).
In this case, if the property achieved the weekly rental income equal to 5% higher than the estimate provided
independently of Ashton Rowe for the example one bedroom unit2, the estimated gross yield will increase from
5.63% to 5.91% (assuming the 2% vacancy rate continues) and income will increase by approximately $40 per month
(from an income of $260 per month to income of $300).
The holding costs or income in these examples will not change by the entire rental income due to the subsequent
changes to rental expenses (i.e. agency fees) associated with the new rental income.
2 Refer to Appendix C for independent rental appraisalsAPPENDIX A
APPENDIX A
T Y P I CA L F L O O R P L A N S
18
T Y P I C A L 1 B E D R O O M A PA RT M E N TAPPENDIX A
19
T Y P I C A L 1 B E D R O O M + S T U D Y A PA RT M E N TAPPENDIX A
20
T Y P I C A L 2 B E D R O O M A PA RT M E N TAPPENDIX A
21
T Y P I C A L 2 B E D R O O M + S T U D Y A PA RT M E N TAPPENDIX B
APPENDIX B
FIXTURES & FITTINGS
SCHEDULE OF INCLUSIONS
22
FOOTINGS AND SLAB HOT WATER
Reinforced concrete to Engineer’s design Instant electric hot water system (or similar)
FLOORS LIGHTING
Reinforced concrete to Engineer’s design Recessed downlights
STRUCTURE WINDOW DRESSINGS
Reinforced Concrete Column and Blockwork to Engineer’s Blinds or curtains to suite
design
KITCHEN
ROOF Formica cabinets and white Caesarstone
Reinforced concrete to Engineer’s design (or similar) bench top
Stainless steel underslung sink
BASEMENT CARPARK Grohi Gooseneck kitchen sink mixer (or similar)
Concrete floor Selected floor tiles
Kitchen splash back mirror finish
WALLS Delonghi 60cm Multifunction Oven (or similar)
Rendered Block work with paint finish Delonghi 60cm Ceramic cooktop (or similar)
Delonghi Dishwasher (or similar)
LIFT Delonghi 60cm Rangehood (or similar)
Two passenger lifts
BATHRROOM / ENSUITE / LAUNDRY
CORRIDOR White Caesarstone (or similar) benchtop with drop–in basin
Selected floor tiles Argent close coupled toilet suite (or similar)
Walls and ceiling – gyprock paint finished Grohe Baucurve basin mixer (or similar)
Grohe Baucurve round shower mixer (or similar)
WINDOWS & SLIDING DOORS Grohe contemporary shower rose (or similar)
Power-coated metal windows and sliding doors Cirque 600 single towel rail blister (or similar)
Cirque toilet roll holder (or similar)
ENTRY DOORS Selected quality floor tiles
Fire rated with metal frames Walls tiled to 1000mm and 1800mm in shower recess
Shower – semi frameless fixed glass screen
ENTRY Stainless steel tub and cabinet
Selected floor tiles Grohe Euroeco sink mixer (or similar)
Haier 6kg front vented dryer (or similar)
INTERNAL
Walls and Ceilings – gyprock BALCONY TERRACE
Waterproof to wet areas Selected floor tiles
Flush Hollowcore 2040 doors and timber frames Handrail with glass balustrade
Architraves 42mm x 12mm timber
Skirting 67mm x 12mm timber COURTYARD ENTRANCE SURFACES
Landscape and planter boxes
LIVING ROOM / BEDROOM / STUDY Exposed aggregate concrete, colour concrete and tiles
Quality carpet
Sliding wardrobe doors with mirror finish or walk in robe
where shown on plan
AIR CONDITIONING VENTILATION
Air conditioning to living area and main bedroom WATERFORD
apartments
Ducted ventilation exhaust for bathroom
Disclaimer : Whilst all details have been carefully prepared and are believed to be correct no warranty
can be given either expressly or implied by the sellers or their agents. Intending purchasers must
rely on their own enquiries. Specifications may change at any time.
Matthews Property Group 15 May 2014APPENDIX C
APPENDIX C
I N D E P E N D E N T R E N TA L A P P R A I S A L S
23
T H E F O L L O W I N G I N D E P E N D E N T R E N TA L A P P R A I S A L F O R WAT E R F O R D WA S C O N D U C T E D
B Y M C G R AT H .APPENDIX C 24
APPENDIX D
APPENDIX D

D E P R E C I AT I O N S C H E D U L E S
                                                                                                                                                                           25

T H E F O L L O W I N G I N D I CAT I V E D E P R E C I AT I O N E S T I M AT E S W E R E P E R F O R M E D B Y B M T

                  BMT Tax Depreciation
                                                                                                          Suite 30610, Level 6
                                                                                                          9 Lawson Street, Southport QLD 4215
                                                                                                          PO Box 810
                                                                                                          SOUTHPORT, QLD 4215
                   QUANTITY SURVEYORS
                                                                                                          t 07 5526 3520 e info@bmtqs.com.au
                                                                                                          f 07 5526 3521 w www.bmtqs.com.au
                                                                                                          Australia Wide Service              ABN 44 115 282 392

                                                    Estimate of Depreciation Claimable
                                                       Typical 1 Bedroom Apartment
                                                   8 Waterford Court, BUNDALL, QLD 4217

                                             Maximum                                               Comparison Yr 1-10 (Min & Max)
                     Year         Plant &           Division 43           Total                $12,000
                                Equipment                                                      $10,800
                      1             7,051              4,310             11,361                 $9,600
                      2             4,051              4,310              8,361                 $8,400
                      3             2,999              4,310              7,309
                                                                                                $7,200
                      4             3,083              4,310              7,393
                                                                                                $6,000
                      5             2,576              4,310              6,886
                      6             2,236              4,310              6,546                 $4,800

                      7             1,399              4,310              5,709                 $3,600
                      8              873               4,310              5,183                 $2,400
                      9              547               4,310              4,857                 $1,200
                      10             341               4,310              4,651
                                                                                                    $0
                     11 +            567              129,306            129,873                          1    2      3   4        5        6       7    8   9   10
                                                                                                                                    Years
                     Total         $25,723            $172,406          $198,129                                   0D[LPXP¬¬¬¬¬¬¬¬¬¬¬¬¬¬¬¬¬¬¬¬¬Minimum

                                             Minimum                                                Cumulative Yr 1-10 (Min & Max)
                     Year         Plant &           Division 43           Total                $69,000
                                Equipment                                                      $62,100
                       1            5,769              3,526              9,295                $55,200
                       2            3,315              3,526              6,841                $48,300
                       3            2,453              3,526              5,979
                                                                                               $41,400
                       4            2,523              3,526              6,049
                                                                                               $34,500
                       5            2,108              3,526              5,634
                       6            1,830              3,526              5,356                $27,600

                       7            1,145              3,526              4,671                $20,700
                       8             715               3,526              4,241                $13,800
                       9             447               3,526              3,973                 $6,900
                      10             279               3,526              3,805
                                                                                                    $0
                     11 +            464              105,796            106,260                          1    2      3   4        5        6       7    8   9   10
                                                                                                                                    Years
                     Total         $21,048            $141,056          $162,104                                   0D[LPXP¬¬¬¬¬¬¬¬¬¬¬¬¬¬¬¬¬¬¬¬¬Minimum

                  * assumes settlement on 1 July in any given year.

                  This is an estimate only and should not be applied or acted upon. Depreciation of plant is based on the Diminishing Value
                  method of depreciation applying Low-Value Pooling. The Division 43 Write Off Allowance is calculated using 2.5% or 4%
                  depending on the property type and date of construction. This estimate is based upon legislation in force at the date of
                  report production.

                                                     This Estimate Cannot Be Used For Taxation Purposes
                                    To discuss the contents of this report please contact Bradley Beer at BMT Tax Depreciation on 07 5526 3520

                                       Maximising Property Tax Depreciation Deductions
                                                                                                                                                                 307368
APPENDIX D
26
BMT Tax Depreciation
Suite 30610, Level 6
9 Lawson Street, Southport QLD 4215
PO Box 810
SOUTHPORT, QLD 4215
QUANTITY SURVEYORS
t 07 5526 3520 e info@bmtqs.com.au
f 07 5526 3521 w www.bmtqs.com.au
Australia Wide Service ABN 44 115 282 392
Estimate of Depreciation Claimable
Typical 1 Bedroom + Study Apartment
8 Waterford Court, BUNDALL, QLD 4217
Maximum Comparison Yr 1-10 (Min & Max)
Year Plant & Division 43 Total $12,000
Equipment $10,800
1 7,251 4,441 11,692 $9,600
2 4,269 4,441 8,710 $8,400
3 3,146 4,441 7,587
$7,200
4 3,174 4,441 7,615
$6,000
5 2,643 4,441 7,084
6 2,310 4,441 6,751 $4,800
7 1,445 4,441 5,886 $3,600
8 904 4,441 5,345 $2,400
9 565 4,441 5,006 $1,200
10 352 4,441 4,793
$0
11 + 586 133,202 133,788 1 2 3 4 5 6 7 8 9 10
Years
Total $26,645 $177,612 $204,257 0D[LPXP¬¬¬¬¬¬¬¬¬¬¬¬¬¬¬¬¬¬¬¬¬Minimum
Minimum Cumulative Yr 1-10 (Min & Max)
Year Plant & Division 43 Total $71,000
Equipment $63,900
1 5,933 3,633 9,566 $56,800
2 3,493 3,633 7,126 $49,700
3 2,574 3,633 6,207
$42,600
4 2,597 3,633 6,230
$35,500
5 2,163 3,633 5,796
6 1,890 3,633 5,523 $28,400
7 1,183 3,633 4,816 $21,300
8 740 3,633 4,373 $14,200
9 463 3,633 4,096 $7,100
10 288 3,633 3,921
$0
11 + 480 108,984 109,464 1 2 3 4 5 6 7 8 9 10
Years
Total $21,804 $145,314 $167,118 0D[LPXP¬¬¬¬¬¬¬¬¬¬¬¬¬¬¬¬¬¬¬¬¬Minimum
* assumes settlement on 1 July in any given year.
This is an estimate only and should not be applied or acted upon. Depreciation of plant is based on the Diminishing Value
method of depreciation applying Low-Value Pooling. The Division 43 Write Off Allowance is calculated using 2.5% or 4%
depending on the property type and date of construction. This estimate is based upon legislation in force at the date of
report production.
This Estimate Cannot Be Used For Taxation Purposes
To discuss the contents of this report please contact Bradley Beer at BMT Tax Depreciation on 07 5526 3520
Maximising Property Tax Depreciation Deductions
307368APPENDIX D
27
BMT Tax Depreciation
Suite 30610, Level 6
9 Lawson Street, Southport QLD 4215
PO Box 810
SOUTHPORT, QLD 4215
QUANTITY SURVEYORS
t 07 5526 3520 e info@bmtqs.com.au
f 07 5526 3521 w www.bmtqs.com.au
Australia Wide Service ABN 44 115 282 392
Estimate of Depreciation Claimable
Typical 2 Bedroom Apartment
8 Waterford Court, BUNDALL, QLD 4217
Maximum Comparison Yr 1-10 (Min & Max)
Year Plant & Division 43 Total $13,000
Equipment $11,700
1 7,323 5,567 12,890 $10,400
2 4,876 5,567 10,443 $9,100
3 3,546 5,567 9,113
$7,800
4 2,803 5,567 8,370
$6,500
5 2,470 5,567 8,037
6 2,067 5,567 7,634 $5,200
7 2,210 5,567 7,777 $3,900
8 1,379 5,567 6,946 $2,600
9 862 5,567 6,429 $1,300
10 538 5,567 6,105
$0
11 + 901 167,013 167,914 1 2 3 4 5 6 7 8 9 10
Years
Total $28,975 $222,683 $251,658 0D[LPXP¬¬¬¬¬¬¬¬¬¬¬¬¬¬¬¬¬¬¬¬¬Minimum
Minimum Cumulative Yr 1-10 (Min & Max)
Year Plant & Division 43 Total $84,000
Equipment $75,600
1 5,991 4,555 10,546 $67,200
2 3,990 4,555 8,545 $58,800
3 2,902 4,555 7,457
$50,400
4 2,293 4,555 6,848
$42,000
5 2,021 4,555 6,576
6 1,691 4,555 6,246 $33,600
7 1,808 4,555 6,363 $25,200
8 1,129 4,555 5,684 $16,800
9 706 4,555 5,261 $8,400
10 440 4,555 4,995
$0
11 + 737 136,647 137,384 1 2 3 4 5 6 7 8 9 10
Years
Total $23,708 $182,197 $205,905 0D[LPXP¬¬¬¬¬¬¬¬¬¬¬¬¬¬¬¬¬¬¬¬¬Minimum
* assumes settlement on 1 July in any given year.
This is an estimate only and should not be applied or acted upon. Depreciation of plant is based on the Diminishing Value
method of depreciation applying Low-Value Pooling. The Division 43 Write Off Allowance is calculated using 2.5% or 4%
depending on the property type and date of construction. This estimate is based upon legislation in force at the date of
report production.
This Estimate Cannot Be Used For Taxation Purposes
To discuss the contents of this report please contact Bradley Beer at BMT Tax Depreciation on 07 5526 3520
Maximising Property Tax Depreciation Deductions
307368APPENDIX D
28
BMT Tax Depreciation
Suite 30610, Level 6
9 Lawson Street, Southport QLD 4215
PO Box 810
SOUTHPORT, QLD 4215
QUANTITY SURVEYORS
t 07 5526 3520 e info@bmtqs.com.au
f 07 5526 3521 w www.bmtqs.com.au
Australia Wide Service ABN 44 115 282 392
Estimate of Depreciation Claimable
Typical 2 Bedroom + Study Apartment
8 Waterford Court, BUNDALL, QLD 4217
Maximum Comparison Yr 1-10 (Min & Max)
Year Plant & Division 43 Total $15,000
Equipment $13,500
1 8,111 6,716 14,827 $12,000
2 5,360 6,716 12,076 $10,500
3 3,882 6,716 10,598
$9,000
4 3,038 6,716 9,754
$7,500
5 2,642 6,716 9,358
6 2,195 6,716 8,911 $6,000
7 1,483 6,716 8,199 $4,500
8 1,173 6,716 7,889 $3,000
9 782 6,716 7,498 $1,500
10 1,191 6,716 7,907
$0
11 + 1,978 201,453 203,431 1 2 3 4 5 6 7 8 9 10
Years
Total $31,835 $268,613 $300,448 0D[LPXP¬¬¬¬¬¬¬¬¬¬¬¬¬¬¬¬¬¬¬¬¬Minimum
Minimum Cumulative Yr 1-10 (Min & Max)
Year Plant & Division 43 Total $98,000
Equipment $88,200
1 6,637 5,495 12,132 $78,400
2 4,386 5,495 9,881 $68,600
3 3,176 5,495 8,671
$58,800
4 2,486 5,495 7,981
$49,000
5 2,162 5,495 7,657
6 1,796 5,495 7,291 $39,200
7 1,213 5,495 6,708 $29,400
8 959 5,495 6,454 $19,600
9 640 5,495 6,135 $9,800
10 975 5,495 6,470
$0
11 + 1,618 164,825 166,443 1 2 3 4 5 6 7 8 9 10
Years
Total $26,048 $219,775 $245,823 0D[LPXP¬¬¬¬¬¬¬¬¬¬¬¬¬¬¬¬¬¬¬¬¬Minimum
* assumes settlement on 1 July in any given year.
This is an estimate only and should not be applied or acted upon. Depreciation of plant is based on the Diminishing Value
method of depreciation applying Low-Value Pooling. The Division 43 Write Off Allowance is calculated using 2.5% or 4%
depending on the property type and date of construction. This estimate is based upon legislation in force at the date of
report production.
This Estimate Cannot Be Used For Taxation Purposes
To discuss the contents of this report please contact Bradley Beer at BMT Tax Depreciation on 07 5526 3520
Maximising Property Tax Depreciation Deductions
307368APPENDIX E
APPENDIX E
UNIT ENTITLEMENTS
29
THE FOLLOWING BUDGET AND UNIT ENTITLEMENT FOR WAT E R F O R D WERE
C O N D U C T E D B Y M AT T H E W P R O P E R T Y G R O U PAPPENDIX E 30
APPENDIX E
31
APPENDIX F

             APPENDIX F

             A D D I T I O N A L I N F O R M AT I O N
32
             GLOSSARY

             CA P I TA L G R O W T H   The rise in the value of an investment. Calculated by subtracting the purchase
                                       price from the current value of the investment and expressed as a percentage.
             DEVELOPER                 Refers to the company responsible for the development.

             DEMOGRAPHIC               Pertaining to the study of human population characteristics including size, growth
                                       rates, density, distribution, migration, birth rates and mortality rates.
             GROSS                     The total amount before deductions for taxation, inflation, or any other sundry fees that
                                       may be incurred. The term gross return refers to the amount of capital growth and yield
                                       before deducting taxation, body corporate fees, inflation, and sundry expenses.
             INFRASTRUCTURE            Facilities that must be in place in order for a community or region to function as
                                       an economy, including transportation, communication, and provision of water and
                                       power, and the institutions needed for security, health, and education.
             I N V E S TO R            A person whose principal purpose is to invest money prudently and productively
                                       over the longer term with the investment objectives being the achievement of a
                                       reasonable return and capital appreciation to preserve purchasing power.
             PRICE/SQM                 Calculated by dividing the value of the property by the internal area (m2). The
                                       solution is given in dollars per square metre.
             REAL RETURN               The return on an investment, less the reduction in its value as a result of inflation.
                                       Real rates are important as they tell you what the actual increase in value is, and
                                       how much of a return was less the effect of inflation.
             UNITS                     Refers to apartments or townhouses located within the development.

             VA L U AT I O N           The process of making an estimate of worth of real property or other assets for a
                                       particular purpose eg letting, purchase, sale, audit, rating, compulsory purchase or
                                       taxation, and given in a written report by a registered valuer.
             YIELD                     The annual rate of return on an investment, expressed as a percentage of the
                                       purchase price of said investment.
34
Ashton Rowe Pty Ltd
Suite 202, Level 2, 127 York Street
Sydney NSW 2000
info@ashtonrowe.com.au
www.ashtonrowe.com.auYou can also read