Q1 2021 EMERGING GROWTH POCKETS - IRI

Page created by Jim Griffith
 
CONTINUE READING
Q1 2021 EMERGING GROWTH POCKETS - IRI
April

IRI Leaderboard    16
                   2021

Q1 2021 EMERGING
GROWTH POCKETS
Q1 2021 EMERGING GROWTH POCKETS - IRI
The Shifting CPG Demand Curve
  Executive           •   At-home consumption remains elevated to a similar level through Q1. As mobility improves, we expect this elevation vs.
  Summary                 normal to erode, but still higher vs. pre-COVID-19.
                      •   Improving mobility is impacting categories like breakfast cereal, as the elevated at-home consumption “right-sizes” with
                          higher-than-normal at-home consumption easing from pandemic levels and shifting back to away-from-home consumption.
  With nearly 30%     •   Boosted by stimulus and improved SNAP benefits, low-income consumers are increasingly important, as are high-income
                          households and other growing cohorts, such as Gen Z and millennials.
  of the population
                      •   Increasing commodity and supply costs, as well as continued trends toward premium, will keep price / mix elevated at a
 vaccinated, we are       ~3% two-year CAGR. Nonedible price/mix is higher than edible.
     seeing early
                      Execution
 improvements in      •   Convenience and out-of-home consumption sales are beginning to recover.
consumer mobility,    •   Category growth in e-commerce shows food continues to capture a greater share of omnichannel sales.
                      •   With the continued growth of e-commerce, it will be important to drive traffic both in-store and online (to capture the
  macroeconomic           omnichannel shopper) and drive impulse online and to the front end of store.
    environment,      •   Retailers will continue to seek innovation within self and societal-care, indulgence and convenience.

   dining out and     Implications
   summer travel      •   Engage consumers with personalized solutions, offers and variety.
  plans, supporting   •   Drive total consumption at-home and away-from-home across categories – seek to extend at-home behaviors and build
                          on needs for self-care at-home and drive excitement in foodservice to win over competitors.
   expectations for   •   Build greater price differentiation and premiumization to capture demand for small luxuries across cohorts.
  reversal of some    •   Double down with winning retailers to drive in-store vs. online differentiation and trip drivers.
                      •   Market larger holiday celebrations at home.
 COVID-19 trends.     •   Track and optimize digital marketing and digital trade / shopper spend in real time against the most responsive digital
                          properties (e.g., retail media networks, walled gardens, delivery apps, etc.).

                                                                                                 © 2021 Information Resources Inc. (IRI). Confidential and Proprietary.   2
Q1 2021 EMERGING GROWTH POCKETS - IRI
© 2021 Information Resources Inc. (IRI). Confidential and Proprietary.   3
Q1 2021 EMERGING GROWTH POCKETS - IRI
Consumer Lifestyle Shifts                                   Work & Workout At Home
Will Have Lasting Impact                                    • Remote working continues to some
                                                              degree, a plus for at-home food spend
                                                            • Reduction in work commute
                                                              negatively impacts out-of-home
  Home Upgrades, Inside                                       food dollars
  & Out, Especially Digitally
  • Focus on cleaning and
    sanitation will stick
  • Work, shop and entertain                                                          Consumption Shifts
    from home will continue                                                           • At-home experiences are
  • More pets at home                Self- and                                          elevated vs. pre-pandemic
                                   Societal Care                                      • Premiumization elevates
                                   Convenience                                          the everyday
                                                                                      • Emphasis on self- and
                                    Indulgence
                                                                                        societal care continues

       Leisure & Holidays
       • Increased digital
         entertainment                                                 Shopping Shifts
       • Permission to celebrate
                                                                       • Significant growth in e-commerce
         anything at home
                                                                         and contactless shopping
       • New holiday traditions
                                                                       • Preference for one-stop shopping,
                                                                         in-store for perishables, meat
                                                                       • Auto-replenish for routine needs

                                                   © 2021 Information Resources Inc. (IRI). Confidential and Proprietary.   4
Q1 2021 EMERGING GROWTH POCKETS - IRI
As Vaccinations Accelerate, Consumer Mobility
 Improves, Especially for Retail and Recreation
           U.S. Vaccination Progress & Outlook1                                                                                                                              Total U.S. Consumer Mobility vs. COVID-19
                   % of U.S. population                                                                                                                                         Rates Average Daily Value by Month

                                                                                                                                        % chg. vs. Jan.-Feb. 2020 baseline
                                                                                                                                                                              20
                                                                                   Expectations for                                                                           10
                                                                                   sharp decline in                                                                                                                                                                                Residential
                                                                                   COVID-19                                                                                    0
                                                                                   hospitalizations                                                                                                                                                                                Grocery
                                                                                   by June.                                                                                  -10
                                                                                                                                                                                                                                                                                   Retail & Recreation
                                                                                   COVID-19
                                                                                                                                                                             -20                                                                                                   Workplace
                                                                                   variants2 and lack                                                                        -30                                                                                                   Transit
                                                                                   of vaccines for                                                                                                                                                                                 Average new
                                                                                   children (expected                                                                        -40                                                                                                   COVID-19 cases
                                                                                   early 2022) are the                                                                                                                                                                             per day
                                                                                   primary                                                                                   -50

                                                                                                                                                                                                                                   January

                                                                                                                                                                                                                                                         March
                                                                                                                                                                                                                                              February
                                                                                                                                                                                   September

                                                                                                                                                                                               October

                                                                                                                                                                                                                                                                 Through 3-21-21
                                                                                                                                                                                                             November

                                                                                                                                                                                                                        December
                                                                                   headwinds; U.S. is
                                                                                   now less stringent
                                                                                   vs. other countries
                                                                                   in COVID-19
                                                                                                                                 Retail and transit mobility is increasing at a faster rate than workplace mobility
                                                                                   restrictions.
                                                                                                                                 in recent weeks. Majority of employers and employees expect ~3 of 5 days
                                                                                                                                 work in office by end of summer, with schools and colleges in-person in fall.

1. Anticipates decline in hospitalizations and mortality at the point vaccinations reach 50% of the population, assuming 20% of population has existing survivor antibodies. 2. More severe B.1.1.7. variant expected to be dominant in the US as of end -March 2021.

                                                                                                                                                                                                                       Source: JP Morgan COVID research. Google Mobility.
                                                                                                                                                                                                         © 2021 Information Resources Inc. (IRI). Confidential and Proprietary.                   5
Q1 2021 EMERGING GROWTH POCKETS - IRI
Overall Macroeconomic Conditions Improve,                                                                                                                                                                        based on Moody’s
Resulting in an Encouraging Outlook for 2021                                                                                                                                        Actual to-date               baseline forecast

U.S. Macroeconomic Indicators
                 After negative GDP growth through last year,                                                          Unemployment levels are declining in recent months,
                 GDP trend is expected to turn positive in 2021                                                            with continuing decline throughout 2021
                               Real GDP, % chg. vs. 2YA CAGR                                                                        Unemployment rate, %, seasonally adjusted
                                                                                                                                                                              Unemployment concentrated
                                                                                1.8                                                                                              with low-wage workers in
                                                                      1.2                1.0                            8.1                                                              service industries
                                                    0.4      0.7                                                                 6.8       6.3        6.2       6.0       6.0
                                          0.2                                                                                                                                        5.5       5.0       5.7

                      -0.1     -0.1
             -0.7
             CY ’20   Q4 ’20   Jan ’21   Feb ’21   Mar ’21   Q2 ’21   Q3 ’21   Q4 ’21   CY ’21                         CY ’20   Q4 ’20    Jan ’21    Feb ’21   Mar ’21   Q2 ’21     Q3 ’21    Q4 ’21    CY ’21

               Spending grew in January with the stimulus and                                                              Consumer confidence rebounded in March,
               is expected to see higher growth in later months                                                      with expectations to continue increasing during the year
                      Personal Consumption, % chg. vs. 2YA CAGR                                                        Consumer Sentiment Index, University of Michigan, 1966 = 100

                                                                      2.8      3.4       2.7
                                2.5                 2.6      2.4                                                       91.2 79.8 79.0 76.8 84.9 85.6 89.4 91.5 86.3
                                          1.9
                      1.2
             0.6
             CY ’20   Q4 ’20   Jan ’21   Feb ’21   Mar ’21   Q2 ’21   Q3 ’21   Q4 ’21   CY ’21
                         Economic Impact     American Rescue                                                           CY ’20   Q4 ’20    Jan ’21    Feb ’21   Mar ’21   Q2 ’21     Q3 ’21    Q4 ’21    CY ’21
                            Payment           Plan Payments

                                                                                                                  Note: MULO+C includes brick & mortar sales and Ecommerce orders fulfilled by brick & mortar (e.g., Store Pickup, Instacart).
                                                                        Categories filtered above $250M sales Total US MULO+C L52 WE 03/28/21. Change vs. YA compare to 13 WE 03/29/20, Change vs. 2 YA compare to 13 WE 03/31/19

                                                                                                                                                                     Source: BEA, BLS, University of Michigan, Moody’s.
                                                                                                                                                    © 2021 Information Resources Inc. (IRI). Confidential and Proprietary.       6
Q1 2021 EMERGING GROWTH POCKETS - IRI
Stimulus Boosts Have Driven Increases in Discretionary Areas of Purchase;
Signs of Summer Travel Plans/Mobility Emerge to Lift Away-from-Home Spend
U.S. Monthly Retail Sales $B by Store Type
                                                                                                        The American Rescue Plan, aimed at assisting people
                                           +8%
                                                                           Mar ’21 vs.                  at lower income levels, will further boost discretionary
                                                                  596      Feb ’20 (pre   Mar ’21 vs.   spend of lower-income households. March saw gains
                                                     566                    COVID-19)      Feb ‘21
                                                                              Index         Index       in foodservice, clothing, sporting goods, gas and
                                525                                                                     car sales.
                                                                  255          123           113        Consumers are likely to continue to trade up in CPG/F&B.
                                                     237         (43%)
                                220                 (42%)
        All Other Retail1      (42%)                                                                    Recent credit card spend data shows growth in pent-up
                                                                                                        demand areas including retail, restaurants and
                                                                                                        airlines / travel.
                                                                   46          112           111
                                                      43
                                    37                            (8%)
      Gasoline Stations                              (8%)
                                   (7%)                            68
                              61
                                                      65
                                                                 (11%)
                                                                               114           109        Increased mobility will drive out-of-home
    Gen Merch Retailers (12%)                       (12%)
                                                                                                        food & beverage spend.
                                                      72           72
                                 71                                            112           101
             F&B Stores                             (13%)        (12%)                                  Gas price gains, steeper than previous years and up
                               (13%)
                                                                   62                                   ~33% vs. YA, are an early sign of the expectations for
        Food Service &           53                   58                        95           113
                                                    (10%)        (10%)                                  increased consumer mobility and demand in sectors
        Drinking Places        (10%)
                                                                                                        closed by COVID-19.
    Non-Store Retailers          84                   91           93
                                                                               135           106
           (e.g., Online)      (16%)                (16%)        (16%)
                                                                                                        Similarly, in air travel, passenger numbers are
                            Q4 2020 Avg.         Q1 2021 Avg.   Mar 2021                                increasing in recent weeks and airlines are adding
                                                                                                        capacity flight routes for summer leisure travel.
      Total Retail
    % Change vs. YA            +3.8%               +16.6%       +34.2%

                                                                                                                                 Source: U.S. Census Retail Trade. IRI research.
                                                                                                             © 2021 Information Resources Inc. (IRI). Confidential and Proprietary.   7
Q1 2021 EMERGING GROWTH POCKETS - IRI
Food Away-from-Home Is Improving and Should Accelerate in the Months Ahead
                                                                                                                                                                  Full-Service Restaurants Performance
                              Food at Home, Food Away from Home                                                                                                   All Restaurants (including closed) $ sales %
                              Share of $ Spend Dollar Sales Growth                                                         Forecast                               change vs. pre-COVID-19
    70                                                                                                                                             1.0                                March           -55
                                66
                                                                                                                                                                                        April -83
    65                                   61                                                                                                        0.9                                   May      -69
                             60
    60                                            55                                          56      57       56                                                                       June           -53
                                                           55       53                                                                             0.8             2020 vs.
    55             52                                                       53       53                                 53                                                               July           -50
             49                                                                                                                  51      50        0.7               2019
                   48                                                                                                                                                                August              -48
    50                                                     45       47      47       47                                                                                          September                 -42
                                                  45                                          44      43       44                                  0.6
    45                                                                                                                           49                                                 October                -42
                                         39                                                                             47
    40                  40                                                                                                                         0.5                            November            -55
                                  34                                                                          Expectations are for                                                December          -61
    35                                                                                                        close to an even split
                                                                                                                                                   0.4                              January            -53
    30                                                                                                        of food spend in-home                                               w/e 2/7/21          -55
                                                                                                                                                   0.3
                                                                                                              and out-of-home, as                                                w/e 2/14/21             -48
    25                                                                                                        vaccine becomes                      0.2           2021 vs.        w/e 2/21/21           -53
                                                                                                              increasingly available.
                                                                                                                                                                   2019          w/e 2/28/21             -47
     5                                                                                                                                             0.1
                  Food at Home              Food Away from Home (incl. takeout & delivery)                                                                                        w/e 3/7/21             -48
     0                                                                                                                                             0.0                           w/e 3/14/21              -45
             Jan Feb Mar April May June July Aug Sep Oct Nov Dec                                              Q1 Q2 Q3 Q4                                                        w/e 3/21/21               -41
Total Food                                                                                                   2021 2021 2021 2021
   ($B)                                                                                                            F    F    F                                                 For restaurants that remain open,
                                                                                                                                                                              sales are near pre-COVID-19 levels.

                                                                                                                                     Note: Q1 to date based on IRI estimates from IRI On Premise & BEA data. 2021 forecast based on IRI point of view.
                                       Full-service restaurants include casual and fine dining based on restaurant sample in IRI On Premise solution. Sales for same -store (excluding closed restaurants) are nearing pre-COVID levels in recent weeks.

                                                             Source: USDA Monthly Sales of Food with taxes & tips; Includes food sales across store types. IRI POS Total US, data ending 2 /28/21. IRI On Premise. IRI Analysis
                                                                                                                                                          © 2021 Information Resources Inc. (IRI). Confidential and Proprietary.          8
Q1 2021 EMERGING GROWTH POCKETS - IRI
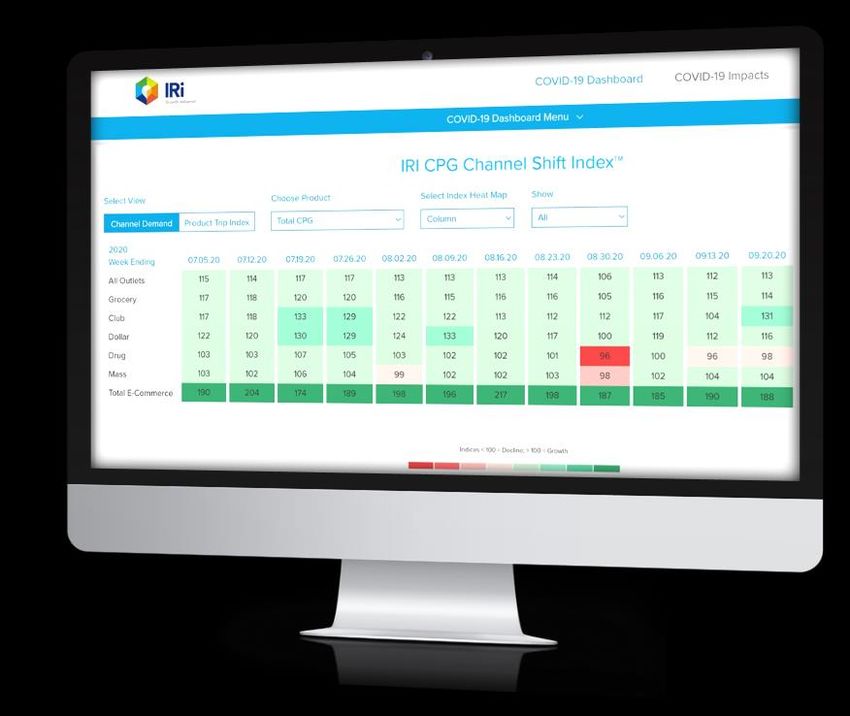
Improving Consumer Mobility and Away-from-Home Consumption Will Reduce
Elevated Food-at-Home Volume by Half, With Some At-Home Behaviors Lingering
U.S. Consumer Mobility vs. F&B At-Home Volume / % Change From Pre-COVID-19
                                                                                                                                                                                       Elevation of F&B (and other
(Jan.-mid-Feb. 2020) Base 4 Week Rolling Average, Estimated Total Omnichannel
                                                                                                                                                                                     CPG) consumption at home vs.
  40                                                                                                                                                                                    pre-COVID-19 erodes as
                              2020 F&B volume
                                                                     ~+8%                                                                                                             consumer mobility increases.
  30
                                ~+10-12% vs.                         Vs. Jan-                   +6%
                               Jan-Feb 2020                          Feb 2020
                                                                                               Vs. Jan-
                                                                                               Feb 2020                  +3%                                                           Yet in-home consumption
  20                                                                                                                                            +3%
                                                                                                                Vs. Jan-               Vs. Jan-
                                                                                        Median
                                                                                                                Feb 2020               Feb 2020                                        will remain higher vs. pre-
                                                                                        Forecast
  10                                                                                                                                                                      F&B        COVID-19 levels due to lingering
                                                                                                                                                                          Volume
   0
                                                                                                                                                                                        stay-at-home behaviors.
        1/1/2020

                   4/1/2020

                                7/1/2020

                                                          1/1/2021

                                                                                    4/1/2021

                                                                                                              7/1/2021

                                                                                                                                                               1/1/2022
                                           10/1/2020

                                                                                                                                    10/1/2021
                                                                                                                                                                          Mobility
  -10                                                                                                                                                                                   2021 demand for specific
                                                                                                                                                                                      categories will vary depending
  -20
                                                                                                                                                                                       on how they were impacted
                                                                                           Forecast
  -30                                                                                      based on assumption of full COVID-19                                                                 last year.
                                                                                           vaccine distribution by June 2021
  -40

                                                                                                     Q2 ‘21
                                                                           Q1 ‘21

                                                                                                                           Q3 ‘21

                                                                                                                                                      Q4 ‘21
                                                                                                                                                                                        Elevated price / mix levels
  -50                                                                                                                                                                                    will give a boost to value
                                                                                                                                                                                                sales growth.

                                                       Source: Google Mobility – Workplace. IRI POS data. IRI Strategic Analytics models. IRI Analysis. Note: Omnichannel = MULO+C + Costco + eCom – Overlap.
                                                                                                                                               © 2021 Information Resources Inc. (IRI). Confidential and Proprietary.   9
Q1 2021 EMERGING GROWTH POCKETS - IRI
Forecast Go-Forward Demand Is Based on Unique Category
            Variables Aligned to Evolving Consumer Behaviors
           Momentum Growth / Aisle % Volume CAGR (’16-’19) vs. Volume Acceleration in 2020
           Expect CPG categories to revert to a lower level of elevated at-home consumption in 2021,
           with those more positively impacted by changing consumer mobility to “right size” more.

                                                                       2021 CPG                  2020
                                                                       Average (F)            CPG Average
                        6%
Volume CAGR (’16-’19)

                        5%
                                                                           Rfg. Meals
                                                               Water
                        4%
                                                                                        Household Plastics/Storage
                        3%
                                                                     Sports/Energy Drinks                Condiments & Sauces
                        2%                                            Snacks
                                                                                        Nutrition/Weight Loss          Personal Cleansing
                                      Health Remedies
                                                             Floral        Cookies & Crackers                                      FZ Fruit & Veg
                        1%                                                                              FZ Meals
                                                           Laundry                                                             Ethnic
                                                 Skin Care                                                                                             FZ Meat
                                                                               Coffee & Tea      Liquor
                                                                                                           Produce
                        0%                     Baby Care Pet Care                               Dairy
                                                                                                                        FZ Desserts      Baking
                                       Candy                 Baby Food                                                            SS Meals         Household Cleaning
                        -1%                                             Deli Meat
                                               Mouth Care                                 CSD           Meat        Paper Products            Ss Vegetables
                                                                                                                                                             Seafood
                                                                                   Bakery
                        -2%   Cosmetics                   Hair Care                                   Breakfast                                                                        Alcohol                 Beauty
                                                                                  Juices                      Ss Fruit
                        -3%                                        Disposable Tableware                            Rfg. Beverages                                                      Beverages               Health
                                                      Tobacco                            Foils, Wraps, & Bags
                                                                                                                                                                                       Fresh                   Home Care
                        -4%
                          -15%                            0%                  5%                  10%                 15%                 20%                  25%                     Frozen                  General Merch
                                                                                                                                                                                       General Food            Tobacco
                                   2020 Volume Growth Acceleration (Ppt. Difference 2020 Growth Rate—2016-2019 CAGR)
                                                                                                                                                                                       Refrigerated

                                                                                                                                           Source: IRI data for MULO+C (multi-outlet and convenience) / IRI analysis / Note: Includes top 50 aisles by size
                                                                                                                                                                                    © 2021 Information Resources Inc. (IRI). Confidential and Proprietary.    10
$ Sales %                       Unit Sales %
Compared to Two Years Ago, CPG Sales Trends Remain High                                                                                                                  Change                          Change

Omnichannel Rolling 4 Weeks vs. 2 YA

                                                                                         EDIBLE
    25.0%       26.4%
                            19.8%       19.9%            19.2%                                                                18.0%                                                   19.6%
                                                                          17.0%             15.7%            17.0%                               15.8%             15.6%                                16.6%

        10.9%       10.8%
                                6.4%           6.7%              6.6%                                                                 7.5%                                                    8.2%
                                                                                  5.6%             4.9%             6.2%                                 5.5%              4.8%                                5.1%

                                                                                     NONEDIBLE
                28.3%
                                        24.2%            24.0%                                               24.5%            24.7%              24.1%             24.9%
                            23.1%                                         22.0%             23.1%
    21.5%
                                                                                                                                                                                      18.2%             18.2%

                    10.0%
        7.0%                                   7.1%              6.9%                                               6.5%              7.2%                                 6.5%
                                5.8%                                              5.2%             5.7%
                                                                                                                                                         3.1%
                                                                                                                                                                                          0.5%     1.3%
   04-19-20    05-17-20   06-14-20     07-12-20         08-09-20         09-06-20         10-04-20         11-01-20          11-29-20          12-27-20           01-24-21          02-21-21 03-21-21
                                     Note: Omnichannel = MULO+C + Costco + eCom – Overlap. Omnichannel does not include Alcohol sales. Change vs. YA compare to 13 WE 03/29/20, Change vs. 2 YA compare to 13 WE 03/31/1 9.

                                                                                                                         Source: IRI Syndicated Omnichannel, Latest 13 Quad Weeks data ending 03/28/21
                                                                                                                                      © 2021 Information Resources Inc. (IRI). Confidential and Proprietary.     11
$ Sales %                       Unit Sales %
Year-Ago Comparisons Paint a Dim Picture                                                                                                                                 Change                          Change

Omnichannel Rolling 4 Weeks vs. YA

                                                                                         EDIBLE
              24.6%
   19.9%
                           16.9%        16.0%            15.4%                                                                                                       14.9%
                                                                           13.1%            12.8%            13.3%             13.8%              12.6%                                 14.5%
                   12.0%
       9.8%
                                7.0%           6.6%             6.2%                               5.2%             5.6%               6.1%               5.4%              7.0%               6.3%
                                                                                 4.7%
                                                                                                                                                                                                           -14.0%

                                                                                                                                                                                                                -18.7%

                                                                                    NONEDIBLE
              22.1%                                                                                          19.6%             19.9%
   15.5%                   17.8%        17.3%            17.8%             16.7%            16.5%                                                                    15.6%
                                                                                                                                                  14.5%
                                                                                                                                                                                        10.4%
                   10.2%                                        7.6%
       6.3%                     5.6%           6.2%                              4.7%              5.7%             6.7%               7.0%                                 5.0%
                                                                                                                                                          1.9%                                             -15.0%
                                                                                                                                                                                                -1.2%

                                                                                                                                                                                                                -24.9%

  04-19-20    05-17-20     06-14-20    07-12-20         08-09-20         09-06-20          10-04-20         11-01-20          11-29-20           12-27-20           01-24-21           02-21-21           03-21-21

                                       Note: Omnichannel = MULO+C + Costco + eCom – Overlap. Omnichannel does not include Alcohol sales. Change vs. YA compare to 13 WE 03/29/20, Change vs. YA compare to 13 WE 03/31/19.

                                                                                                                         Source: IRI Syndicated Omnichannel, Latest 13 Quad Weeks data ending 03/28/21
                                                                                                                                      © 2021 Information Resources Inc. (IRI). Confidential and Proprietary.    12
Top Edible and Nonedible Growth Categories
Continue to Reveal Pandemic Behaviors
Compare: vs. 2 YA

                     Top Growing Edible Categories                                                       Top Growing Nonedible Categories
                     Dollars Sales % Change vs. 2 YA                                                 Dollars Sales % Change – Category vs. 2 YA

                PREMIXED
                                                                 130.6%                              HOME HEALTH CARE/KITS                                                        152.4%
            COCKTAILS/COOLERS

                SEAFOOD - RFG           43.3%                                                HOUSEHOLD CLEANER CLOTHS                                     58.9%

                  SEAFOOD - FZ         40.4%                                                                              CANDLES                        55.0%

           PICKLES/RELISH - RFG        39.0%                                                               SLEEPING REMEDIES                             54.9%

                COCKTAIL MIXES         38.2%                                                                            CHARCOAL                       46.7%

            CHEESECAKES - RFG         36.4%                                                                           DRINKWARE                      38.4%

        LIQUID DRINK ENHANCERS        36.3%                                                                                GLOVES                    37.9%
          PROCESSED POULTRY -
                                      36.2%                                                       COFFEE & ESPRESSO & TEA                            37.5%
                FZ/RFG

                    ASIAN FOOD        36.1%                                                                       LAUNDRY CARE                      37.2%

                      MEAT - FZ       35.2%                                                      PERSONAL THERMOMETERS                              36.0%

                                                                                   Note: MULO+C includes brick & mortar sales and Ecommerce orders fulfilled by brick & mortar stores (e.g., Store Pickup, Instacart),
                                                Categories filtered above $250M sales Total US MULO+C L52 WE 03/28/21, Change vs. YA compare to 13 WE 03/29/20, Change vs. 2 YA compare to 13 WE 03/31/19

                                                                                                                                                 Source: IRI POS, MULO+C, 13 WE 03/28/21
                                                                                                                          © 2021 Information Resources Inc. (IRI). Confidential and Proprietary.       13
Seafood Remains a Big Catch and Floral Blooms
      Top Growing Fresh Departments by Dollars Sales % Change vs. 2 YA

             33.4%

                                 23.9%

                                                     16.9%
                                                                         13.6%               13.5%
                                                                                                                 11.8%

          SEAFOOD               FLORAL               MEAT            DELI MEAT              DELI              PRODUCE
                                                                                           CHEESE

Note: MULO+C includes brick & mortar sales and Ecommerce orders fulfilled by brick & mortar stores (e.g., Store Pickup, Insta cart),
Categories filtered above $250M sales Total US MULO+C L52 WE 03/28/21, Change vs. YA compare to 13 WE 03/29/20, Change vs. 2 YA compare to 13 WE 03/31/19

                                                                                                                                                                   Source: IRI POS Fresh Perimeter, MULO+C, 13 WE 03/28/21
                                                                                                                                                            © 2021 Information Resources Inc. (IRI). Confidential and Proprietary.   14
Increase in Seafood Sales Illustrates
      Consumer Confidence in the Kitchen
      Top Growing Fresh Categories by Dollars Sales % Change vs. 2 YA

                      SHELLFISH/SEAFOOD                                                                                                  53.3%

                                       RIB/BEEF                                                                           43.3%

                                     LOIN/BEEF                                                                35.4%

                   POTTED PLANT/FLORAL                                                                       34.9%

                             WINGS/CHICKEN                                                                   34.4%

                                ROSE/FLORAL                                                              32.2%

     PREPARED MEAT/DELI PREPARED                                                                 26.6%

                                     RIBS/PORK                                              23.7%

                               BERRIES/FRUIT                                               22.5%

                            THIGHS/CHICKEN                                               21.2%

Note: MULO+C includes brick & mortar sales and Ecommerce orders fulfilled by brick & mortar stores (e.g., Store Pickup, Insta cart),
Categories filtered above $250M sales Total US MULO+C L52 WE 03/28/21, Change vs. YA compare to 13 WE 03/29/20, Change vs. 2 YA compare to 13 WE 03/31/19

                                                                                                                                                                   Source: IRI POS Fresh Perimeter, MULO+C, 13 WE 03/28/21
                                                                                                                                                            © 2021 Information Resources Inc. (IRI). Confidential and Proprietary.   15
Home Healthcare a Top Category Among All
Age Cohorts, Premixed Cocktails Also Strong
Top Growing Categories vs. 2 YA

                                              Note: All Shopper Loyalty Food Stores based on sample of 65M HHs and 6M static Grocery HH Categories filtered Buyer Index > 8 0
                                    and $/1000 HH > $1000 to All HH L52 WE 03/21/21, Change vs. YA compare to 12 WE 03/22/21, Change vs. 2 YA compare to 12 WE 03/24/19

                                                                           Source: IRI Shopper Loyalty, All Shopper Loyalty Food Stores, 12 WE 03/21/21
                                                                                     © 2021 Information Resources Inc. (IRI). Confidential and Proprietary.   16
CPG Growth Due to Increased Consumption by Gen Z and Millennials
Total Store vs. YA

                     Total Store $ Share                                         $ Share Change vs. YA                                                            $ Sales % Change vs. YA
                                                                                                                                                                     Total Store: -8.1%
                                                                                                              0.9
                             7.6
Seniors and
Retirees (Born
1925-1945)                                                                                                                  0.2
                            35.5
Boomers (Born
1946-1964)
                                                                                                -0.2                                                                                                              -1.5%
Generation X                                                                      -0.4
                                                                    -0.5
(Born 1965-                                                                                                                                                                                       -3.9%
1980)
                            33.1
Millennials (Born
1981-1996)                                                                                                                                                                         -8.6%
                                                                                                                                                                   -9.0%
Gen Z (Born
1997 and After)
                            21.1
                                                                                                                                                   -14.1%
                             2.7
                                   Note: All Shopper Loyalty Food Stores based on sample of 65M households and 6M static Grocery household. Change vs. YA compare to 12 WE 03/22/20, Change vs. 2 YA compare to 12 WE 03/24/19

                                                                                                                               Source: IRI Shopper Loyalty, All Shopper Loyalty Food Stores, 12 WE 03/21/21
                                                                                                                                         © 2021 Information Resources Inc. (IRI). Confidential and Proprietary.      17
Millennials and Gen Z Are Driving Growth in Frozen Department
EXAMPLE: Frozen Department vs. YA

                    Frozen Department $ Share                                      $ Share Change vs. YA                                                            $ Sales % Change vs. YA
                                                                                                                                                                       Frozen Dept: -3.7%
                               7.5
Seniors and                                                                                                                                                                                                         3.1%
Retirees (Born                                                                                                  0.9
1925-1945)
                              34.3                                                                                            0.2                                                                   0.5%
Boomers (Born
1946-1964)

                                                                                                  -0.2
Generation X                                                          -0.4          -0.5
(Born 1965-
1980)
                              33.6
Millennials (Born
                                                                                                                                                                                     -4.3%
1981-1996)                                                                                                                                                           -4.9%

Gen Z (Born
1997 and After)               21.7
                                                                                                                                                      -9.0%
                               2.9
                                     Note: All Shopper Loyalty Food Stores based on sample of 65M households and 6M static Grocery household. Change vs. YA compare to 12 WE 03/22/20, Change vs. 2 YA compare to 12 WE 03/24/19

                                                                                                                                 Source: IRI Shopper Loyalty, All Shopper Loyalty Food Stores, 12 WE 03/21/21
                                                                                                                                           © 2021 Information Resources Inc. (IRI). Confidential and Proprietary.     18
Growth Seen Among Parent Companies of All Sizes
Total Store vs. 2 YA / Top Parent Companies by Dollar Sales % Change

          Small Total Store vs. 2 YA                                                      Medium Total Store vs. 2 YA                                                           Large Total Store vs. 2 YA

                    PUFF E CIG                         117.3K %                  MARK ANTHONY BRANDS INC                                    182.3%                 CONSTELLATION BRANDS INC                                        31.4%

     UNCONDITIONAL LOVE INC          803.5%                                      BODYARMOR NUTRITION LLC                                131.9%                                  TYSON FOODS INC                            21.8%

                  MPL BRANDS         557.2%                                                  BOSTON BEER CO                           118.7%                               MONSTER BVRG CORP                            17.1%

              VI JON LABS INC        429.9%                                                   SWEDISH MATCH                  54.1%                                                   GRUPO BIMBO                       16.4%

   DOT'S HOMESTYLE PRETZELS          335.0%
                                                                                            VITAL PHARMA INC               38.4%                                               KEURIG DR PEPPER                       15.2%
                                                                                   NORTH AMERICAN COFFEE
                                                                                       PARTNERSHIP                        32.6%                                                  THE HERSHEY CO                      14.1%
         SILVER BUFFALO LLC          329.5%
                                                                                                 H P HOOD INC             31.6%                                                    COCA-COLA CO                      13.9%
            BEYOND MEAT INC          289.4%
                                                                                                 CJ FOODS INC            29.7%                                                 CONAGRA BRANDS                       12.4%
                  CELSIUS INC        253.1%
                                                                                                  SAZERAC CO             29.0%                                                GENERAL MILLS INC                     12.3%
                           PISA      233.0%
                                                                                                    GRUMA S A            27.5%                                                      PRIVATE LABEL                  11.4%
                          NJOY       213.1%

        Note: MULO+C includes brick and mortar sales and Ecommerce orders fulfilled by brick & mortar stores (e.g., store Pickup, lns tacart) Parent Company Sales> $10M 13 WE 03/28/21, Large Parent companies > $6.0 B Total store. MULO+C sales,
              Medium >$1 B, small>$100M L52 week Ending 03/28/21, Change vs. YA compare to 13 WE 03/29/20, Change vs. 2 YA compare to 13 WE 03/31/19, Some product selections do not have qualifying Parent Companies and charts will render

                                                                                                                                                                                 Source: IRI POS, MULO+C, 13 WE 03/28/21
                                                                                                                                                          © 2021 Information Resources Inc. (IRI). Confidential and Proprietary.      19
Top Brands and Top Growing Brands
Total Store vs. 2 YA
                     Top Total Store Largest Brands                                                                                     Top Total Store Growing Brands
                Dollar Sales w/ Dollar Sales% Change vs. 2                                                                                Dollar Sales Change vs. 2 YA
                                                                             $ Sales % Change                                                                                                   $ Sales % Change
                                                                                                                   WHITE CLAW HARD
         MARLBORO                                                  $7.4B                                                                                                                    $324.5M
                                                                                                                       SELTZER

          NEWPORT                    $2.1B                                                                                   COCA-COLA                                                  $282.3M

        BUDWEISER                   $1.9B                                                                                       RED BULL                                               $274.M

         COCA-COLA                  $1.8B                                                                                   STARBUCKS                                               $256.5M

            PURINA                $1.6B                                                                                            NESTLE                                        $229.M

           NABISCO                $1.6B                                                                                           MODELO                                       $217.4M

            CAMEL                 $1.5B                                                                                        MICHELOB                                        $216.4M

          RED BULL               $1.4B                                                                                               LYSOL                                     $212.3M

         KELLOGG'S               $1.3B                                                                                                VUSE                                    $205.9M

          MONSTER                $1.3B                                                                                        GATORADE                                       $201.7M

                     Note: MULO+C includes brick & mortar sales and Ecommerce orders fulfilled by brick & mortar stores (e.g., Store Pickup, Instacart). Change vs. YA compare to 13 WE 03/29/20. Change vs. 2 YA compare to 13 WE 03/31/19

                                                                                                                                                                         Source: IRI POS. MULO+C. 13 WE 03/28/21
                                                                                                                                                  © 2021 Information Resources Inc. (IRI). Confidential and Proprietary.     20
Top Frozen Brands Are Maintaining Growth Momentum
EXAMPLE: Frozen Department vs. 2 YA
                 Top Dept – Frozen Brand Franchises                                                                             Top Dept – Frozen Brand Franchises
                 Dollar Sales w/ Dollar Sales % vs. 2 YA                                                                            Dollar Sales Change vs. 2 YA
                                                                         $ Sales % Change                                                                                                   $ Sales % Change
                  TYSON                                                 $622.1M                                             JIMMY DEAN                                                   $140.5M

             STOUFFER'S                                          $509.6M                                                            TYSON                                               $114.1M

             JIMMY DEAN                                        $476.6M                                                     STOUFFER'S                                           $88.4M

               BIRDS EYE                                    $426.1M                                                     BEN & JERRY'S                                     $69.7M

               DI GIORNO                                  $397.8M                                               MARIE CALLENDER'S                                      $62.1M

       MARIE CALLENDER'S                              $331.6M                                                               RED BARON                                 $58.M

                TOTINO'S                            $308.3M                                                                   DI GIORNO                               $57.2M

           BEN & JERRY'S                          $263.5M                                                                         NESTLE                            $52.5M

              RED BARON                          $246.6M                                                                        TOTINO'S                           $49.7M

              KELLOGG'S                         $243.1M                                                                  HAAGEN-DAZS                               $48.1M

                 Note: MULO+C includes brick & mortar sales and Ecommerce orders fulfilled by brick & mortar stores (e.g., Store Pickup, Instacart), Change vs. YA compare to 13 WE 03/29/20. Change vs. 2 YA compare to 13 WE 03/31/19

                                                                                                                                                                     Source: IRI POS. MULO+C. 13 WE 03/28/21
                                                                                                                                              © 2021 Information Resources Inc. (IRI). Confidential and Proprietary.     21
Self-Care, Indulgence and Convenience Trends Continue in 2021+

       Self and Societal Care                          Indulgence                                              Convenience
  • Nutritional supplements, especially     • More permissible indulgence,                 • Retail-driven ingredient bars for
    those that support immunity,              especially in support of dietary               quick, fresh meal solutions.
    mental health and sleep.                  restrictions and lifestyle diets.            • Meal kits with varying degrees of
  • New self-care products to support       • Premium private / own brands                   prepared foods (in-store, delivery).
    other wellness efforts, e.g.,             as a point of differentiation,               • New support for meal solutions
    products for pre- and post-workout.       especially for meal components.                from products in-store, via retailer
  • Skin care products that include         • Customizable celebration kits                  apps, shoppable recipes.
    remedies for joint pain, skin health.     for various occasions.                       • Shopping convenience (e.g., menu,
  • Sustainable, renewable and              • Indulgent treats available in                  purchasing recommendations).
    refillable packaging.                     smaller portions for smaller                 • Products designed for small
  • Home care products that sanitize          celebrations and smaller                       kitchen appliances, including
    over longer periods of time.              households.                                    cocktail and other drink pods, air
  • Water conservation in personal          • Home spa products for                          fryer products / kits, sous vide, etc.
    and home care products.                   consumers of all ages.                       • New e-commerce product
  • Pet innovation will support post-                                                        discovery (e.g., shoppable recipes,
    pandemic adjustments for                                                                 sampling via click & collect or
    socializing and anti-anxiety.                                                            home delivery).

                                                                                  © 2021 Information Resources Inc. (IRI). Confidential and Proprietary.   22
Brand Franchises of All Sizes Saw Influx of New Buyers
Total Store vs. 2 YA – Top Brand Franchises by Buyer Change

              Small Total Store vs. 2 YA                                                    Medium Total Store vs. 2 YA                                                        Large Total Store vs. 2 YA

             SWAN                                               7.6M                      RAO'S                                                   5.M                           LYSOL                                                6.2M

      MICROBAN                                 4.3M                                       DAISY                                               4.7M                       PILLSBURY                                                 5.8M

      KIKKOMAN                                 4.2M                                    CERAVE                                                4.6M                                HEINZ                                             5.6M

        MT OLIVE                            3.8M                                         BIMBO                                             4.3M                               NESTLE                                              5.4M

       GREENIES                             3.7M                                     FERRERO                                               4.2M                              MISSION                                              5.3M

              FLTR                         3.5M                                 BODYARMOR                                                4.1M                      LAND O' LAKES                                                  5.3M

             BADIA                        3.3M                                        MORTON                                          3.7M                          PHILADELPHIA                                           4.7M

 LAMB WESTON                             3.M                                            PREGO                                       3.4M                                    THOMAS'                                      4.3M

    PLANET OAT                          2.8M                                      SMITHFIELD                                      3.2M                                 JIMMY DEAN                                        4.2M

             ACT II                    2.7M                                      BELGIOIOSO                                      3.1M                           BETTY CROCKER                                           4.2M

Note: Brand Franchise Sales > $1M 12 WE 03/21/21; Large Brand Franchises > $1.0 B Total Store All Outlet sales, Medium >$500M , Small>$100M L52 WE 03/21/21; Change vs. YA compare to 12 WE 03/22/20, Change vs. 2 YA compare to 12 WE 03/24/19

                                                                                                                                                                               Source: IRI PNL, All Outlets, 12 WE 03/21/21
                                                                                                                                                         © 2021 Information Resources Inc. (IRI). Confidential and Proprietary.          23
Small Homecare Brand Franchises Saw the Largest Influx of New Buyers
Total Store vs. YA – Top Brand Franchises by Buyer Change

    Small Dept – Home Care vs. 2 YA                                 Medium Dept – Home Care vs. 2 YA                                                     Large Dept – Home Care vs. 2 YA

      MICROBAN                                2.7M
                                                                                                                                                     SWIFFER                                                       1.2M
         LIBMAN               1.3M
                                                               AIR WICK                                                        591.1K
      AWESOME               1.2M
                                                                                                                                                       DOWNY                                        754.8K
        BISSELL      588.6K

 SCENTSATIONALS      566.4K
                                                                                                                                                    STERILITE                        332.2K
    LITTLE TREES     548.2K

       RESOLVE     365.4K                                                                                                                              KEURIG            25.K

           BONA    318.3K                                             OXO                                  327.8K

     WOODWICK      314.4K                                                                                                                            HUGGIES             208.4
      ARMOR ALL    279.K

                                                        Large Brand Franchises > $1.0 B Total Store All Outlet sales, Medium >$500M, Small>$100M L52 WE 03/21/21; Change vs. YA compa re to 12 WE 03/22/20, Change vs. 2 YA
                                   compare to 12 WE 03/24/19. Some product selections do not have qualifying Brand Franchises and charts will render "Required d ata cannot be found for chart. Please amend the member selections."

                                                                                                                                                                Source: IRI PNL, All Outlets, 12 WE 03/21/21
                                                                                                                                          © 2021 Information Resources Inc. (IRI). Confidential and Proprietary.     24
Small, General Food Brand Franchises Saw the Strongest Sales Gains
EXAMPLE: General Food Dept. vs. YA – Top Brand Franchises by Dollar Sales % Change

     Small Dept – General Food vs. 2 YA                             Medium Dept – General Food vs. 2 YA                                                  Large Dept – General Food vs. 2 YA

                FARM RICH                     87.8K%                                LINDT                                       24.0%                  JACK LINKS                                                22.2%

                  TAYLOR    2.8K%                                                BARCEL                                         24.0%                     REESE'S                                          19.1%

                 ARIZONA    429.0%                                         GHIRARDELLI                                  18.7%                             THOMAS                             11.2%

                   NERDS    91.4%                                              FERRERO                            14.0%                                 PRINGLES                           10.4%

               COLUMBUS     76.3%                                                SLIM JIM                       12.4%                                   FRITO LAY                         9.6%

              P F CHANG'S   54.0%                                           WONDERFUL                          11.8%                                   HERSHEY'S                        8.6%

 DOT'S HOMESTYLE PRETZELS   49.2%                                 DAVE'S KILLER BREAD                      8.7%                                           MISSION                      8.2%

           DIETZ & WATSON   46.3%                                        HIDDEN VALLEY                 6.4%                                              HOSTESS                      7.5%

                   BELL'S   44.4%                                           OLD EL PASO              4.3%                                                RUFFLES                   5.6%

                 FIORUCCI   40.9%                                                  BIMBO            4.0%                                            ENTENMANN'S                 4.0%

                                                       Note: MULO+C includes brick & mortar sales and Ecommerce orders fulfilled by brick & mortar stores (e.g., Store Pickup, Insta cart) Brand Franchise Sales > $1M 13 WE 03/28/21;
                                     Large Brand Franchises >B Total Store MULO+C sales, Medium >$500M, Small>$100M L52 WE 03/28/21; Change vs. YA compare to 13 W E 03/29/20, Change vs. 2 YA compare to 13 WE 03/31/19.

                                                                                                                                                                   Source: IRI POS, MULO+C, 13 WE 03/28/21
                                                                                                                                            © 2021 Information Resources Inc. (IRI). Confidential and Proprietary.       25
Brand Franchise Growth Rankings Among Cohorts
      Are Similar When Compared to Two Years Ago
      Top Growing Brands – Total Store vs. 2 YA

Note: All Shopper Loyalty Food Stores based on sample of 65M HH & 6M static Grocery HH. Brand Franchise filtered Buyer Index >80 & $/1000 HH >$1000 L52 WE 03/21/21;, Change vs. Y compare to 12 WE 03/22/20, Change vs. 2 YA compare to 12 WE 03/24/19

                                                                                                                                                       Source: IRI Shopper Loyalty, All Shopper Loyalty Food Stores, 12 WE 03/21/21
                                                                                                                                                                 © 2021 Information Resources Inc. (IRI). Confidential and Proprietary.   26
Price / Mix Remains Elevated vs. Year Ago
While Dollar Sales See Lapping Impact                                                    Price/Mix vs. YA             Price/Mix CAGR

Due to commodity inflation and supply chain challenges, several manufacturers have announced
price increases this year (e.g., General Mills, Hormel, J.M. Smucker & Co., Kimberly-Clark).
Promotional activity in-store continues to be softer compared to YA.
                            CPG Edible and Nonedible Price / Mix % Change vs. YA / MULO + C
                                                             EDIBLE
                                                                              4 w/e       4 w/e               4 w/e
                 Q1 2020   Q2 2020      Q3 2020      Q4 2020     Q1 2021
                                                                             01-24-21    02-21-21            03-21-21
                                        4.3                                                                  4.9
                           3.8                       3.3         4.0         3.6         3.5
                                  2.9          3.2         2.6         2.8         2.9         2.6                    2.9
   Price / Mix   1.6 1.7

  Promo Index
      vs. 2YA    92.6      72.2         84.1         86.0         85.5        85.6        86.9                  83.8

                                                           NONEDIBLE
                           5.0          5.5                      5.1                     5.4                  5.3
                                  4.3         4.6    4.4 3.9                 4.9
                                                                       4.0         4.0         4.1                    3.8
                 3.1 3.2
   Price / Mix

  Promo Index
      vs. 2YA     97.6      70.7         77.1         83.9        81.6        80.1        84.2                   80.6

                                                                                           © 2021 Information Resources Inc. (IRI). Confidential and Proprietary.   27
E-Commerce Sales Surge, but Mass, Club and
      Convenience Also Post Growth Over Prior Year Trends
      Total Store Dollar Sales % Change vs. YA

                                                          2.8%                                  Q1 21        Q1 20        Q1 21 v Q1 19
          Omnichannel                                                  15.4%
                                                                         18.7%
                                          -0.2%
  Multi Outlet + Conv                                              11.5%
                                                                   11.3%
                                        -2.7%
                      Food                                            16.0%
                                                                    12.8%
                                                         1.6%
                     Mass                                          11.2%
                                                                    12.9%
                                                          2.6%
                      Club                                            14.1%
                                                                        17.1%
                         -12.5%
                      Drug                                     7.3%
                              -6.2%
                                                             6.7%
                      Conv                                2.8%
                                                               9.6%
                                                                                                 39.8%
                 E-Comm                                                                           41.9%
                                                                                                                                                                98.4%
                                      -4.3%
                     Dollar                                                     25.0%
                                                                            19.6%
Note: Omnichannel = MULO+C + Costco + eCom – Overlap. Includes 205 measured CPG channels, excluding alcohol, perishables and
some general merchandise Club = Sam's, BJ's, Costco . Q1 20 = 13 WE 03/29/20 & 12 WE 03/22/20, Q1 19 = 13 WE 03/31/19 & 12 We eks 03/24/19

                                                                                                             Source: IRI Syndicated Omnichannel, IRI POS, IRI eMarket Insights, 13 WE 03/28/21, IRI Consumer Panel, 12 WE 03/21/21
                                                                                                                                                                © 2021 Information Resources Inc. (IRI). Confidential and Proprietary.   28
Channels Show They Are Shopped for Unique Categories
Top Growing Categories by $ Sales % / Edible vs. 2 YA

                           Note: IRI Consumer Panel, 12 WE 03/21/21; Club = Sam's, BJ's, Costco. Change vs. YA compare to 13 WE 03/29/20 & 12 WE 03/22/2 0, Change vs. 2 YA compare to 13 WE 03/31/19 & 12 WE 03/24/19

                                                                                                                                             Source: IRI POS, IRI eMarket Insights, 13 WE 03/28/21
                                                                                                                                © 2021 Information Resources Inc. (IRI). Confidential and Proprietary.   29
Home Healthcare a Top Category Across Food, Mass and Club Channels
Top Growing Categories by $ Sales % – Nonedible vs. 2 YA

                           Note: IRI Consumer Panel, 12 WE 03/21/21; Club = Sam's, BJ's, Costco. Change vs. YA compare to 13 WE 03/29/20 & 12 WE 03/22/2 0, Change vs. 2 YA compare to 13 WE 03/31/19 & 12 WE 03/24/19

                                                                                                                                             Source: IRI POS, IRI eMarket Insights, 13 WE 03/28/21
                                                                                                                                © 2021 Information Resources Inc. (IRI). Confidential and Proprietary.   30
Retailers Should Invest to Win Omnichannel
Shoppers and Gain Greater Share of Wallet
Grocery Retailer B: Difference in Total Spend by Type of Shopper /
Latest 26 Weeks vs. YA

                                                                        E-Commerce
                       In-Store Only   Omnichannel                     Only Shopper
                          Shopper       Shopper                      (likely 1-2 person
                                                                          HH, 65+)
                                            29%
                           100%                                               100%
   % of Retail Spend                       (Online
                         (In-Store)                                          (Online)
                                          Average)

     % of Shoppers         94%               4.3%                              1.7%

Growth in Spend vs.                         18%                                8%
                           12%
 YA (Δ vs. In-Store)                      (+6ppts.)                         (-4ppts.)                                  “Over time, omnichannel guests spend
                                        Increases in                  Gaps in most
                                                                                                                       on average nearly 4x more than a
  Source of Higher /                                                                                                   store-only guest and nearly 10x more
                                        most depts.,                depts., particularly
    Lower Spend vs.        N/A
   In-Store Shopper
                                       except general                 nonedible and                                    than a digital-only guest.”*
                                        merchandise                      impulse

                                       Note: Grocery retailer A offers pickup and delivery e-commerce services. *Target. Source: Grocery Retailer Shopper Loyalty Card Data, Tracked Households.
                                                                                                                             © 2021 Information Resources Inc. (IRI). Confidential and Proprietary.   31
Across Cohorts, Shopper Adoption of Grocery E-Commerce Is Increasing
Grocery Retailer A – Shopper Penetration by Income and Generation / % of Retailer Shoppers Buying in E-Commerce

                             Income Cohorts                                              Low
                                                                                                                                                 Generation Cohorts                                                19-35
                                                                                                                                                                                                                   36-45
                                                                                         Middle
                                                                                                                                                               3.6%                                                46-65
                           1.4%                                                          High
                                                                                                                       26 WE                                       4.2%                                            66+
          26 WE
                                  2.4%                                                                          Feb. 22, 2020
   Feb. 22, 2020                                                                                                                                     2.1%
                                          3.6%                                                                                               0.9%                                                         Δ vs. 2/22/20
                                                                                Δ vs. 2/22/20
                                                                                                                                                                                                                +2.1
                                      3.0%                                            +1.6                                                                                  5.7%
                                                                                                                                                                                                                +2.3
          26 WE                                                                                                        26 WE                                                      6.5%
                                                  4.7%                                +2.3                                                                                                                      +1.9
   Aug. 22, 2020                                                                                                Aug. 22, 2020                                    4.0%
                                                            6.1%                      +2.5                                                                                                                      +2.4
                                                                                                                                                            3.3%

                                             4.0%                                                                                                                                        7.6%                   +4.0
                                                                                      +2.6
          26 WE                                                                                                        26 WE                                                                  8.3%              +4.1
                                                           6.0%
   Feb. 20, 2021                                                                      +3.6                      Feb. 20, 2021                                             5.3%                                  +3.2
                                                                      7.5%                                                                                     3.6%
                                                                                      +3.9                                                                                                                      +2.7

                   Note: Income Levels defined as Low $100k. Grocery retailer A offers pickup and delivery e-commerce services. Source: Grocery Retailer Shopper Loyalty Card Data, Tracked Households.
                                                                                                                                                  © 2021 Information Resources Inc. (IRI). Confidential and Proprietary.   32
Nonedible Category Growth in E-Commerce
Remains Strong, but Edible Growth Is Notable
E-Commerce Categories by % of All Channel Sales Change vs. YA

                                                 Note: Omnichannel = MULO+C + Costco + eCom – Overlap. Omnichannel and Ecommerce includes 205 measured CPG channels, excluding alcohol,
                                                             perishables and some general merchandise. Change vs. YA compare to 13 WE 03/29/20, Change vs. 2 YA compare to 13 WE 03/31/19

                                                                                                                   Source: IRI Syndicated Omnichannel, 13 WE 03/28/21
                                                                                                     © 2021 Information Resources Inc. (IRI). Confidential and Proprietary.   33
Edible Aisles Accelerate in Pickup & Delivery, Nonedible in Shipment
Home Shipment & Pickup / Delivery % $ Share of Omnichannel Sales in Largest Aisles / Latest 26 Weeks

                                                                                                                                                                   62.7
            25.6                                                      Edible                                                                                                                                              Nonedible
                                                                                                                                                                                 49.2
                                                                                                                                                                                              46.5         45.9
                       19.9
                       2.5       17.6                                                                                                                                                                                     38.3        38.7
                                                16.7
            17.7                                                                                                                                        Home       55.3
                                 3.9                                                                                                                    Shipment
                                                          12.7                                                                                                                                                                                     26.6           25.3
                                                                       11.3                                                                                                      43.7         37.5
                                                8.9                                     10.5                                                                                                               40.6
                                                                                                   9.7                                                                                                                                33.9
                                                          4.4                                                   9.2                                                                                                       34.5                                                17.6
 Home                  17.4                                            3.7                         0.4                                                                                                                                                                                       14.1
                                                                                         3.9                    2.2         6.4                                                                                                                    20.7           20.3                                  12.5       11.5
 Shipment                        13.7                                                                                                6.1      5.2
                                                                                                                            0.3                                                                                                                                               10.4           7.1
                                                                                                   9.3                                        0.7                                                                                                                                                       8.0        4.5
            7.9                                 7.8       8.3          7.6                                                           3.5               Pickup /
                                                                                         6.6                    7.0         6.1                                    7.4                        9.0                                                  5.8                        7.2            7.0                   7.0
 Pickup /                                                                                                                                     4.5      Delivery                  5.5                       5.3            3.8         4.8                         5.0                                   4.5
 Delivery                                                                                                                            2.7

                                                                                                                                                                                                                                                                                                                    Laundry
                                                                                                                                                                                               Baby Care
                                                                                                                                                                     Skin Care

                                                                                                                                                                                                                                                                                                          Health
                                                                                                                                                                                                                                                                                                        Remedies
                                                                                                                                                                                                                                                                  Cleansing
                                                                                                                                                                                                                           Pet Care

                                                                                                                                                                                                                                                    HH Cleaning
                                                                                                                                                                                                           Weight Loss

                                                                                                                                                                                                                                                                   Personal
                                                                                                                                                                                                             Nutrition/

                                                                                                                                                                                                                                                                                                Paper
                                                                                                                                                                                                                                       Hair Care

                                                                                                                                                                                                                                                                                    & Bags

                                                                                                                                                                                                                                                                                             Products
                                                                                                                                                                                  Cosmetics

                                                                                                                                                                                                                                                                              Foils, Wraps
                                                                                                                            Dairy
            Coffee &

                                                                                                   Ref. Meats
                 Tea

                                                 Baking
                                 Poultry, Sfd

                                                                                                                Cookies &

                                                                                                                                              CSD
                        SS Veg

                                                                        Breakfast

                                                                                                                                     Drinks
                                                           Fz Meals

                                                                                          Snacks

                                                                                                                 Crackers

                                                                                                                                    Sports/
                                                                                                                                    Energy
                                   Fz Meat,

                                                                                                                                                      ∆ vs. YA
 ∆ vs. YA
 Total                                                                                                                                                  Total
E-comm 6.6             7.5        4.8           4.9       3.9          4.2               3.8       3.4           3.8        2.8      1.9      2.3      E-comm       5.4          10.0          9.5            6.3          9.4        10.7          7.2             8.2          5.6           4.6        6.1       3.1
Shipment 3.4           0.7        0.8           1.8       0.5          1.1               1.1       0.2           0.8        0.2      0.8      0.4     Shipment      2.7           8.5          8.9            4.0          7.9        9.0           5.4             6.3          2.9           2.1        3.4       0.4
   P/D      3.2        6.8        4.0           3.1       3.4          3.1               2.7       3.2           3.0        2.6      1.1      1.9        P/D        2.7           1.5          0.6            2.3          1.5        1.7           1.8             1.9          2.7           2.5        2.7       2.7

                                                                                                                                                                                                                                                               .
                                                                                     Note: Largest category aisles with tracked e-commerce sales shown. E-commerce data is based on projected receipt-based sample and reported data with varying levels of
                                                                                    granularity and accuracy available. Based on retailers where modality can be determined or assumed to majority classification . Source: IRI eMarket Insights, 26 WE 2/21/21.
                                                                                                                                                                                        © 2021 Information Resources Inc. (IRI). Confidential and Proprietary.                                                      34
Companies of All Sizes Enjoyed Significant E-Commerce Growth
Top E-Commerce Parent Companies by Dollar Sales

               Small vs. YA                                                                 Medium vs. YA                                                                         Large vs. YA

 KAMIHATA FISH IND LTD                              4.4K                                FRONERI                                    135.8%                           GRUPO BIMBO                                             89.8%
  GRANDMA'S COUNTRY
                            247.8%                                   LINDT & SPRUNGLI A G                                   95.8%                       MONSTER BVRG CORP                                                  72.9%
       FOODS
          INDIGO WILD      169.2%                                                 CHOBANI INC                               94.7%                                 COCA-COLA CO                                            72.8%

        EDISON NATION      143.2%                                      SARGENTO FOOD CO                                    92.6%                              TYSON FOODS INC                                            67.5%

             ANDIS CO      109.0%                                                   BIC USA INC                            90.4%                                GRP DANONE S A                                           65.1%

  PACIFIC WORLD CORP       90.2%                                                     GRUMA S A                           78.8%                               CONAGRA BRANDS                                              64.0%
      MID WEST METAL
                           85.9%                                       MCKEE FOODS CORP                                  76.8%                                 THE HERSHEY CO                                            63.5%
       PRODS CO INC
                                                                       STARBUCKS COFFEE
  HOFFMASTER GRP INC       83.2%                                                                                        74.0%                                         PEPSICO INC                                    62.5%
                                                                              CO
   BLUE BOX HOLDINGS                                                    SMITHFIELD FOODS
                           74.1%                                                                                        73.0%                                   KRAFT HEINZ CO                                     56.3%
          LTD                                                                  INC
           COMBE INC       72.5%                                                 CJ FOODS INC                           71.4%                                             UNILEVER                                 54.9%

                         Note: MULO+C includes brick & mortar sales and Ecommerce orders fulfilled by brick & mortar stores (e.g., Store Pickup, Instacart) Parent Companies filtered on Dollar Sales > $100M in E-Commerce L52 WE 3/28/21
                                             Large Parent Companies > $5.5 B total CPG MULO+C sales, Medium >$1 B, Small>$100M L52 WE 3/28/21; Change vs. YA compare to 03 /29/20, Change vs. 2 YA compare to 13 WE 03/31/19

                                                                                                                                                                      Source: IRI eMarket Insights, 13 WE 03/28/21
                                                                                                                                                © 2021 Information Resources Inc. (IRI). Confidential and Proprietary.       35
Total CPG Sales Are Up vs. Two Years Ago,
With Southern Regions and Markets Posting Growth vs. YA
Total Store vs. 2 YA, MULO+C

                      Top Growing MULO+C Regions                                                                                  Top Growing MULO+C Markets
                Total Store Dollar Sales % Change vs. 2 YA                                                                  Total Store Dollar Sales % Change vs. 2 YA

        13.2%    13.0%      13.0%                                                                                                      Charlotte, NC                                                          17.4%

                                        11.7%                                                                               Richmond/Norfolk, VA                                                          15.8%
                                                     11.2%
                                                                 10.1%                                                          Dallas/Ft. Worth, TX                                                13.7%
                                                                              9.5%
                                                                                                                                          Houston, TX                                               13.5%
                                                                                           8.1%
                                                                                                                   Birmingham/Montgomery, AL                                                        13.5%

                                                                                                                                       South Carolina                                               13.5%

                                                                                                                                      Las Vegas, NV                                                 13.4%

                                                                                                                          Raleigh/Greensboro, NC                                                   13.3%

                                                                                                                                       Little Rock, AR                                             13.2%

                                                                                                                                        New England                                                13.2%
         West   Mid-South   South     Southeast      Great     California     Plains    Northeast
                            Central                  Lakes

                    Note: MULO+C includes brick & mortar sales and Ecommerce orders fulfilled by brick & mortar stores (e.g., Store Pickup, Instacart). Change vs. YA compare to 13 WE 03/29/20, Change vs. 2 YA compare to 13 WE 03/31/19

                                                                                                                                                                        Source: IRI POS, MULO+C, 13 WE 03/28/21
                                                                                                                                                 © 2021 Information Resources Inc. (IRI). Confidential and Proprietary.     36
Frozen Sales Are Especially Strong Across Western and Southern Regions
EXAMPLE: Frozen Department vs. 2 YA, MULO+C

                    Top Growing MULO+C Regions                                                                                 Top Growing MULO+C Markets
           Frozen Department Dollar Sales % Change vs. 2 YA                                                           Frozen Department Dollar Sales % Change vs. 2 YA

                                                                                                                         Raleigh/Greensboro, NC                                                                28.8%

       24.7%                                                                                                                           Charlotte, NC                                                          28.2%
                  22.8%     22.8%        22.6%        22.3%
                                                                                                                                     Las Vegas, NV                                                          27.0%
                                                                  20.3%        20.3%
                                                                                                                            Richmond/Norfolk, VA                                                          26.0%

                                                                                            15.0%                             Dallas/Ft. Worth, TX                                                       25.1%

                                                                                                                                     San Diego, CA                                                       24.9%

                                                                                                                                   Los Angeles, CA                                                      24.3%

                                                                                                                    New Orleans, LA/Mobile, AL                                                          24.3%

                                                                                                                                         Atlanta, GA                                                   24.2%

                                                                                                                                    Jacksonville, FL                                                  23.1%
      Mid-South   West    California    South      Southeast       Great     Northeast      Plains
                                        Central                    Lakes

                     Note: MULO+C includes brick & mortar sales and Ecommerce orders fulfilled by brick & mortar stores (e.g., Store Pickup, Instacart). Change vs. YA compare to 13 WE 03/29/20, Change vs. 2 YA compare to 13 WE 03/31/19

                                                                                                                                                                         Source: IRI POS, MULO+C, 13 WE 03/28/21
                                                                                                                                                  © 2021 Information Resources Inc. (IRI). Confidential and Proprietary.     37
Key Imperatives for 2021
More Emphasis on Forward-Looking Insights as Consumer Behaviors, Lifestyles Shift
  •   Quantify consumer and channel shifts more quickly with real-time insights and analytics to meet
      evolving demand patterns.
  •   Understand brand trust, emotional connection and brand experiences and build on key strengths.
  •   Engage with the consumers via direct-to-consumer initiatives and social media.
  •   Make brands more relevant for everyday moments via understanding and extending usage.
  •   Build baskets for holidays and events, in partnership with retailers, to cater to omnichannel shoppers.
  •   Offer more personalized solutions and variety (flavors, packs) and drive more price / mix in online grocery.

Leverage Heightened Role of the Home in Consumers’ Lives
  •   Cater to more occasions at home – celebratory and everyday.
  •   Spot enduring vs. reverting trends and partner with retailers to drive trips for traditions that are likely to stick.
  •   Accelerate go-to-market timing and effectiveness.
  •   Highlight trusted brands that appeal to everyone in the household.

Continue to Focus On:
  •   Investments in omnichannel shoppers to gain greater share of wallet
  •   Balancing health and wellness vs. taste
  •   Value
  •   Relevant and faster innovation
  •   Raising digital media investments to build & scale brands (retail media, paid search, social media, shopping apps)
  •   Variety of ways to get products to the consumer, e.g., omnichannel, flexible routes
  •   Sustainable packaging and ingredients, as well as giving back to communities in which we operate

                                                                                                      Source: Team analysis; IRI 2020 Growth Leaders in CPG Webinar – Panel Discussions
                                                                                                                        © 2021 Information Resources Inc. (IRI). Confidential and Proprietary.   38
Mark Clouse                                Stuart Aitken                                      Vivek Sankaran
President and CEO, Campbell Soup Company   Chief Merchant & Marketing Officer, The Kroger Co. President & CEO, Albertsons Companies
November 10, 2020                          September 3, 2020                                  August 25, 2020

                                                                                      © 2021 Information Resources Inc. (IRI). Confidential and Proprietary.   39
IRI’s Latest CPG and Retail Insights Reports to Manage
the Impact of COVID-19 (click to see full report)
 The Changing Shape of                   Discovering Pockets          COVID-19 Emerging                     Recession Proof                               IRI COVID-19 Impact
 the CPG Demand Curve                        of Demand                  Point of View                        Your Business                                Assessment Reports

14. Vitamins, Minerals, Supplements   3. Innovation for a Post-    5. COVID-19 Vaccine Update:         7. Defending and Recapturing                   5. Anticipating Life After
13. America Is Ready for Football        Pandemic World               Impact on CPG Industry              the Shelf                                      COVID-19
12. Revenue Management                2. Harness Growth in 2021    4. Anticipated Vaccine Adoption &   6. Innovation Lessons From the                 4. Consumers Provide a
    Opportunities in a Pandemic       1. The Premium Opportunity      Impact on the CPG Industry          Great Recession to Apply                       Pessimistic View of Coming
11. Home for the Holidays                                          3. Potential Impact of Reduced         Today                                          Months
10. Powering the Future of                                            Unemployment Benefit             5. Building Brands During                      3. Tracking the Dramatic Pivot
    Convenience Retail                                                Changes on F&B Spending             Recessionary Times                             of U.S. Consumer and
                                                                   2. Consumer Stimulus,               4. Recessionary Lessons to                        Shopper Behavior
 9. Reignite In-Store
    Merchandising in Grocery                                          Unemployment Benefit                Apply to Private Label Today                2. Then and Now: Consumer
 8. SNAP Benefits                                                     Spending & Shopping Behavior     3. How Big Brands Performed                       CPG Behavior During
                                                                   1. The Impact of a Second Round        During the Great Recession                     Economic Downturns
 7. U.S. CPG Growth Leaders
                                                                      of Stimulus on the CPG           2. Maintaining Pricing Discipline              1. COVID-19: Impact on CPG
 6. E-Commerce
                                                                      Demand Curve                        During a Recession                             and Retail
 5. Boomers
 4. A Global Perspective                                                                               1. How the Great Recession
                                                                                                          Reshaped CPG Demand Curve
 3. Tracking Transformation
 2. Meat and Millennials
 1. Anticipate the Future

                                                                                                                 © 2021 Information Resources Inc. (IRI). Confidential and Proprietary.   40
CPG Economic Indicators
Access IRI’s industry-standard metrics for consumer product demand and supply
during the pandemic, our CPG inflation tracker and the latest data on category
trends, out-of-stock levels, consumer sentiment and more.

                       U.S. Demand             Channel Shift         E-Commerce
Demand Index™
                     Index™ Forecasts            Index™             Demand Index™
    Inflation                              Out-of-Stock Levels      U.S. Topics from
                       Supply Index™
    Tracker™                                for Subcategories       IRI Social Pulse™

The IRI CPG Demand Index™ provides a standard metric for tracking
changes in spending on consumer packaged goods.
U.S. Demand Index™ Forecasts are delivered through a proprietary,
fully automated forecasting solution that anticipates consumer demand.
Channel Shift Index™ provides a standard metric for tracking changes (migration)
in spending on consumer packaged goods across select channels.
The IRI E-Commerce Demand Index™ provides a standard metric for tracking changes
in spending on consumer packaged goods purchased online.
Inflation Tracker™ provides the well-known price per unit metric for tracking changes in pricing of consumer packaged goods.
Supply Index™ provides a standard metric for tracking changes in product availability (i.e., in-stock rates) in stores for consumer packaged goods.
Out-of-Stock Levels for Top-Selling Subcategories by Market Area in the U.S.
Top U.S. Topics from IRI Social Pulse™

                                                                                                 © 2021 Information Resources Inc. (IRI). Confidential and Proprietary.   41
Want to Be the First to Know?

                                www.iriworldwide.com/en-US/Insights/Subscribe

                                        Registered Users Get New Thought Leadership
                                        from IRI’s Research, Data & Analytics Experts

                                                  © 2021 Information Resources Inc. (IRI). Confidential and Proprietary.   42
IRI Global Headquarters
 CONTACT US   203 N. LaSalle St., Suite 1500
              Chicago, IL 60601
   FOR MORE   IRI@IRIworldwide.com
              +1 312.726.1221
INFORMATION   Follow IRI on Twitter: @IRIworldwide

                                                       © 2021 Information Resources Inc. (IRI).
                            © 2021 Information Resources Inc. (IRI). Confidential
                                                                     Confidential and
                                                                                  and Proprietary.
                                                                                      Proprietary.   43 43
You can also read