Washington Beer Economic Impacts in Washington State
←
→
Page content transcription
If your browser does not render page correctly, please read the page content below
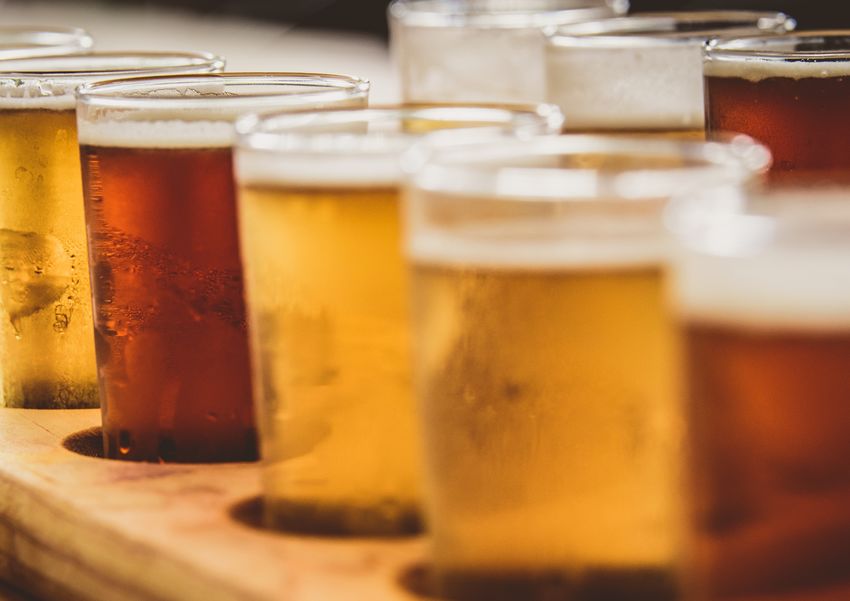
Washington Beer
   Economic Impacts in Washington State
   March 2019
Community Attributes Inc. tells data-rich stories about
     communities that are important to decision makers.

                                                                       President and CEO
                                                                              Chris Mefford

                                                                         Project Manager
                                                                        Spencer Cohen, PhD

                                                                                  Analysts
                                                                           Madalina Calen
                                                                             Diana Haring
                                                                        Maureen McLennon
                                                                              Bryan Lobel
                                                                            Zack Tarhouni

                                                               Community Attributes Inc.
                                                                 500 Union Street, Suite 200
                                                                  Seattle, Washington 98101
                                                              www.communityattributes.com

2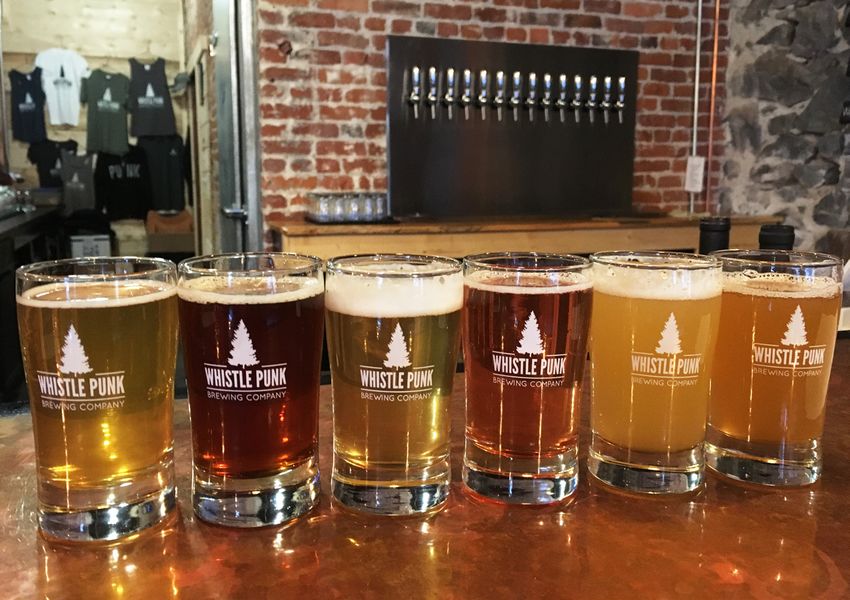
This page was intentionally left blank

                                         3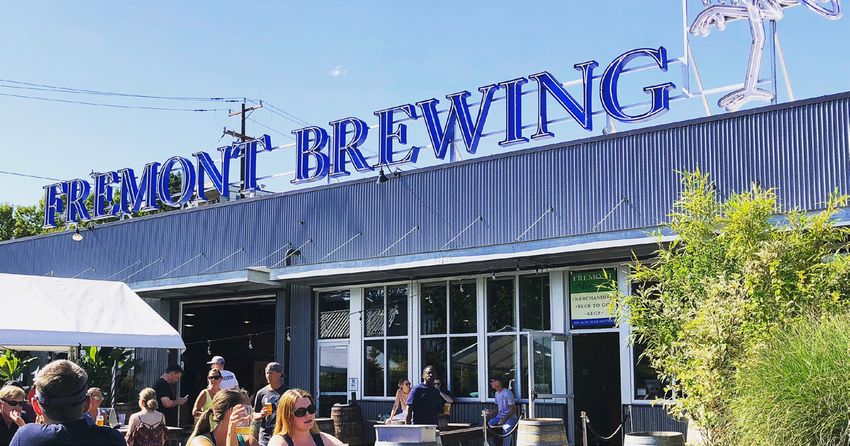
Washington State Craft Beer
2017 Washington Economic Impacts
6,300 1.4 billion 1,164,000
Direct Jobs Total Economic Impact Kegs of Beer Produced
(582,000 Barrels)
£
¤ BELLINGHAM
Net Production by
Brewery, 2017 ¯
391
2
EVERETT OROVILLE
V
U20
Sized by Number of Kegs
WINTHROP £
¤
97 More than 20,000
T
S
9 MOUNT
M U K I LT E O VERNON
4,001 - 20,000
Active brewery licenses in 2018
1001 - 4,000
T
S
99
£
¤
101
500 - 1000
P O RT
TOWNSEND
S
T
33
522
B OT H E L L L E AV E N W O RT H
£
¤
2
§
¦S
¨ T
5 522 WOODINVILLE
MOSES
SPOKANE
§
¦
¨
405 O LY M P I A §
¦
¨
90
ELLENSBURG
LAKE
§
¦
¨90
£
¤
195
Average breweries added per year,
S E AT T L E
2010-2018
T
S
520
YA K I M A
CENTRALIA
BELLEVUE £
¤
12 CLARKSTON
§
¦
¨
130
S E AV I E W 5 RICHLAND
§
¦
¨ 90
§
¦
¨
82
WHITE
T
S
99
SALMON Cities have at least one brewery
0 50 100
RENTON
2nd 4/5 75%
Most craft Of all Washington Breweries are Of total hop crop production
breweries in the U.S. neighborhood breweries in the U.S.
California is first, Producing fewer than 4,000 kegs per Yakima Valley, 2017
with 764 craft breweries year, independently owned and operated
Sources: Washington State Liquor and Cannabis Board, 2018; Washington State Employment Security Department, 2018; Washington State
Department of Revenue, 2019; Washington State Office of Financial Management, 2018; Brewer’s Association, 2019; Community Attributes Inc., 2019.
4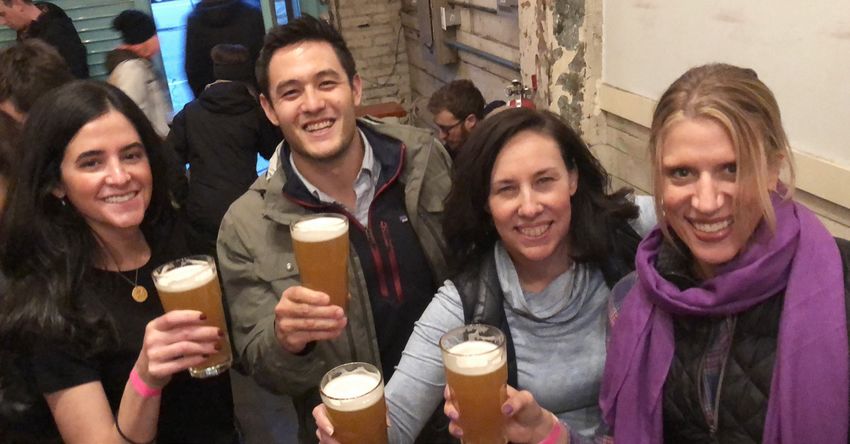
Washington Beer Economic Impact Study

Executive Summary                                                           four largest breweries in 2017 (Elysian, Georgetown, Fremont, and Mac
                                                                            & Jack’s). Statewide, 30 (11%) breweries produced at least 2,000 barrels
Washington beer production has surged in recent years, growing
                                                                            in 2017. Roughly one fifth produced between 500 and 2,000 barrels;
from just 283,400 barrels in 2005 to 582,400 in 2017. Washington is
                                                                            more than one third between 100 and 500 barrels, and nearly one third
home to the largest single source of hop production in the world, with
                                                                            produced fewer than 100 barrels. (Exhibit E-1)
75% of all U.S. hop production. Beer production volumes declined
slightly from a recent peak of 632,300 in 2016, due to corporate            Exhibit E-1 Breweries by Production Size, 2017
acquisition of Washington beer and production relocation out of state,      Share of Statewide Producton                                      Number of Breweries
but growth in new craft brewers demonstrates industry strength and          45%                                                                                       140
consumer demand.                                                                     41%
                                                                                                                                                     127
                                                                            40%
Washington’s craft beer industry reflects both national trends and the                                                                                                120
state’s own qualities. Craft brewing has been on the rise across the                                                                                            114
                                                                            35%
U.S. In 2017, while overall beer sales by volume declined 1.2%, to 196
                                                                                                                                                                      100
million barrels (BBLs), sales of craft beer continued to grow at 5.0%,      30%
reaching 12.7% of the total U.S. beer market (24 million barrels or 48
                                                                                                                                                                      80
million kegs). Craft breweries contribute meaningfully to other parts       25%
                                                                                                                                        73
of the economy through supply chain purchases and worker income.
                                                                            20%
According to the Brewers Association, in 2017 the craft brewing industry                        16%                                                                   60

nationwide contributed $76.2 billion to the U.S. economy and supported                                      15%
                                                                            15%                                                    13%
more than 500,000 jobs.1                                                                                                                                              40
                                                                            10%
                                                                                                                       8%
Beginning in the 1980s with Redhook and Pyramid, Washington has long
                                                                                                                                                6%
been a hub for high quality craft beer. This study provides an in-depth                                                                                               20
                                                                             5%                                              15
review and analysis of the beer industry in Washington, including                                                 12                                       1%
                                                                                           5          6
growth trends, distribution and sales channels, economic contributions,      0%                                                                                       0
and outlook and challenges.                                                         25,000    10,000 to   5,000 to     2,000 to   500 to     100 to 499 Fewe r than
                                                                                   barrels or  24,999      9,999        4,999      1,999      barrels 100 barrels
Breweries, Production, and Industry Segmentation                                     more      barrels    barrels      barrels    barrels

                                                                                                                                    Brewery Production Level, 2017
In the autumn of 2018, Washington had 391 licensed active
brewing operations. Between 2005 and 2017 (last full year of data),         Sources: Washington State Liquor and Cannabis Board, 2018; Community Attributes Inc., 2019.
overall volume of net production (gross production adjusted to exclude
                                                                            Craft beer production has accelerated in recent years, including
inventory losses) increased at an annual rate of 7% per year.2 Excluding
                                                                            amongst established breweries. In 2007, of the 38 breweries (excluding
Redhook, which relocated its production to Oregon, production
                                                                            Redhook) that produced at least 500 barrels of beer in Washington,
increased 16% per year.
                                                                            slightly more than one third showed positive growth during the next
Production amounts per brewery can help segment the industry. The           ten years in production. By comparison, of the 56 breweries (excluding
majority of breweries are small, with two thirds of licensed active         Redhook) that reported at least 500 barrels of net production in 2012,
operations producing fewer than 500 barrels (or 1,000 kegs) in 2017.        nearly half (26) showed production growth by 2017. Of these, 16
Slightly more than half of all net production came from the eight largest   breweries grew by more than 10% a year during this time, including Iron
breweries in the state; more than a third of net production was by the      Horse Brewery, whose annual growth averaged more than 60%.
                                                                                                                                                                          5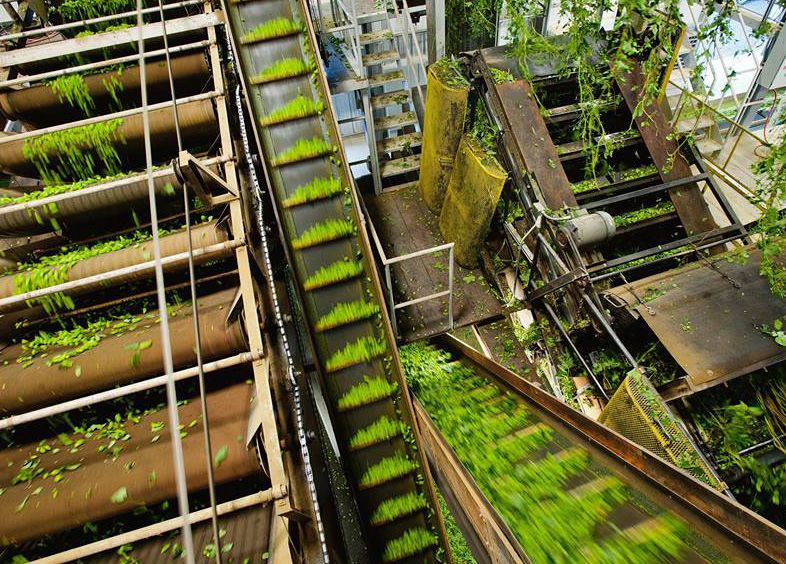
Washington Beer Economic Impact Study

Exhibit E-2. Brewery Locations Across Washington State, 2017

6
Washington Beer Economic Impact Study
King County is home to the largest concentration of breweries in the Growth Opportunities and Challenges
state, with 55% of net production. Other notable concentrations include
Washington’s beer industry has grown substantially in recent years,
Kittitas, Yakima, Whatcom, Pierce, and Kitsap counties, each with more
and continued growth depends on increasing market share within
than 4% of total state net production.
Washington and gaining traction in domestic and international exports,
The vast majority of Washington breweries are small, family-owned, which Washington lags in. Beer sales in Washington state remain domi-
and are an integral part of their local communities. Taprooms often nated by large out-of-state producers, including both major labels—such
serve as locations for public gatherings and events. At least one brewery as those under AB InBev and Pabst Blue Ribbon—and larger regional
exists in 130 cities and towns across the state, out of 281 incorporated craft breweries such as those out of Oregon and California. In 2017 an
municipalities. Seattle is home to largest number of brewery locations, estimated 11% of all beer sold by distributors (representing the vast
with 66 in 2017, followed by Vancouver (19), Tacoma (16), Spokane (14), majority of all beer sales by volume) were of beer from Washington,
and Bellingham (13). (Exhibit E-2) up from slightly more than 4% in 2005. Growth opportunities exist for
breweries of all sizes, though with their own unique challenges. The
Distribution and Sales Channels and the Beer number of new breweries continues to grow, meeting a demand for
Business Model small, neighborhood craft breweries across the state.
The majority of beer sold by volume is through distribution networks,
ultimately for final sale in restaurants, bars, and stores, though this is
primarily among Washington’s largest breweries. In 2017, an estimated
two-thirds of all brewery sales by volume were via distributors, with
the remainder in taproom sales, brewpubs, and self-distribution.
For many breweries, especially smaller operations, distribution is a
significant revenue challenge. Whereas a barrel of draft beer sold in
a taproom in the form of pints can earn $1,200 or more in sales, the
same quantity sold to distributors typically generates $300 or less for
the brewery. In 2017, approximately one-fourth of all breweries worked
with a distributor. For the eight largest breweries, representing more
than half of all net production statewide, distribution channel sales by
volume averaged more than 90% of all sales in 2017. More than 75% of
breweries use self-distribution, brewpubs, and taprooms as their only
sales channels.
The taproom business model has enabled much of the growth in
small breweries. Taprooms allow small operations to sell beer directly
to consumers without additional costs, such as operating a kitchen and
dining facility. Through taprooms, breweries fully capture these
revenues, whereas sales through distributors generate much lower
returns for breweries on a per barrel, or BBL, basis. However, for brew-
eries that seek to expand sales, distributors and significant investments
in higher capacity barrel systems are required, each with their own
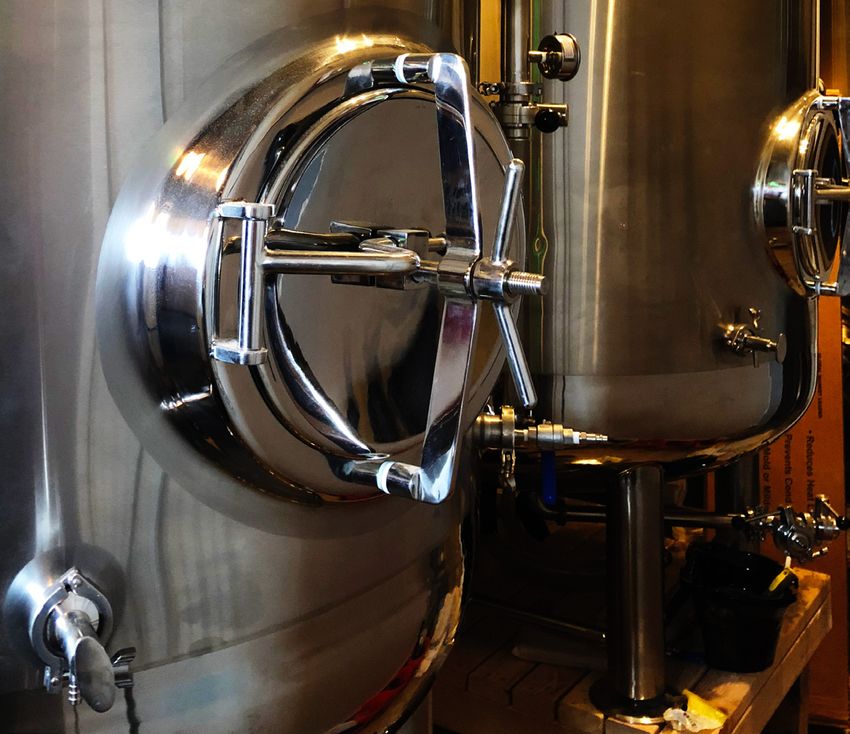
Image Source: Washington Beer Commission, 2019
inherent challenges.
7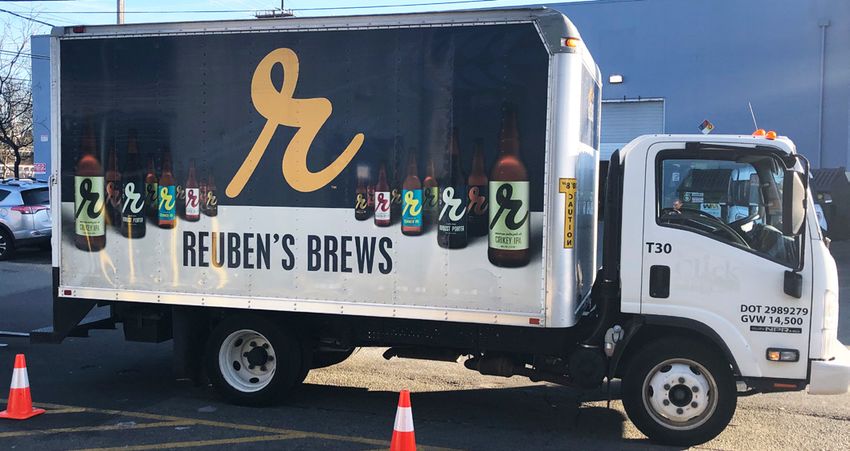
Washington Beer Economic Impact Study

                                                                                                                       In some cases, such as reported beer production, different
    Contents
                                                                                                                       government agencies at state and federal levels use alternative
    1. Introduction................................................................................................8   measures for beer produced and sold. These differences will be
                                                                                                                       explained in full in this report.
    2. Industry Overview...................................................................................10

    3. Washington Beer Industry Metrics.......................................................11
                                                                                                                       Organization of Report
                                                                                                                       The remainder of this report is organized as follows:
    4. Economic and Fiscal Impacts.................................................................19
                                                                                                                          –– Industry overview. The production, supply chain, and sales
    5. Washington Beer Industry Outlook......................................................20                              channels that define the industry.

    6. Summary and Conclusions...................................................................23                       –– Key industry metrics. Production, brewery count, jobs, income,
                                                                                                                             sales patterns, and tourism and festival activities.
                                                                                                                          –– Economic and fiscal impacts. Additional jobs, income, and
1. Introduction                                                                                                              revenues supported through upstream business-to-business
                                                                                                                             transactions and household consumption expenditures.
Washington has in recent years emerged as one of the U.S.’s most
vibrant and robust clusters of craft beer producers, ranking among the                                                    –– Outlook and key industry issues. Drawing on interviews with
largest states in number of craft breweries. In 2017, there were nearly                                                      industry stakeholders and supporting sources.
400 unique craft breweries in Washington state, primarily concentrated                                                    –– Summary and conclusions. Review of key findings.
in King County but with celebrated brands across the state. The industry
in recent years has experienced substantial growth in overall net
production, employees, and number of licensed brewery operations,
and yet there remains significant market share available for local
producers to capture.
This study, commissioned by the Washington Beer Commission,
analyzes the size, breadth, evolution, and economic and fiscal contribu-
tions of the craft beer industry to the Washington state economy.

Methods
Analytics presented in this report leverage state and federal data on
beer production and associated employment, wage, and revenue
data, combined with data and information gathered and shared by
the Washington Beer Commission and Washington Brewers Guild and
through interviews with industry stakeholders. Economic impacts are
modeled through use of the Washington State Input-Output Model,
developed by the Washington State Office of Financial Management to
represent the complex features and web of transactions that define the
Washington state economy.
                                                                                                                       Image Source: Washington Beer Commission, 2019

8
Washington Beer Economic Impact Study

Exhibit 1. Washington Beer Production Supply Chain

                                                                                 9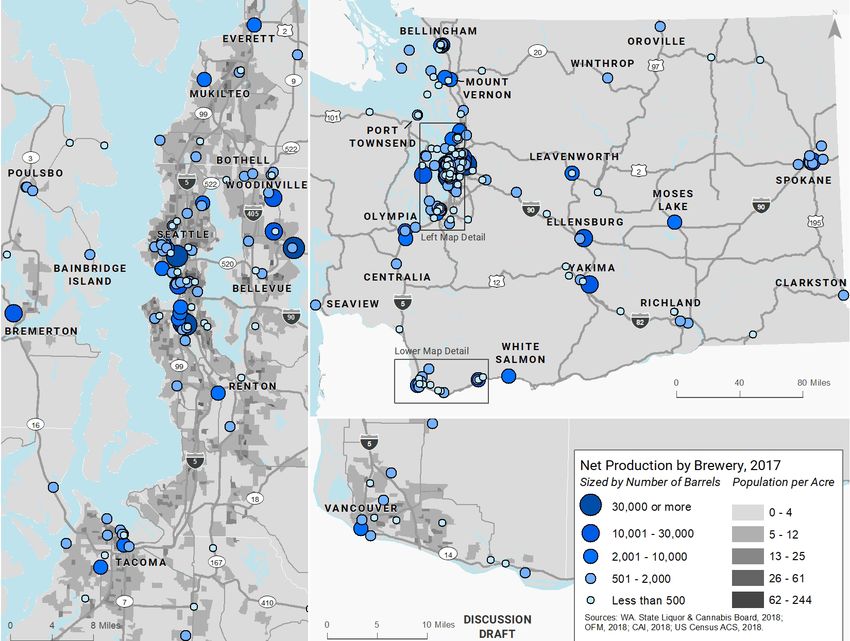
Washington Beer Economic Impact Study

2. Industry Overview                                                         The most commonly produced hops are alpha and super alpha varieties,
                                                                             though even within these subspecies of the plant there is an increas-
Washington’s beer industry represents a supply chain linking local
                                                                             ingly appreciated variation in the aroma and other attributes associated
farms to regional and national consumers. Brewers rely on local hops
                                                                             with terroir, including soil conditions, hill slope, amount of sunshine,
as a core ingredient, along with grains, a large share provided by local
                                                                             and other factors. Larger breweries purchasing above a certain
farmers and maltsters, fermentation equipment, barrels, bottling
                                                                             purchasing threshold (in pounds) often have first access to specific hops
and canning systems, distribution and sales channels, and other key
                                                                             fields and are invited out by the growers or wholesalers in advance to
elements of the beer production system. Exhibit 1 details the key
                                                                             make their selections.
components of this supply chain.
                                                                             One of the challenges for brewers is the maintaining of a consistent
Hops Production                                                              flavor profile for each beer style year over year. Unlike wine, when the
                                                                             year and appellation are presented as important and celebrated qual-
Washington’s beer supply chain begins with a few key ingredients, most
                                                                             ities shaping the profile of a wine, beer consumers typically expect the
notably hops. Washington is the nation’s largest producer of hops,
                                                                             same flavor profile per style regardless of the year. Yet, it is often the
representing three quarters of all U.S. production in 2017 (Exhibit 2)
                                                                             case that aromatics and other attributes of a specific strand of hops will
and 25% of global production. Nearly 30% of Washington’s hops harvest
                                                                             vary year by year based on climatic conditions and other factors.
by value is exported, equal to 82% by value of all U.S. hops exports in
2017. Key providers of hops in the Yakima Valley include Yakima Chief        Exhibit 2. Washington’s Share of Total U.S. Hops
Hops, Steiner and Haas (two German companies that have since estab-          Production, 1915-2017
lished a presence in the region), as well as smaller processors of pellets
such as Hollingbery and Sons.                                                100.0%

                                                                                                                                                                    75%
                                                                                                                                                                    74.6%

                                                                               50.0%

                                                                                0.0%
                                                                                       1915 1925 1935 1945 1955 1965 1975 1985 1995 2005 2015

                                                                             Sources: U.S. Department of Agriculture, National Agriculture Statistics Services, 2018;
                                                                             Community Attributes Inc., 2019.
Image Source: Washington Beer Commission, 2019

10
Washington Beer Economic Impact Study
3. Washington Beer Industry Metrics The number of active breweries, based on licensed operations, has
continued to grow, reaching 391 as of August 2018 (Exhibit 4).3 Between
Beer Production and Breweries 2005 and 2017, total active licenses (i.e., those associated with positive
annual net production) increased at an average annual compound rate
Washington beer production has surged in recent years, growing
of more than 12% per year; since 2005, in only one year—2006—did the
from just 283,400 barrels in 2005 to a recent peak of 632,300 in 2016
number of active licenses decline.
(Exhibit 3). Volumes declined slightly in 2017, to 582,400, but this
was largely due to the closure of Redhook production in the state and Exhibit 4. Licensed Brewery Operations in Washington
relocation to Oregon. Redhook has been a major staple of Washington’s State, 2005-2018*
beer industry historically, though its share of overall production has
declined steadily in recent years as many other breweries have opened 500
and expanded production. Those that did not produce beer 441
429
Between 2007 and 2017, Redhook production in Washington declined Breweries that produced beer
383 47 50
at a compound annual growth rate of 21% per year, whereas all other 400
349 27
breweries have seen positive growth of 16% per year over this same 382 391
period. In 2017, while overall net production declined, after removing 28 356
290
Redhook net production increased 2%. 300 321
253 29
Exhibit 3. Beer Production Over Time 30 261
204
Thousands of Barrels 200 21 223
166
146
700 128 18 183
All other breweries 632 114 18
95 97 102 148
11
Redhook 594 582 100 13 128
600 550 1 4 6 117
556 101
482 94 93 96
500 562
414
500 464 0
351 2005 2006 2007 2008 2009 2010 2011 2012 2013 2014 2015 2016 2017 2018
409 295
400 370 365
342 337 250 *2018 data as of August 2018. Sources: Washington State Liquor and Cannabis Board, 2018;
304 149 Community Attributes Inc., 2019.
283 197
300 156 172
132
In 2017, Washington’s largest breweries by net production included
131 Elysian (66,300 barrels; acquired by Anheuser-Busch InBev in January
200
220 2015 but retaining production in Washington), Georgetown Brewing
172 187 Company (65,000), and Fremont Brewing Company (44,200). Redhook
152 164 167 159 170
100
149 141 Brewery, once Washington’s largest net producer, has since moved its
111
82
primary production to Oregon, though it has invested in a new a tasting
-
21 room in Capitol Hill in Seattle (Exhibit 5).
2005 2006 2007 2008 2009 2010 2011 2012 2013 2014 2015 2016 2017
Sources: Washington State Liquor and Cannabis Board, 2018; Community Attributes Inc., 2019.
11Washington Beer Economic Impact Study
Exhibit 5. Largest Breweries by Net Production, 2017
Number of Net Production Share of Total Net Cumulative Share of Net
Rank Brewery Licenses 2017 (BBLs), 2017 Production, 2017 Production, 2017
1 Elysian Brewing Company* 3 66,300 11% 11%
2 Georgetown Brewing Co. 1 65,000 11% 23%
3 Fremont Brewing Company 1 44,200 8% 30%
4 Mac & Jacks Brewery Inc. 1 38,200 7% 37%
5 Iron Horse Brewery 1 25,400 4% 41%
6 Bale Breaker Brewing Company 1 24,000 4% 45%
7 Redhook Ale Brewery** 1 20,400 4% 49%
8 Silver City Brewery 1 17,900 3% 52%
9 No-Li Brewhouse 1 11,500 2% 54%
10 Pike Brewing Company and Liberty Malt Supply 1 11,300 2% 56%
11 Black Raven Brewing Company 1 10,400 2% 57%
12 Reuben's Brews 2 9,100 2% 59%
13 Kulshan Brewery 2 9,000 2% 61%
14 Hales Ales 1 8,900 2% 62%
15 Fish Brewing Co. 1 8,800 2% 64%
Others, producing less than 8,000 BBLs 363 212,000 36% 100%
Total 382 582,400
*Part of AB InBev **Redhook closed its Woodinville production facility in 2017. Sources: Washington State Liquor and Cannabis Board, 2018; Community Attributes Inc., 2019.
Production Across the State
The vast majority of beer production is concentrated in the Greater
Seattle region, with 55% of reported net production in King County.
However, there are a growing of beer production regions across the
state. These include Kittitas County (4.9% of net production), Yakima
County (4.7%), and Whatcom County (4.6%). Moreover, while King
County is home to more than half of all net production, it represents
less than a third (30%) of all active breweries (Exhibits 6, 7 and 8).
12 Image Source: Washington Beer Commission, 2019Washington Beer Economic Impact Study
Exhibit 6. Brewery Locations Across Washington State, 2017
13Washington Beer Economic Impact Study Exhibit 7. Brewery Locations in Seattle and the Central Puget Sound Region, 2017 14
Washington Beer Economic Impact Study

Exhibit 8. Net Beer Production by County, 2017

                                                                                   Number of Barrels

                                                                                                       15
Washington Beer Economic Impact Study
Jobs, Income, and Wages in Beer Production Exhibit 9. Washington Jobs in Beer Production, 2005-2017
In 2017, an estimated 6,300 workers were employed in breweries, Estimated Jobs
including brewpubs and beer-only operations.4 Income associated with 7,000
these positions, inclusive of wages and benefits, summed to $244.8 6,300
million in 2017. Between 2005 and 2017, estimated annual beer produc- 6,000 5,700
tion employment grew at an annual compound growth rate of 13% per
year, from 1,500 employees to 6,300 over this period (Exhibit 9). 5,000 4,700
Business revenues generated by beer production summed to an esti- 4,000
4,000
mated $581.4 million in 2017 (Exhibit 10). This estimate is inclusive of
3,100
the value of beer sales—either in kegs, packaged (bottles and cans), and
3,000
on-site tasting room sales—as well as souvenirs and additional sales 2,500
at brewpubs in the form of food and other drink options.5 Unlike other 2,000 2,100
1,800 1,900
2,000 1,600
types of beverages and agriculture-based products, such as wine, beer 1,400 1,500
employment is not seasonal. It also can require just one to two individ-
1,000
uals to start and operate a brewery.
Breweries can also be segmented by size of production and employ- -
ment. In 2017, breweries that reported net production of between 500 2005 2006 2007 2008 2009 2010 2011 2012 2013 2014 2015 2016 2017
and 2,000 barrels employed an estimated more than 1,400 workers, or
Sources: Washington State Employment Security Department, 2018; Washington State Liquor
nearly a quarter of all brewery jobs Washington. Approximately 89%
and Cannabis Board, 2018; Community Attributes Inc., 2019.
of all breweries in 2017 produced less than 2,000 barrels (4,000 kegs).
Breweries producing in excess of 25,000 BBLs in 2017 represented 6%
of the total industry workforce (Exhibit 11). Major Beer Corporations in Washington
Anheuser-Busch (AB InBev), North American Breweries, and
Exhibit 10. Summary of Leading Metrics, Beer Production, Heineken all have a presence in Washington state, either through
Statewide, 2017 distribution, acquired craft breweries, or taprooms. AB InBev
bought Seattle-based Elysian Brewing in January 2015 and owns a
stake in Redhook.6,7 Elysian continues to brew beer in Washington
Jobs 6,300
state, with 66,300 BBLs of net production in 2017, equal to 11%
Labor Income (mils $) $250.2
of all Washington state beer production. AB InBev also owns
Business Revenues (mils $) $581.4
Anheuser-Busch Sales of Washington, a distributor in Renton.8
Number of Active Licenses 382 Pyramid Brewing, also founded in Washington, was acquired in
Net Production (thousands of barrels) 582.4 2010 by North American Breweries and maintains only small batch
production and a taproom in Seattle.9 Lagunitas Brewing Company,
Sources: Washington State Employment Security Department, 2018; Washington State which began in Petaluma, California, has been wholly owned by
Department of Revenue, 2019; Washington State Liquor and Cannabis Board, 2018; Heineken since 2017, and that same year opened a brewery and
Community Attributes Inc., 2019.
taproom in Seattle.10
16Washington Beer Economic Impact Study
Exhibit 11. Brewery Net Production and Employment by Production Size, 2017
Number of Number of Share of Net Production Share of Net Share of
Net Production (BBLs) Breweries Licenses Breweries (thous barrels) Production Employment Employment
Fewer than 100 114 117 32% 4.2 1% 1,300 21%
100 to 499 127 132 36% 33.3 6% 1,300 20%
500 to 1,999 73 76 21% 77.3 13% 1,500 23%
2,000 to 4,999 15 24 4% 46.6 8% 900 14%
5,000 to 9,999 12 20 3% 86.6 15% 700 11%
10,000 to 24,999 6 6 2% 95.4 16% 200 4%
25,000 and above 5 7 1% 238.8 41% 400 6%
Total 352 382 100% 582.4 100% 6,300 100%
Sources: Washington State Employment Security Department, 2018; Washington State Liquor and Cannabis Board, 2018; Community Attributes Inc., 2019.
Note: employment figures are rounded to the nearest 100.
Sales and Distribution Patterns Exhibit 12. Distribution of Sales Channels for Washington
Beer, 2013-2017
Beer sales data represent actual sales of beer, irrespective of time
of production, and thus diverge slightly from reported statewide net 100%
production data. In 2017, for example, according the Washington 12% 11% 11% 13% 13%
State Liquor and Cannabis Board, 479,200 barrels of beer were sold by
Washington state breweries (Exhibit 12). These include: 1) self-distribu- 22% 21% 20% 19%
20%
tion; 2) on-premise sales of draft beer at the brewery itself, such as at a Self-Distribution
tasting room or served at a brewpub; and 3) sales—kegs and packaged
68% 69% Breweries
beer—through distributors. Of these, sales through distributors 66% 67% 68%
constituted more than two thirds (68%) of all sales in 2017, followed by Distributors
50%
brewery on-premise sales (20%).
0%
2013 2014 2015 2016 2017
Sources: Washington State Liquor and Cannabis Board, 2018; Community Attributes Inc., 2019.
Note: reported subtotals may not sum to 100% due to rounding.
Image Source: Washington Beer Commission, 2019
17Washington Beer Economic Impact Study
By mode of sale, in 2017 nearly half of all Washington beer sold by resort to off-site keg sales as their first foray into distribution, due in
volume was in the form of kegs. This is down from a peak of 66% in large part to the high capital costs of packaging, such as the purchase
2013, while draft sales at on-site tasting rooms and brewpubs has of an on-site canning machine which can cost hundreds of thousands of
increased from 4% in 2014 to more than one fifth of all sold beer dollars or more.
in 2017 (Exhibit 13). These figures likely reflect the growth in small As breweries grow and scale production, distribution typically becomes
breweries across the state, many of which rely on on-site sales as their an increasingly important channel for sales. For example, among
primary sales channel. Washington’s largest breweries by net production, an estimated 91% of
Exhibit 13. Type of Sale for Barrels of Beer Produced in Georgetown’s sales are through distributors, 90% for Fremont Brewery,
Washington, 2007-2017 98% for Mac & Jack, and 90% for Bale Breaker.
Share of Barrels
Share of Barrels of of Beer Sold However, breweries report challenges and risks in finding and
Beer Sold
maintaining a strong distributor relationship. For many breweries, distri-
100%
5% 4% 4%
bution is a matter of scale; a given brewery, after signing a distribution
6% 5% 6% 6% 5% 9% 17% 20%
31%
agreement, must guarantee a consistent volume of production on a
42% 37% 34% 31% 30%
41% 42%
33% regular basis. Brewers fear potentially greater damage to the business
from signing a distributor agreement and failing to consistently deliver
30% Pints and
31% Grow lers on the agreed upon volume than to hold back sales opportunities from
not signing a distributor agreement. For supermarkets and grocery
66%
chains, alcohol sales represent a disproportionate revenue source;
64% 65%
61% when a contracted brewery is unable to maintain its vendor relation-
57% 58%
50% Bottles ship and contractual obligations with these entities, stores will suffer
53% 53% 54%
52% and Cans
49% revenue losses from empty shelf space.
Brewers also find it increasingly difficult to secure a distributor relation-
ship. In recent years there have been at least two important shifts in the
Kegs distributor system. Consolidation and acquisitions within distribution
networks has made it more challenging for local brewers to tap into
broader sales channels. Some of the larger national and multi-na-
tional corporate beer producers, such as Anheuser-Busch InBev,
0% have purchased both craft breweries and distributors. These larger
2007 2009 2011 2013 2015 2017
entities have a natural preference for distributing their own products,
Sources: U.S. Tax and Trade Bureau, 2018; Community Attributes Inc., 2019. potentially excluding up and coming craft breweries. Secondly, brewers
Sales of packaged product and on-site draft pints yield a much higher perceive a trend towards greater centralization among supermarket
sales-to-volume ratio compared with off-site keg sales. For example, on procurement in recent years, reversing a more localized purchasing
average, a keg of beer sold via distributor may generate between $150 model. This model has made it more difficult for local brewers to build
and $200 for the brewery. The recipient purchasing bar or restaurant, vendor relationships with purchasing agents due to increased sales
assuming an average price per pint of $5 and 124 pints per keg, can in
turn generate upwards of $620 per keg, representing a nearly 4 to 1
ratio in sales. However, most breweries, in growing their business, often
18Washington Beer Economic Impact Study
volume requirements, as fewer purchasing agents manage a greater 4. Economic and Fiscal Impacts
number of outlets. While the number of craft breweries has increased
Economic impacts refer to the sum of activities directly attributable
significantly in recent years, the number of unique SKUs (stock-keeping
to beer production and additional sales support through upstream
unit) for beer available at retail outlets has not increased at nearly the
business-to-business transactions (indirect impacts) and household
same rate.
consumption expenditures from income earned through direct and
Tourism and Festivals indirect employment (induced). Fiscal impacts, discussed further below,
represent additional tax revenues supported through these economic
Throughout the year, the Washington Beer Commission and Washington
activities.
Brewers Guild organize several festivals to celebrate and promote
Washington craft beer. These include the Washington Brewers Fest,
Breweries and Beer Production in Washington
which attracted nearly 20,000 unique visitors in 2017. Exhibit 14 below
In 2017, beer production and related activities supported a total of
summarizes major beer promotion events throughout the year and
11,000 jobs and more than $1.4 billion in business revenues across the
attendance at each. In addition to these events, many other local and
state economy. These impacts include 3,100 jobs and $477.9 million in
community groups organize beer festivals and events not captured
business revenues supported through induced impacts (Exhibit 15).
in these figures, such as annual neighborhood beer fests throughout
Interpreted as multipliers, each job in beer production was associated
Seattle, further elevating the visibility of Washington craft beer.
with a total of 1.7 jobs across the state. Similarly, each dollar of revenue
Exhibit 14. Festivals Organized by the Washington Beer generated directly in beer production supported through indirect and
Commission and Washington Brewers Guild in 2017 and induced effects an additional $1.50 in revenues among other industries
Number of Unique Attendees and businesses statewide.
2017 Event Attendees Exhibit 15. Economic Impacts of Beer Production in
Brewers Festival 19,800 Washington State, 2017
Winter Beer Fest* 3,500
Inland 3,300
Direct Indirect Induced Total
Bremerton 2,700
Jobs 6,300 1,600 3,100 11,000
Belgian Fest 2,200
Total Compensation (mils 2017 $) $250.2 $111.1 $162.0 $523.3
Cask Fest* 1,900
Business Revenue (mils 2017 $) $581.4 $386.5 $477.9 $1,445.8
Beer Collaboration 1,700
Tri-Cities 1,300
Sources: Washington State Office of Financial Management, 2017; Community Attributes Inc.,
South Sound 800
2019.
Total 37,200
Estimates are based on the Washington State Input-Output Model,
Sources: Washington Beer Commission, 2018; Washington Brewers Guild, 2018. published by the Washington State Office of Financial Management; esti-
Above are the updated numbers of paid attendees for 2017 beer events produced by the mated values for revenue, jobs, and labor income discussed in earlier
Washington Beer Commission and Washington Brewers Guild*
sections of this report; and estimated state-based first round purchases,
Of the 37,200 reported visitors to these events, an estimated 5% came or “direct requirements,” made by breweries as part of their overall
from outside Washington state, based on analysis of event registration production costs. These include the purchase of local hops, malted
records, or approximately 1,900 individuals. These visitors are esti- grains, capital expenditures, water, electricity, and labor costs, among
mated to have spent $1.5 million on local goods and services, in turn
supporting nearly $300,000 in labor income.11
19Washington Beer Economic Impact Study
many other purchases and key inputs. Impact estimates assumed a 5. Washington Beer Industry Outlook
labor share of total brewery costs of approximately 30%, based on
Washington’s beer industry has grown at a significant pace over the
existing research, labor income estimates, and brewery feedback and
past decade and demand continues to grow for Washington beer.
validation. An estimated 37% of brewery commodity and merchandise
Washington’s total beer consumption remains strong and Washington
purchases necessary for beer production were made from Washington
brewers have much room to grow through market share of Washington
state businesses and farmers.
consumption alone. The number of licensed, active craft brewery oper-
Fiscal Impacts ations in Washington has increased more than four-fold between 2007
and 2017.14
Beer production further supports tax revenues collected by the state in
various forms, including B&O, sales & use, and excise taxes. Based on Industry growth can include more local breweries and expansion of
data provided by the Washington State Department of Revenue, in fiscal existing breweries. Washington brewers expressed optimism that
year 2017, Washington state breweries and brewpubs paid more than the industry will continue to grow, though it is becoming increasingly
$2.4 million in B&O tax and $14.6 million in state sales tax. Breweries competitive in their view. The main thrust of their effort for
and brewpubs also paid $6.4 million in local sales tax.12 Excise taxes growth in Washington will remain focused on the local market, serving
paid on beer sales in Washington include payments from direct sales local communities.
at Washington breweries and sales by distributors of Washington state
Business Survival and Turnover
beer. These tax revenues summed to $2.6 million in 2017.13 (Exhibit 16)
In 2009, during the last recession, there were 93 Washington breweries,
Exhibit 16. Excise Taxes from Sale of Washington State including those with multiple licensed locations (92 excluding Redhook).
Beer, 2005-2017 Of these:
Millions 2017 $ –– Only one brewery (Mac & Jack’s) produced more than 30,000 net
$3.0 barrels
$2.6
$2.4 $2.5 –– Two produced between 10,000 and 30,000 barrels
$2.5
$2.1 $0.8
$2.0 $0.7 $0.7 –– 15 (16%) produced between 2,000 and 10,000 barrels
$2.0 $1.8
$1.7 $1.6 $0.6 –– 18 (20%) produced between 500 and 2,000 barrels
$1.5 $0.6
$0.6
$1.5 $0.5 $0.5 $1.7 $1.8 $1.8 –– 35 (38%) between 100 and 500 barrels.
$1.1 $1.1 $1.1 $1.2 $0.5 $1.5
Of these operations, by 2017 roughly 70% remained in operation. In
$1.0 $1.2 $1.3 $1.3
$0.3 $0.3 $0.4 $0.4 $1.1 2017, among those same breweries:
$1.0
$0.5 $0.8 $0.7 $0.8 $0.8 –– Four produced more than 30,000 barrels in net production
–– Four produced between 10,000 and 30,000
$0.0
2005 2007 2009 2011 2013 2015 2017 –– 13 produced between 2,000 and 10,000.
Sources: Washington Liquor and Cannabis Board, 2018; Federal Reserve Bank of St. Louis, Among those that produced at least 500 barrels in 2009, 89% were still
2018; Community Attributes Inc., 2019.
in operation in 2017. Of the 56 breweries in 2009 that produced less
than 500 net barrels, only 13 survived and increased production to 500
or more barrels in 2017.15
20Washington Beer Economic Impact Study
Opportunities Exhibit 17. Washington State Brewery Shares of In-state
Distributor Sales, 2004-2017
Global Demand for Craft Beer Share (%) of Beer Sold in Washington
The emergence of craft breweries in Washington in recent years has
been part of a general trend across the U.S., and even internationally, 15%
as beer drinkers increasingly desire more complex styles and flavors.
According to the Brewers Association, the national trade association for
12% 11%
craft breweries, craft beer is now in every state,16 and the vast majority 11%
10%
of U.S. adults live within 10 miles of a craft brewery.17 In the past five
10% 9%
years, Europe surpassed North America in number of craft beer retail
launches, though the U.S. remained the top single market in 2017.18 8%
8%
7% 7%
Washington Markets
5% 5% 6%
In 2017, 4.7 million barrels of beer were sold to consumers in 5%
5% 4%
Washington state via distributors to restaurants and bars, representing
the vast majority of overall beer sales in the state. Statewide growth
in beer consumption is strong, as indicated by nearly 6% real annual
growth from 2012 to 2017 in taxable retail sales from restaurants, bars,
retail and wholesalers of alcohol, and alcohol beverage producers.19
0%
Washington beers represented 11% of distributors sales in 2017, nearly 2004 2006 2008 2010 2012 2014 2016
three times the 4% of distributors’ sales in 2005 (Exhibit 17). Local
Source: Washington State Liquor and Cannabis Board, 2019.
brewery in-state distribution sales increased 180% over this period,
compared to overall distributor beer sales growth of 15%. This is strong Growth in Numbers of Small Brewers
growth in Washington market share (and does not even account for Smaller craft brewers and their tap rooms compete with neighborhood
sales on-site, in tap rooms, and direct sales to restaurants).20 bars and restaurants. Some offer food themselves and are truly a full
food and beer experience. In other cases, as is increasingly popular,
food trucks pull up outside of the tap room and the two together
effectively serve as an eating and drinking establishment. Throughout
Washington state, wherever restaurants and bars exist, a craft brewer
has an opportunity to offer a quality product and attract customers to a
new experience.
Only 38 breweries in Washington, or about 11% of all breweries in the
state, produced more than 2,000 net barrels of beer in 2017, which
demonstrates the success of smaller brewers. However, even among
smaller breweries, gaining access to bars and tap rooms is highly
competitive, and each facility can only accommodate a finite number of
taps and small brewers’ beers.
Image Source: Washington Beer Commission, 2019
21Washington Beer Economic Impact Study
Challenges For example, a brewery might earn more than $600 on a keg of beer
sold by the pint in their tasting room at $5 per pint. When selling to a
Expansion Costs distributor, the brewer might receive just $150—one fourth the revenue
The capital costs necessary to grow can be prohibitively expensive for of direct sales. Brewers may net even lower revenues when selling
small brewers. To grow from a 2,000 to 4,000-barrel production outside of Washington state, given additional shipment costs.
system, a brewery must buy new fermenters costing up to $15,000 each, Market barriers are high out of state as well, as craft brewers have
plus conditioning containers. Bottling and canning requires significant grown rapidly in other states and customers show loyalty to their local
capital investment as well. The expansion of equipment in all likelihood beers. Washington beers must compete with an increasingly robust
leads to the need for more production space to install and operate a market of local craft beers and established brands, such Deschutes and
larger system. Sierra Nevada. Breweries in destination markets include those owned
In addition to capital costs, growth requires ownership commitment and by global corporations such as AB InBev, which brings access to capital
managerial capacity, which small business owners may not be able or and marketing and extensive distribution networks.
willing to take on. Additional sales force capacity is critical, and growth Out of state consumers must therefore be willing to pay more for
through distributors presents its own challenges, described in the Washington beer for growth-oriented Washington craft breweries to
following section. profit from exports. To gain market share outside the state, consumers
must appreciate Washington beer’s quality, distinctive taste, and
Distributors and Wholesale Channels
branding. Examples of breweries with some success selling into out-of-
Distributors and wholesale channels are a challenge to growth for
state markets include Georgetown (in California and Oregon), Icicle
many smaller and up-and-coming breweries. In recent years, the
(Northern Idaho), Fremont (West Coast, Montana, and Colorado), and
number of breweries has expanded at a rapid rate, but the amount
Iron Horse (Idaho, Alaska, Montana, and Oregon).
of space allocated for craft brewery sales at local supermarkets has
not expanded at the same rate. Moreover, the distributor network has Some of the largest regional and national craft breweries have struggled
consolidated in recent years. This means fewer distributors handle to maintain market share, as craft beers flourish in their destina-
larger accounts, many of which are owned by national brewers and tion markets out of state. In December 2018, Oregon’s Deschutes
global brands such as AB InBev. These corporations acquire craft Brewery—ranked the tenth largest craft brewery in the U.S.—reduced
brewers and prioritize the distribution of their own portfolio brands its workforce by 7% and canceled plans to build a second production
through their own distribution networks, creating challenges for true facility in Virginia due to declining sales outside of Oregon. Workforce
craft brewers to benefit from distributors. reductions were also reported at Lagunitas, New Belgium, Green Flash,
Ninkasi, and Avery Brewing—all established exporters of craft beers.21
Consolidation also leads to a preference for brands able to supply suffi-
cient volume for a wider, larger network of grocery stores and retailers. State Business Climate for Small Brewers
Most craft breweries do not have the production capacity to supply Some brewers view the tax system between Washington and Oregon as
volumes required for larger distribution networks. disadvantageous to Washington breweries. Washington’s barrel volume
tax hinders the growth of its state’s larger craft breweries and is viewed
Export Challenges
as regressive to smaller businesses.
Challenges exist for brewers striving to build regional or national brands
through exports. Distribution contracts often result in brewers earning a
fraction of what can be earned through sales on-site in their tap rooms.
22Washington Beer Economic Impact Study
6. Summary and Conclusions breweries worked with a distributor. For the eight largest breweries,
representing more than half of all net production statewide, distribution
Washington’s beer industry has experienced rapid growth in recent
channel sales by volume averaged more than 90% of all sales in 2017.
years. Between 2005 and 2017 (last full year of data), net production
More than 75% of breweries use self-distribution, taprooms, and brew-
increased 7% per year.22 Excluding Redhook, which relocated its
pubs as their only sales channels.
production to Oregon, production increased 16% per year. The number
of active licensed brewery operations increased from 94 in 2005 to 391 The taproom business model has enabled much of the growth in small
in the autumn of 2018. This growth reflects both national trends and the breweries. Taprooms allow small operations to sell beer directly to
state’s own qualities. Washington is home to the largest single source of consumers without additional costs, such as operating a kitchen and
hop production in the world and 75% of all U.S. hop production. dining facility. Through taprooms, breweries fully capture these reve-
nues, whereas sales through distributors generate much lower returns
Breweries include taprooms, brewpubs, and production facilities—any
for breweries on a per barrel, or BBL, basis. However, for breweries
place that makes beer. In 2017, these businesses directly employed
that seek to expand sales, distributors and significant investments
an estimated 6,300 full- and part-time workers and generated $581.4
in higher capacity barrel systems are required, each with their own
million in business revenues. Breweries in Washington had a total
inherent challenges.
economic impact of 11,000 jobs and more than $1.4 billion in business
revenues, reflecting business-to-business transactions (indirect) and Beer sales in Washington state remain dominated by large out-of-state
worker household consumption (induced). producers, including both major labels—such as those under AB InBev
and Pabst Blue Ribbon—and larger regional craft breweries such as
The vast majority of Washington breweries are small, family-owned, and
those out of Oregon and California. In 2017, an estimated 11% of all
are an integral part of their local communities. Of the 352 breweries
beer sold by distributors (representing the vast majority of all beer sales
in 2017 (including those with multiple production licenses), nearly 90%
by volume) were of beer from Washington, up from 4.3% in 2005.
produced less than 2,000 barrels. Taprooms often serve as locations for
public gatherings and events. At least one brewery exists in 130 cities Growth opportunities exist for breweries of all sizes, though with their
and towns across the state, out of 281 incorporated municipalities. own unique challenges. The number of new breweries continues to
Seattle is home to largest number of brewery locations, with 66 in 2017, grow, meeting a demand for small, neighborhood craft breweries across
followed by Vancouver (19), Tacoma (16), Spokane (14), and the state.
Bellingham (13).
Distribution networks are a critical for breweries to grow from a small
business to a regional operation. The majority of beer sold by volume
is through distribution networks, ultimately for final sale in restaurants,
bars, and stores. In 2017, an estimated two-thirds of all brewery sales
by volume were via distributors, with the remainder in taproom sales,
brewpubs, and self-distribution.
Larger brewers benefit most from distributors and distribution is a
significant revenue challenge for smaller brewers. Whereas a barrel
of draft beer (two kegs) sold by pint in a taproom can earn $1,200 or
more in sales, the same quantity sold to distributors typically generates
$300 or less for the brewery. In 2017, approximately one-fourth of all
Image Source: Washington Beer Commission, 2019
23Washington Beer Economic Impact Study
Endnotes
1. “The Craft Brewing Industry Contributed $76.2 Billion to the U.S. Economy 12. Washington State Department of Revenue, 2019. Estimates based on licensed
in 2017, more than 500,000 Jobs,” Brewers Association, https://www. breweries in Washington state.
brewersassociation.org/statistics/economic-impact-data/. 13. Beer tax is calculated at $4.782/barrel (60 under) and $8.08 (60 over). From
2. The data on net production is collected through the Washington State Liquor June 1, 2010 through June 30, 2013, an additional tax of $15.50 was imposed
and Cannabis Board’s Form LIQ-526, which should match the data reported by per RCW 66.24.290 (5)(a) which raised the high-rate (60 over) to $23.58.
breweries to U.S. Alcohol and Tobacco Tax and Trade Bureau through Form F 14. There are several licenses with no active beer production in a given year.
5130.9. Throughout this report, only those licenses associated with net beer
3. The Washington State Liquor and Cannabis Board reports total licenses, production are considered.
irrespective of whether the licensed operation is actively producing beer. 15. Washington State Liquor and Cannabis Board, 2018; Community Attributes
In 2017, for example, 50 licenses were attached to operations that either Inc., 2019.
produced no beer or reported a negative amount due to data adjustments.
16. https://www.crresearch.com/blog/state-craft-beer
Both measurements are reported in Exhibit 4.
17. https://www.beveragedaily.com/Article/2017/03/28/Brewers-Association-20-
4. These jobs are spread across a range of businesses, including those classified
market-share-for-craft-beer-now-a-longshot
in government records (based on the North American Industry Classification
System, or “NAICS”) as exclusively breweries (about one third of all jobs), 18. https://www.beveragedaily.com/Article/2018/09/21/Top-10-markets-for-craft-
brewery operations at restaurants and brewpubs, bars that produce beer, beer-innovation-Europe-now-outpaces-North-America
malt manufacturers, other businesses, and self-employed workers.
19. Sources: Washington State Department of Revenue, 2019; Federal Reserve
5. Washington State Department of Revenue, 2019. Estimate was based on a Bank of St. Louis, 2019; Community Attributes Inc., 2019.
custom data request of all licensed breweries using each brewery’s unique
20. This is down slightly from 12% in 2016 (attributable to the relocation of
business identification code, or UBI.
Redhook out of state)
6. Consumer Reports, April 13, 2016. https://www.consumerreports.org/
21. Kendall, Justin (December 17, 2018), “Deschutes Cuts 7 Percent of Workforce,”
consumerist/here-are-the-8-u-s-craft-brewers-bought-by-anheuser-busch-
retrieved at https://www.brewbound.com/news/deschutes-cuts-7-percent-of-
since-2011/
workforce
7. American Craft Beer, May 13, 2017. https://www.americancraftbeer.com/fake-
22. The data on net production is collected through the Washington State Liquor
brews-craft-breweries-no-longer/
and Cannabis Board’s Form LIQ-526, which should match the data reported by
8. Anheuser-Busch, Wholesalers. https://www.anheuser-busch.com/about/ breweries to U.S. Alcohol and Tobacco Tax and Trade Bureau through Form F
wholesaler.html 5130.9.
9. CSP Daily News, October 25, 2018. https://www.cspdailynews.com/beverages/
north-american-breweries-changes-name-reorganizes
10. Fortune, May 4, 2017. http://fortune.com/2017/05/04/heineken-lagunitas-
takeover/
11. Estimates are based on Dean Runyan visitor spending estimates for
Washington state, with additional customizations for beer festival attendees.
Source: Dean Runyan Associates, “Washington State Travel Impacts & Visitor
Volume,” 2017. 2000 – 2017.
24You can also read